 The one number you need to grow.
That was the title of the 2003 HBR article by Fred Reichheld that introduced the Net Promoter Score as a way to measure customer loyalty.
It’s a strong claim that a single attitudinal item can portend company success. And strong claims need strong evidence (or at least corroborating evidence).
In an earlier article, I examined the original evidence put forth by Reichheld and looked for any other published evidence and discussed the findings at the event, How Harmful is the Net Promoter Score?
To establish the validity and make the claim that the NPS predicts growth, Fred Reichheld reported that the NPS was the best or second-best predictor of growth in 11 of 14 industries (p. 28).
The data he provided in the appendix of his 2006 book The Ultimate Question to support the relationship shows data from 35 companies in six industries (computers, life insurance, Korean auto insurance, U.S. airlines, Internet Service Providers, and UK supermarkets). His 2003 HBR article contained five more companies and one additional industry (rental cars) for a total of 40 companies and 7 industries.
Close examination of the data reveals that Reichheld used historical, not future growth. He showed the three-year average growth rates (1999–2002) correlated with the two-year average Net Promoter Scores (2001–2002). In other words, the NPS correlated with past growth rates (as opposed to future growth rates). This does establish validity (a sort of concurrent validity) but not predictive validity.
To assess the predictive ability of the NPS, I looked at the U.S. airline industry in 2013 and found a strong correlation between future growth and NPS (but only after accounting for a major merger in the industry).
The published literature on the topic in the last 15 years isn’t terribly helpful either. I found eight other studies that examined the NPS’s predictive ability (Figure 1). I was, however, a bit disappointed in the quality of many of the studies given the ubiquity of the Net Promoter Score.
As Figure 1 shows, three of the eight studies found medium to strong correlations but used historical or current revenue (not future). Of the five remaining studies that used future metrics, two were authored by a competitor of Satmetrix (a possible competitive bias) and one was from a book with connections to Satmetix and not peer reviewed (with an agenda to promote the NPS).

Figure 1: Summary of papers examining the NPS and growth (many used historical revenue or had methodological flaws—like not actually using the 11-point LTR item).
Surprisingly, two of the three studies that looked at future metrics didn’t use the 11-point Likelihood to Recommend question (Keiningham et al., 2007b; Morgan and Rego, 2006). One study that used a 10-point version that found no correlation with business growth also found no correlation with any metrics at the firm level for three Norwegian industries it examined (Keiningham et al., 2007a), which was an unusual finding given all other studies found some correlation with metrics.
Only the study by de Haan et al. (2015) actually used the 11-point Likelihood to Recommend item and found the Net Promoter Score did have a small correlation with future intent (collected in a longitudinal study). It wasn’t the best predictor, but it did correlate with future metrics (which was similar to the finding from the study by Keiningham et al., 2007b using a 5-point LTR).
I think there are at least two reasons for the dearth of published data examining the NPS and growth:
- Little upside: There’s little upside for Satmetrix and Reichheld to fund and publish more research to establish the predictive validity of the NPS. If it’s already in wide usage (most Fortune 500 companies use it), then there’s little to gain. That Reichheld didn’t include more data in his 2nd edition of The Ultimate Question likely supports this. (He even excluded the appendix that was in the 1st.)
- It’s difficult: Predicting revenue at the customer or company level requires data from two points in time. Longitudinal data takes time to collect (by definition years in this case). It’s also hard to associate attitudinal data to financial performance. Companies have little reason to expose their own data and third-party firms have trouble getting access.
Predicting Future Growth with the Original Data
A few papers I cited above pointed out the problem with Reichheld using historical revenue to show future growth but none I found actually looked to see whether the published NPS data predicted future growth for the same industries. Keiningham (2007a) did use some of Reichheld’s data to show that the American Consumer Satisfaction Index was an equal or better predictor of historical revenue, but didn’t look at future growth.
So, I revisited the very data used to establish the NPS validity—the 1999–2002 Net Promoter Score data Reichheld published in his 2006 book appendix and 2003 HBR article.
With the help of research assistants, I dug through old annual reports, press releases, articles, and the Internet Archive to match the financial metrics collected more than 15 years ago. It wasn’t easy, as many companies merged or went out of business, and whole industries morphed (AOL anyone?). We had to piece together numbers from many different sources and make some assumptions (noted below).
After several weeks of digging we had good results and were able to find data for the same six industries used in the 2006 book plus the one industry included in the HBR article for the years 2002–2006. Table 1 shows the industry, the metric we used, the year the NPS data was reported in Reichheld’s book, the current/historical years Reichheld used, and then the years we found data for to predict future growth.
| Industry | Metric | NPS Data | Reichheld Years | Our Future Years |
|---|---|---|---|---|
| U.S. PC market | PC Shipments | 2001-2001 | 1999-2002 | 2002-2005 |
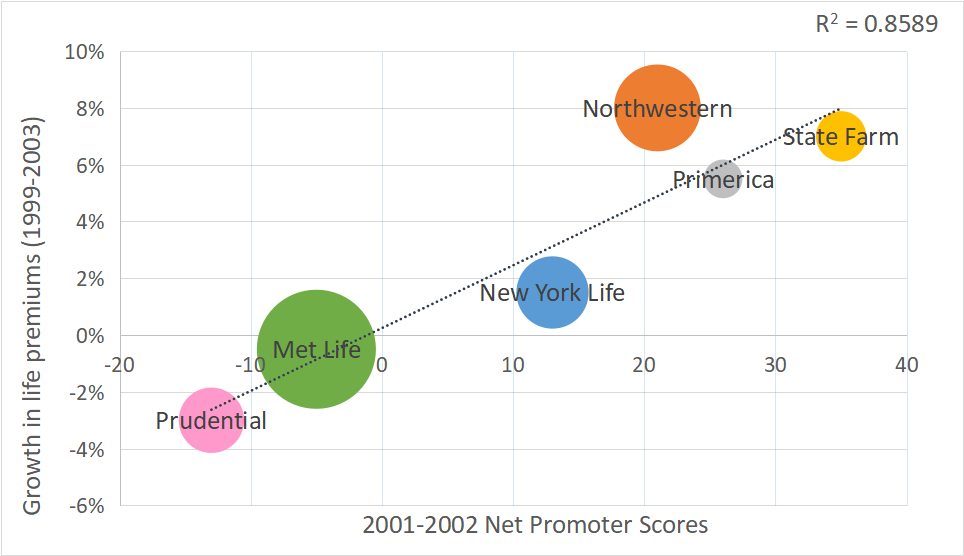
| U.S. Life Insurance market | Life premiums | 2001-2002 | 1999-2003 | 2002-2005 |
| U.S. airlines market | Sales | 2001-2002 | 1999-2002 | 2002-2005 |
| U.S. Internet Service Providers | Sales | 2002 | 1999-2002 | 2002-2005 |
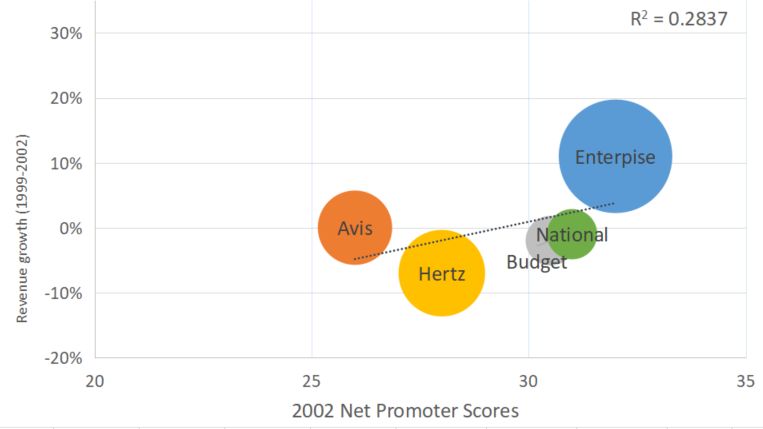
| U.S. car rental market | Revenue | 2002 | 1999-2002 | 2002-2005 |
| UK supermarkets | Sales | 2003 | 1999-2003 | 2003-2006 |
| Korean auto insurance | Sales | 2003 | 2001-2003 | 2003-2006 |
Table 1: Industries used to establish the predictive ability of the Net Promoter Score from The Ultimate Question and the 2003 HBR article.
Results
We used two future growth periods to assess the predictive validity of the NPS. The first are the two years immediately following the NPS data (and graphed below). For the U.S. industries this was 2002–2003; for the international industries this was 2003–2004 (which matches the years of NPS data Reichheld used). The second includes a longer period of three to four years of growth (2002–2005 for U.S. industries and 2003–2006 for international). We computed Pearson correlations for each industry, then averaged the correlations using the Fisher Z transformation to account for the non-normality in correlations. Finally, we converted the correlations to R2 values to match the fit statistic reported in The Ultimate Question.
Reichheld notes that they found the log of the change in NPS would boost the explanatory power (R2) of NPS but they reported only raw NPS numbers in the appendix. With only one year of NPS data, we didn’t have changes in the NPS so we replicated the approach in the appendix using only the data from the single Net Promoter Scores.
Table 2 shows the results for Reichheld’s originally reported R2 values using current or historical revenue and our R2 values for the subsequent two and four years.
A bit to my surprise (given the many vocal critics and lack of published data), we found evidence that the Net Promoter Score predicted growth in both the subsequent two- and four-year periods. On average we found the Net Promoter Scores reported by Reichheld explained 38% of the changes in growth for the seven industries examined for the immediate two years (low of 8% to a high of 76%). The explanatory power decreased some when the future period increased (which is not too surprising given what can change in four years). For the four-year period, the average explanatory power of the NPS is still 30% (low of 4% to a high of 79%).
To put these R2 values into perspective, the SAT can explain (predict) around 25% of first year college grades, which means these R2 values are impressively large.
| Reichheld Historical R^Sq | 2-Year Future Growth R^Sq | 4-Year Future Growth R^Sq | |
|---|---|---|---|
| U.S. PC market | 68% | 27% | 75% |
| U.S. Insurance market | 86% | 39% | 4% |
| U.S. airlines market | 68% | 8% | 22% |
| U.S. Internet Service Providers | 93% | 20% | 2% |
| U.S. car rentals | 28% | 8% | 8% |
| UK supermarkets | 84% | 76% | 79% |
| Korean auto insurance | 68% | 48% | 12% |
| Avg R2(Fisher Transformed) | 76% | 38% | 30% |
Table 2: R2 values of seven industries from Reichheld’s NPS data compared to historically reported revenue and two-year and four-year growth rates by industry. The Fisher R to Z transformation was used to average the correlations before converting to R2 averages. *Reichheld reported an R2 of 68% for Korean auto but our replication from the scatterplots generated a value of ~30%. See other notes below by industry.
Below we have re-created the bubble scatterplots from Reichheld and compared that with our two-year future data. We estimated the regression lines, R2 values and bubble size using a similar approach as described in Keiningham et al 2007a.
PC Shipments
| Historical R2 = 74% | Future (2 Years): R2 = 27% |
 |
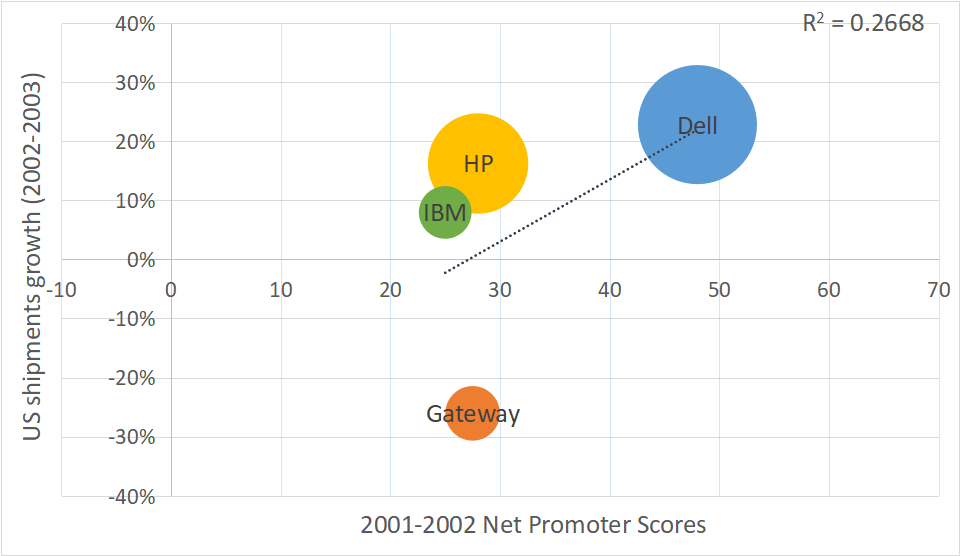 |
Note: Compaq was purchased by Dell so is not included in future years. IBM sold its PC industry to Lenovo in 2005 so calculation only includes growth rates between 2002–2004 instead of 2002–2005. Gateway merged with eMachines in 2004; growth rates are also only 2002–2004 and only include Gateway numbers.
US Life Insurance
| Historical R2 = 86% | Future (2 Years): R2 = 39% |
 |
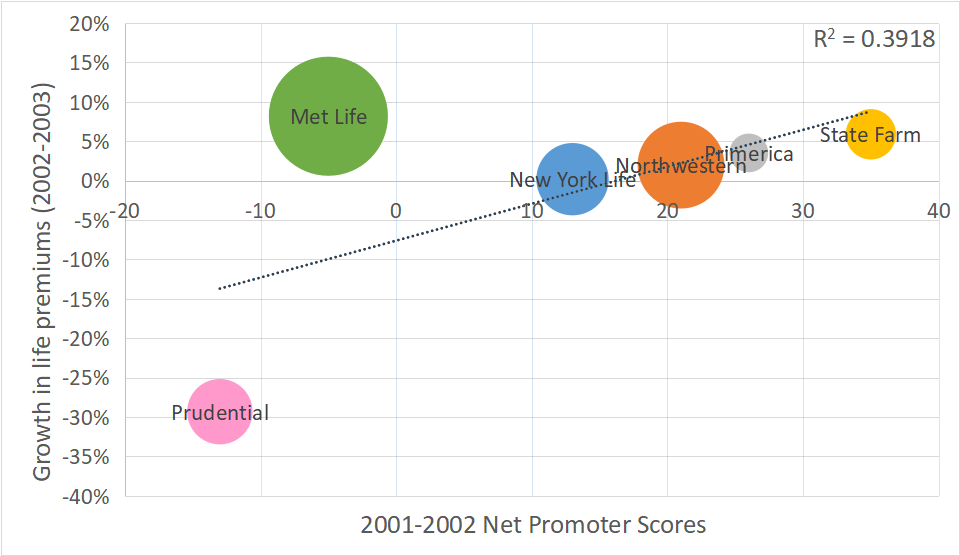 |
Note: For Prudential we used growth rates in British pounds, but bubble size on the chart is determined by converted number of life premiums in U.S. dollars.
US Airlines
| Historical R2 = 66% | Future (2 Years): R2 = 8% |
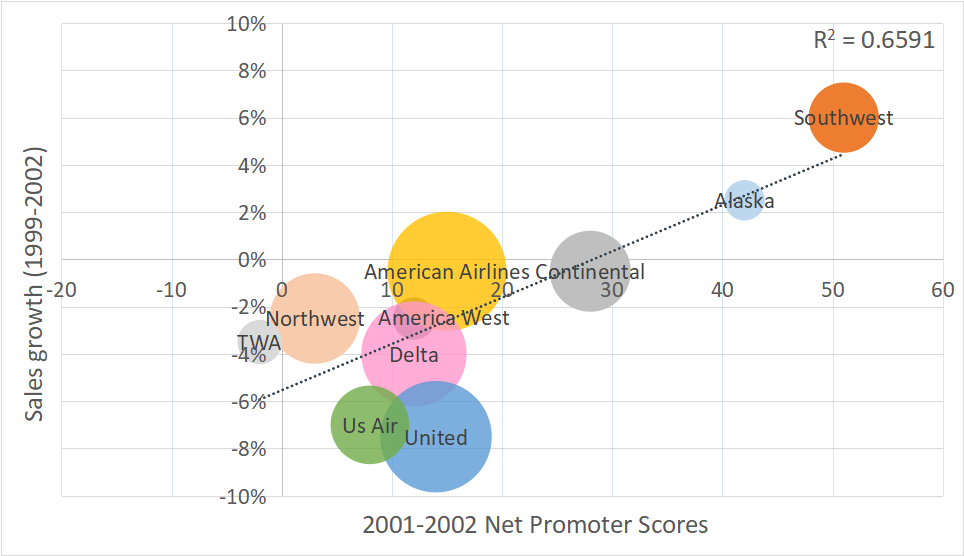 |
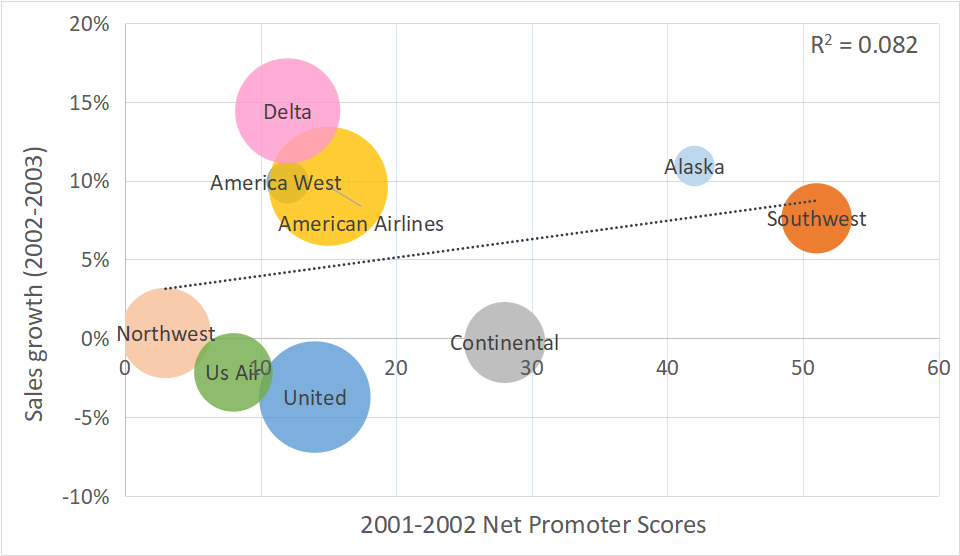 |
Note: TWA stopped operations in 2001 and wasn’t included in calculation for future years. America West Airlines four-year growth period is between 2002–2004 as they merged with US Airways Group in 2005.
Internet Service Providers (ISPs)
| Historical R2 = 89% | Future (2 Years): R2 = 20% |
 |
 |
UK Grocery Stores
| Historical R2 = 81% | Future (2 Years): R2 = 76% |
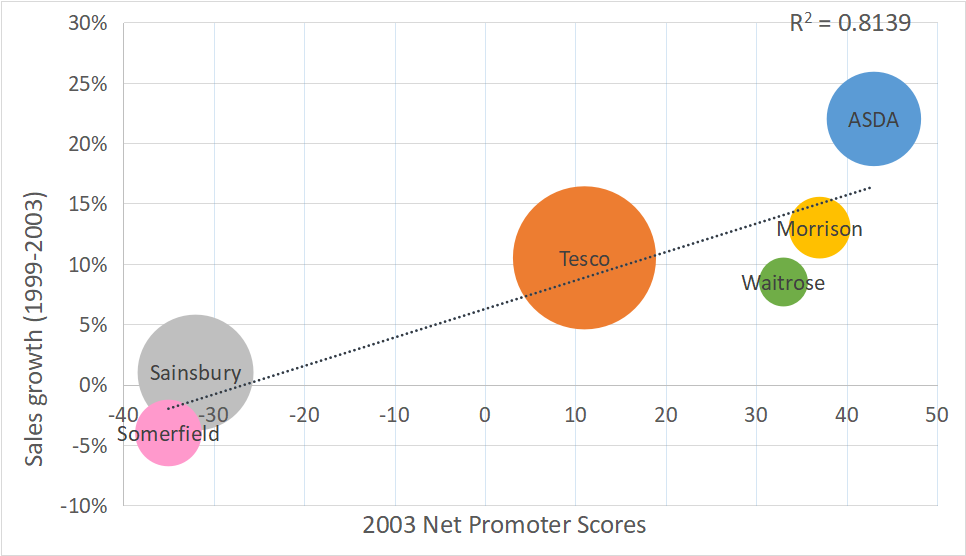 |
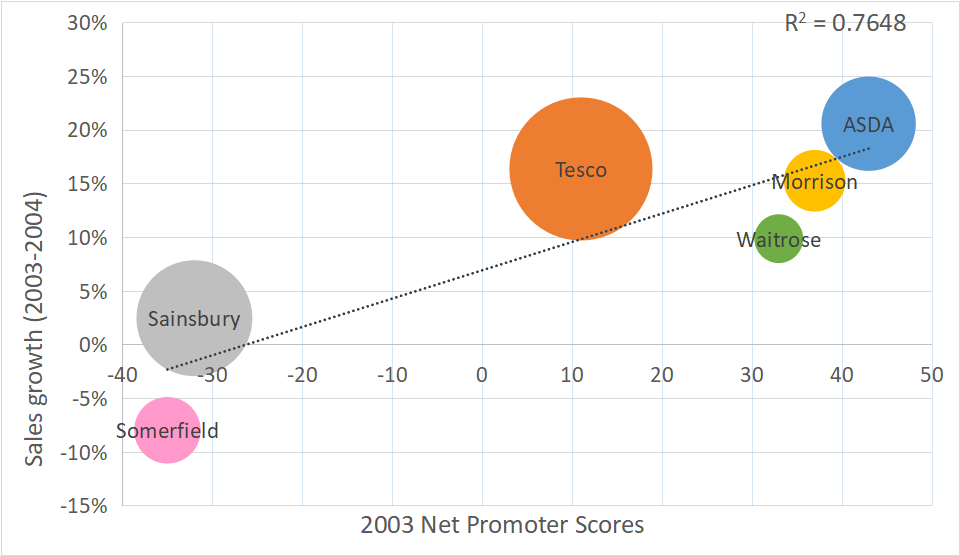 |
Note: For ASDA we used growth rates in USD, but the bubble size on the chart is determined by converted number of sales in British pounds.
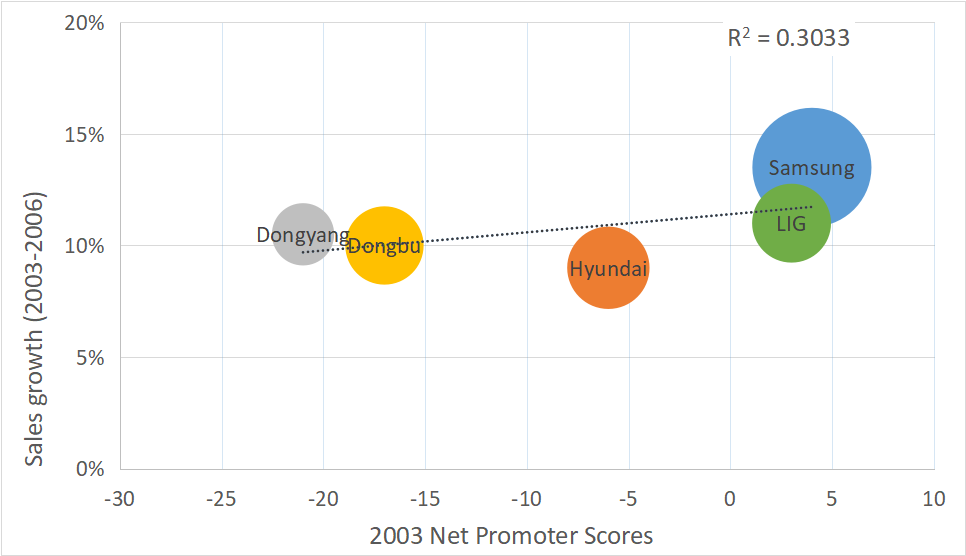
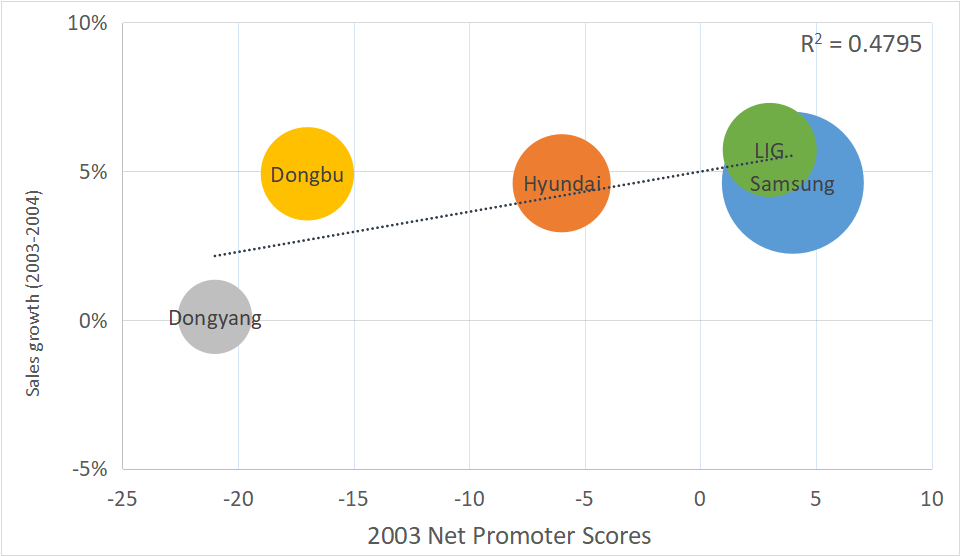
Korean Auto Insurance
| Historical R2 = 68%/30%* | Future (2 Years): R2 = 48% |
 |
 |
Note: Reichheld reports an R2 of 68% but we calculated a much lower R2 of 30% from the same data.
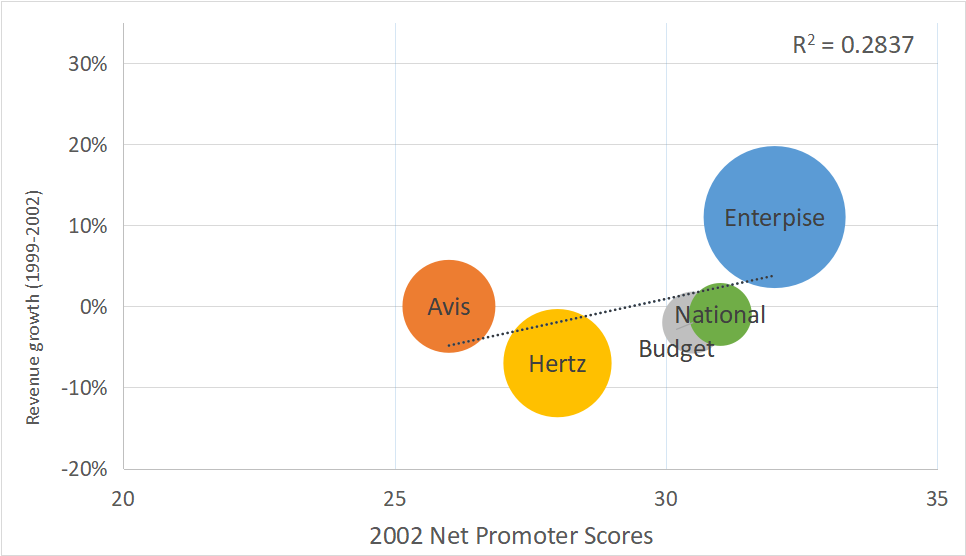
U.S. Rental Cars
| Historical R2 = 28% | Future (2 Years): R2 = 17% |
 |
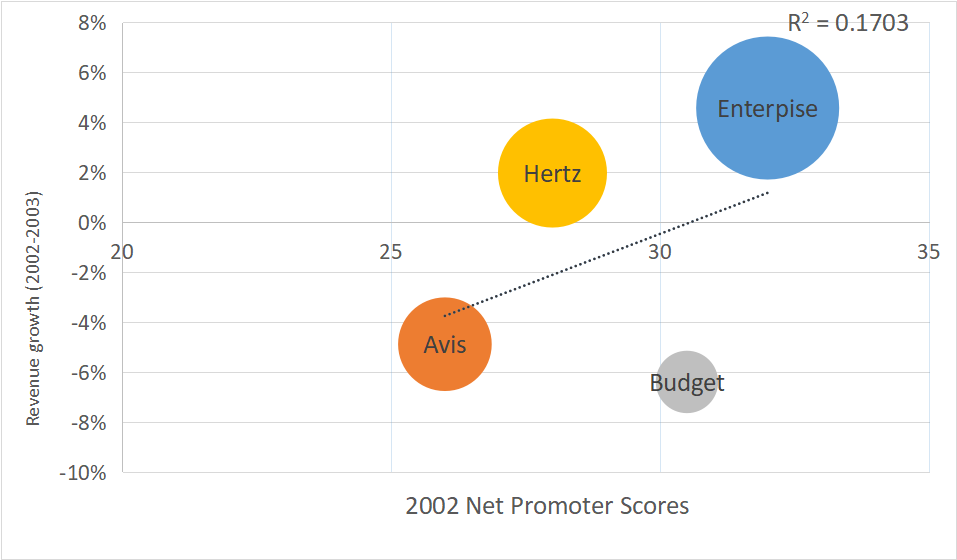 |
Note: In 2003 Vanguard Group purchased National and Alamo brands and didn’t separate the revenue so they are excluded in the future analysis.
Summary
A re-examination of the original NPS data using future (rather than historical revenue growth) found:
The NPS explains immediate firm growth in selected industries. On average we found NPS data can explain 38% of the variability in company growth metrics in seven industries at the company/firm level. This is less than half the explanatory power of historical growth reported by Reichheld (76%) but still represents a substantial amount relative to other behavioral science measures. While not as impressive, it still suggests the NPS is a leading indicator of future growth rates, at least in some selected industries for some time periods at the company level.
The NPS is still predictive of more distant growth. The explanatory power of the NPS still remained at a solid 30% for a four-year future growth period. This suggests that established company policies and growth patterns can remain in effect for years (but not always) and the NPS may still portend the more distant future (again in these selected industries and years).
Industry changes are hard to predict with few data points. Companies merge, industries morph, and unexpected changes can happen that affect a company’s growth and consequently the predictive ability of any measure, including the NPS. This was seen in the car rental industry (National merged) and the PC industry (IBM sold to Lenovo) and the airline industry (TWA was acquired after bankruptcy ). When an industry has few data points (e.g. ISPs with only three), only the strongest relationships are detectible and small changes in one year can completely remove any evidence for a relationship between NPS and growth.
Prediction is imprecise. The NPS may be a victim of its own success with its hype leading many to dismiss it unless it’s a perfect predictor of growth. (After all the headline indicated it’s the ONE number you need to grow!) Making predictions is difficult and imprecise but this analysis suggests the NPS does have reasonable predictive ability, at least as high as other high-stakes measures like college entrance exams. It’s unlikely always the superior measure in every industry, given our earlier analyses on satisfaction but this data again suggests it may be an adequate proxy measure of future growth for many industries.
There is a possible selection bias. We limited our analysis to the industries, companies, and metrics reported by Reichheld. It’s likely that these are the best illustrations of the NPS’s predictive (or post-dictive) ability and may not be representative of all industries. Reichheld himself reported that the NPS wasn’t always the best predictor of growth (only in 11/14 industries). A future analysis will look at a broader range of the seven industries shown here as well as examinations at the customer level.
Sources
Below are the sources where we found growth rates to match those reported in Reichheld so you can check our work and assumptions (let us know if you see a discrepancy).
US PC market (All Firms)
US Life insurance market
- Met Life
- New York Life Report 2004 <no link available>
- Northwestern
- Primerica Citigroup 2005 report
- Prudential
- State Farm State Farm Announces Financial Results For 2004 <no link available>
US Airlines
US Internet Service Providers
UK supermarkets
Korean auto insurance
US Car rental