 In an earlier article, we described a pilot study from 2015 in which we investigated how to measure tech savviness. Building on the published literature, we generated candidate items that measured three aspects of tech savviness: what people know, what people do, and what people feel.
In that pilot study, we assessed knowledge using a seven-item multiple choice quiz, we assessed skills by asking respondents to select which of 13 activities they are confident completing without assistance, and we assessed feelings with a single five-point tech-savvy item asking “rate how technically savvy you are.”
Tech savviness matters to UX researchers. It is a reasonable hypothesis that this individual difference affects how well people perform and the perceived quality of their experiences when using technical products.
The results of the 2015 pilot study indicated that quizzing was the least promising approach because they are hard to create and maintain over time due to rapid changes in technologies. Self-assessment showed some promise, but the study had only one item. The activity checklist was the most promising approach, with a relatively strong correlation between the number of selected items and the self-rating of tech savviness.
In 2016, we conducted a second study to continue those lines of research, building on the pilot study to refine the candidate measures of tech savviness. This article provides the details of that study.
Study Description
In January 2016, we recruited 160 participants from Amazon’s Mechanical Turk to answer a modified battery of tech-savvy questions. We had participants select activities, answer a short quiz, and rate attitudinal (self-assessment) items. Relative to the 2015 pilot study, we reduced the number of quiz and activity items and added more attitudinal items.
What People Know
After our 2015 pilot results, we reduced the number of items in the quiz to three items that had relatively high (VoIP: 85%), medium (HDTV: 71%), and low (1080p: 62%) correct selection percentages (Table 1).
| Item | % Correct |
|---|---|
| VoIP | 85% |
| HDTV | 71% |
| 1080p | 62% |
Table 1: Quiz items used in the 2015 pilot study (strikethrough indicates dropped items).
What People Do
We also reduced the number of items in the activity checklist, from 13 to 8, to remove redundant activities with similar selection percentages, as shown in Table 2.
| Activity | % Selecting |
|---|---|
| InstallPrinter | 91% |
| NewApp | 91% |
| Router | 79% |
| Virus | 73% |
| Excel | 60% |
| NetworkProbs | 56% |
| HTML | 42% |
| Java | 15% |
Table 2: Activities used in the 2015 pilot study (strikethrough indicates dropped activities).
What People Feel
The most significant change in this study was the addition of eight attitudinal items using a five-point agreement scale to the single self-assessment tech-savvy item. The items are shown in Table 3 with a short reference code.
| Reference | Item Stem | Left Endpoint | Right Endpoint |
|---|---|---|---|
| TechSavvy | How technically savvy are you? | 1: Not at all tech savvy | 5: Very tech savvy |
| AskMeHelp | People often ask me for help when troubleshooting technical problems. | 1: Strongly disagree | 5: Strongly agree |
| FirstTryTech | I’m usually the first of my friends and family to try a new type of technology. | 1: Strongly disagree | 5: Strongly agree |
| NotIntim | I’m never intimidated by technology. | 1: Strongly disagree | 5: Strongly agree |
| Confident | I feel very confident when learning new technology. | 1: Strongly disagree | 5: Strongly agree |
| SolveProbs | I’m able to solve most technical problems I encounter. | 1: Strongly disagree | 5: Strongly agree |
| NoTechSupport | I rarely need technical assistance. | 1: Strongly disagree | 5: Strongly agree |
| EnjoyLearning | I enjoy learning how to use new products and software. | 1: Strongly disagree | 5: Strongly agree |
| TechSavvy2 | I am tech-savvy. | 1: Strongly disagree | 5: Strongly agree |
Table 3: Attitudinal items (original plus eight new agreement items).
Study Results
Here are the results of the analyses of the quiz, activity checklist, and self-assessment ratings.
Quiz
Table 4 shows the results of the three-item quiz in the 2016 refinement study and the 2015 pilot study. The 2016 percentages were reasonably stable for VoIP and HDTV (within five percentage points) but not for 1080p (a 16-point difference). The range of quiz scores was restricted to just ten points, from 76% to 86%, and there was only a 2% difference between 1080p and HDTV.
| Item | 2016 Refine | 2015 Pilot | Diff |
|---|---|---|---|
| VoIP | 86% | 85% | 1% |
| 1080p | 78% | 62% | 16% |
| HDTV | 76% | 71% | 5% |
Table 4: Quiz results from 2016 and 2015, with their differences.
Activity Checklist
Table 5 shows the percentage of participants who selected the various activities. The 2016 percentages were remarkably stable compared to 2015, with all items falling within six percentage points of each other (most within three points) and an almost perfect linear correlation (r(6) = .995, p < .0001). The range of this scale was not restricted, from 13% for Java to 97% for NewApp. The smallest difference between activities in 2016 was 3% between NetworkProbs and Excel.
| Activity | 2016 Refine | 2015 Pilot | Diff |
|---|---|---|---|
| NewApp | 97% | 91% | 6% |
| InstallPrinter | 93% | 91% | 2% |
| Router | 83% | 79% | 4% |
| Virus | 76% | 73% | 3% |
| NetworkProbs | 62% | 56% | 6% |
| Excel | 59% | 60% | −1% |
| HTML | 38% | 42% | −7% |
| Java | 13% | 15% | −2% |
Table 5: Activity checklist results from 2016 and 2015, with their differences.
Self-Assessment Ratings
Table 6 shows the means and standard deviations for the nine rating scale items. The grouping of items shows strong internal consistency reliability with coefficient alpha = .924.
| Item | Mean | Standard Deviation |
|---|---|---|
| TechSavvy | 3.84 | 0.89 |
| AskMeHelp | 3.51 | 1.09 |
| FirstTryTech | 3.42 | 1.08 |
| NotIntim | 3.89 | 1.08 |
| Confident | 4.10 | 0.76 |
| SolveProbs | 3.89 | 0.94 |
| NoTechSupport | 3.76 | 0.96 |
| EnjoyLearning | 4.10 | 0.82 |
| TechSavvy2 | 3.88 | 0.94 |
Table 6: Means and standard deviations for tech-savviness self-assessment items.
Construct Validity
The TechSavvy and TechSavvy2 items had similar wording but different endpoint labels (see Table 3). For future research, it would be advantageous to use TechSavvy2 instead of TechSavvy because it can be placed in a grid with the other self-assessment items. The items were highly correlated (r(158) = .80, p < .0001) and their means differed by only .04 on a five-point scale (1% of the maximum scale range), so the following exploratory factor analysis (unweighted least squares) of these items uses TechSavvy2 instead of TechSavvy.
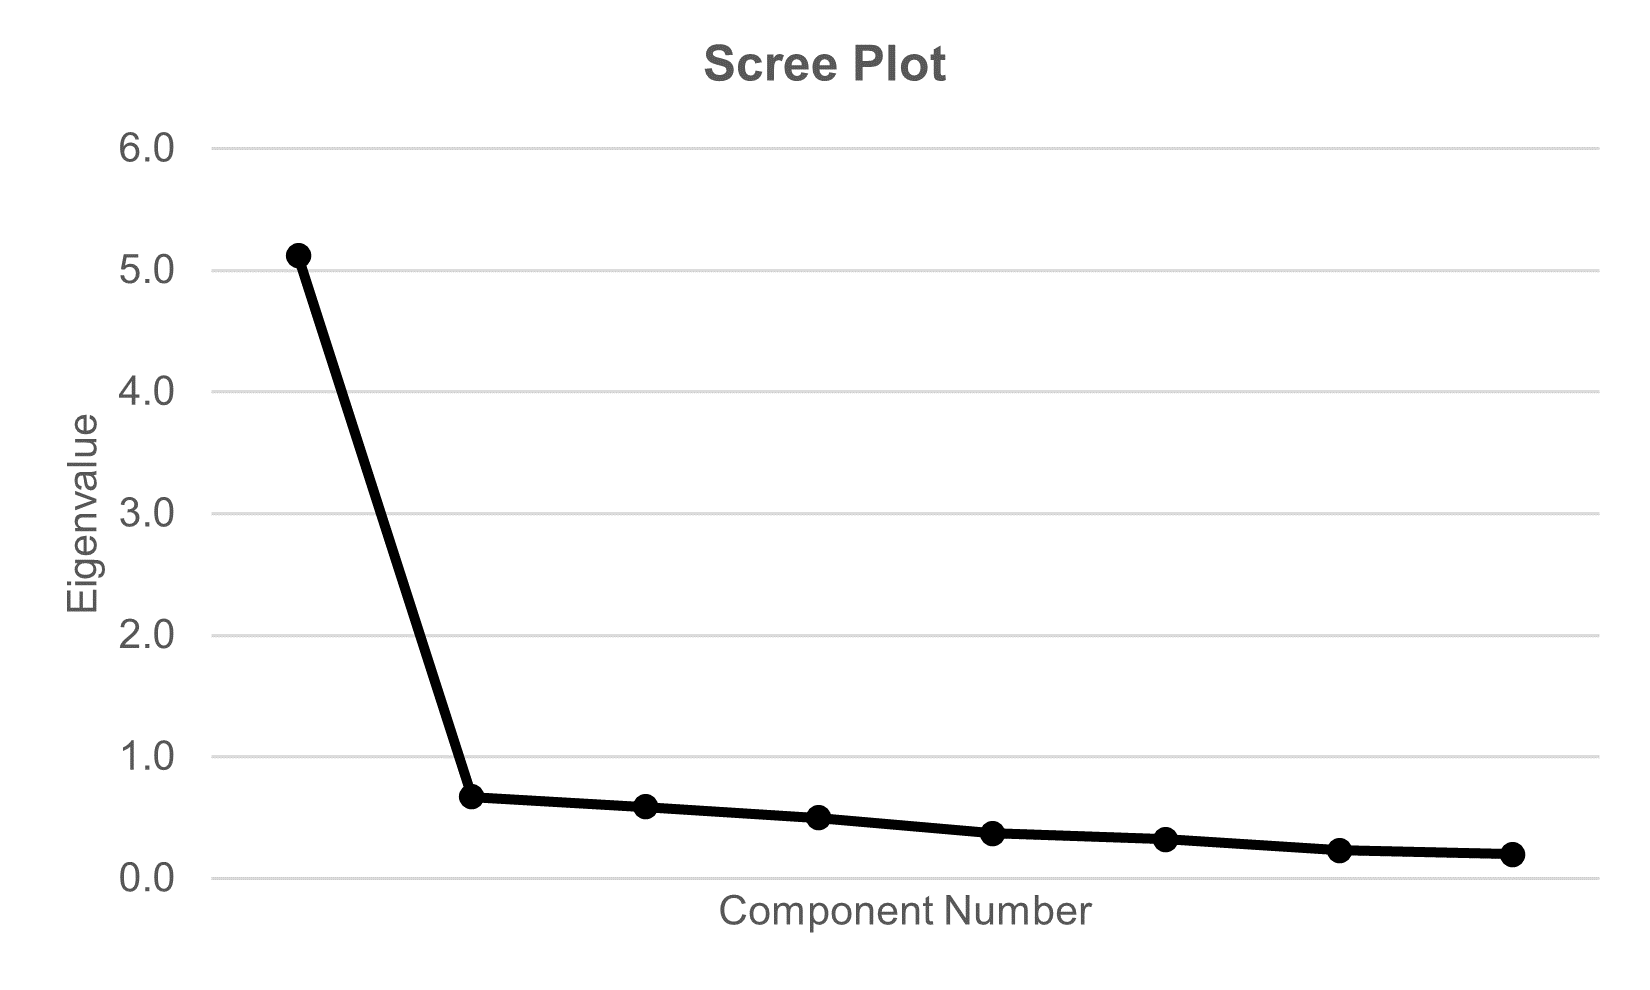
As shown in Figure 1, the scree plot (supported by a parallel analysis) strongly indicates a one-factor solution—in other words, all eight items are complementary measures of the same underlying factor.
Convergent Validity
To assess the convergent validity of the self-assessment items, we correlated the ratings with the activity and quiz scores. We created a score for the number of quiz items correct (out of 3), a score for the total number of activities reported (out of 8), and a total score for both (out of 11). The correlation between these three scores and the rating of each self-assessment item appears in Table 7.
In general, we found the correlation to be lowest for the quiz score, which we suspect is the result of range restriction (most respondents got two or three correct). When looking at the total score, one item had a lower correlation relative to the others (FirstTryTech r = .38). However, even this is above r = .30, which is considered a minimum threshold (Nunnally, 1978, p. 91), suggesting that all items have good convergent validity. The total score correlations, however, were never substantially higher than those for total activity (and were sometimes slightly lower), so there was no substantial advantage due to including the quiz score in the total score. Across these items, the mean correlation (using the Fisher Z-Transformation) for the activity scores was .46; for the quiz scores, it was .23.
| Item | Total Activity | Total Quiz | Total Score |
|---|---|---|---|
| AskMeHelp | 0.52 | 0.17 | 0.51 |
| FirstTryTech | 0.35 | 0.21 | 0.38 |
| NotIntim | 0.45 | 0.13 | 0.43 |
| Confident | 0.46 | 0.25 | 0.50 |
| SolveProbs | 0.44 | 0.25 | 0.48 |
| NoTechSupport | 0.49 | 0.32 | 0.54 |
| EnjoyLearning | 0.43 | 0.32 | 0.49 |
| TechSavvy2 | 0.48 | 0.22 | 0.50 |
Table 7: Correlations of self-assessment rating scale items with activity and quiz scores (all correlations have 158 df; correlations from .16 to .17 are statistically significant at p < .05; correlations greater than .20 are statistically significant at p < .01; only correlations greater than .30 are practically significant).
Rasch Analysis
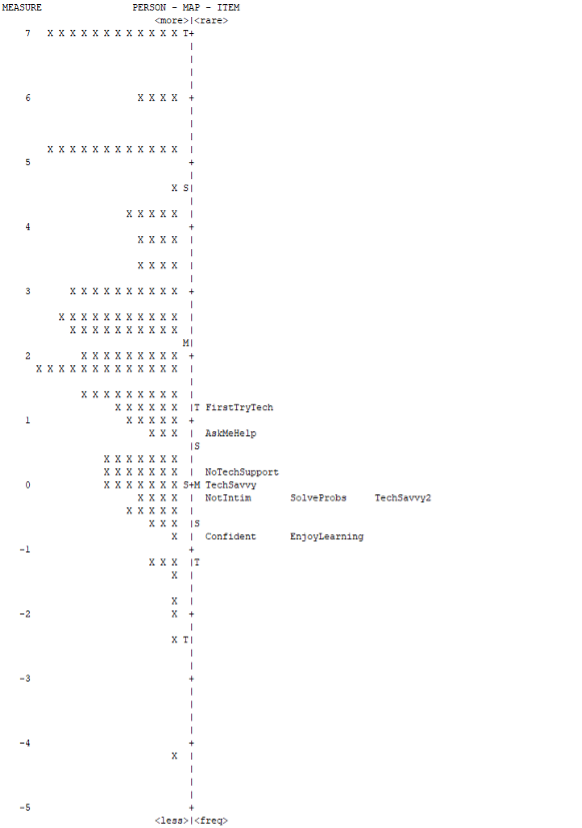
Because the scree plot and parallel analysis indicated that the self-assessment items aligned on one factor, we conducted Rasch analysis to produce a Wright map, which puts item difficulty and person scores computed from a set of data on a common logit (log odds) scale. The Wright map visualizes how extensively items cover a good range of attitudes without overlap or large gaps.
As shown in Figure 2, this set of tech-savvy self-assessment items has some issues. Ideally, items in a unidimensional measure of individual differences should be spread out. Each item should be different from the others regarding how easy it is to agree with, and there should be a large difference between the easiest and hardest items.
Instead, the item scores are bunched together, with relatively little distance between the items that are easiest to agree with (Confident, EnjoyLearning) and the most difficult item (FirstTryTech). As expected, TechSavvy and TechSavvy2 are very close on the map. Also close to these fundamental tech-savvy self-assessment items are NoTechSupport, NotIntim, and SolveProbs. It might be premature to use these findings to drop items from this scale, but the scale would benefit from items that are difficult to agree with.
Summary and Discussion
The results of this study (n = 160) conducted in 2016 to refine the tech-savvy measures first investigated in a 2015 pilot study found that
Quizzing continued to be the least promising approach. We’ve previously noted that quizzes are hard to create and maintain because you need good sets of distractors for each question, enough questions with varying difficulty to get a discriminating measure, and questions that ask about current technologies. Even with those difficulties, if the quiz results worked well to discriminate levels of tech savviness, it might be worth the effort—but that does not seem to be the case. We reduced the number of quiz items to the three that were the most discriminating in the pilot study, but in this refinement study, the range of quiz scores was more restricted than expected, with only 10 percentage points difference between the easiest and hardest quiz items, both of which were answered correctly by more than 75% of participants. Most likely due to range restriction, correlations between quiz scores and tech-savvy self-assessment items were consistently lower than correlations between activity scores and self-assessment items.
Self-assessment continued to show some promise, but there were some issues. We created a battery of new tech-savvy self-assessment agreement items for this study. Psychometric evaluation strongly indicated that these items are complementary measures of the same underlying factor (i.e., they are unidimensional) and have high reliability (coefficient alpha greater than .90). Each item also strongly correlated with concurrently collected activity scores (the number of activities selected from the technical activities checklist). However, using Rasch analysis to create a Wright map visualization revealed that several items have essentially the same discriminative ability, and overall, there wasn’t much distance between the items that were easiest and hardest to agree with. It would be premature of us to drop items from this scale using these findings, but the scale would benefit from adding more-difficult items.
The agreement version of the basic tech-savvy self-assessment item was virtually indistinguishable from the original version with item-specific endpoints. The TechSavvy and TechSavvy2 items had similar wording but different endpoint labels (endpoint specific for TechSavvy; agreement for TechSavvy2). Consistent with other research demonstrating little difference in the measurement properties of endpoint-specific and agreement formats, these items were highly correlated and had means that differed by only 1% of their scale range. Furthermore, there was little difference between their correlations with quiz and activity scores, and they were in almost the same place on the Wright map. These findings strongly suggest that the two versions of this item are interchangeable.
The activity checklist continued to show the most promise. Of these three approaches, the activity checklist produced a measure with the widest range, suggesting that the activity score would be the best at discriminating levels of tech savviness. People generally find these types of checklists easy to complete. The 2016 selection percentages were remarkably stable compared to 2015, with all items falling within six percentage points of each other (most within three points) and an almost perfect linear correlation. Furthermore, the mean of the correlations between the activity checklist score and the level of self-assessed tech savviness was relatively strong (r(158) = .46, p < .01), showing good convergent validity.
Documenting these items provides insight for other teams who may have considered using any or similar items. Even though this research describes work in progress rather than a validated method for assessing tech savviness, these findings might be helpful for UX researchers who are interested in measuring this important individual difference.
Limitations: Respondents in this study appeared to have relatively high levels of tech savviness, which limited our ability to assess how well the tech-savvy approach worked with respondents with limited tech savviness. Also, our validation of quizzes and checklists was limited to correlation with measures of self-assessed tech savviness rather than a performance score such as the percentage of successful task completion.
Future research: These findings guided the next round of research, which we will discuss in a future article. In particular, it is important to assess measures of tech savviness with how well people do when attempting actual technical activities.


