 Some participants in usability studies complete a task effortlessly, while others struggle with the same task. In retrospective UX surveys, some respondents report having an easy time using a website and strongly recommend it to others, but others report having a much poorer website experience.
Why? What explains the discrepancy between experiences, especially when the interface didn’t change?
One significant contributor is a participant’s prior experience—more experience generally results in better performance. But even people with comparable prior experience will vary in their task performance and, consequently, their user experience. Some of that is due to individual differences, which can be hard to explain. But some individual differences can be explained by tech savviness.
Unlike levels of experience (e.g., how long have you used the product, how frequently do you use the product), assessing tech savviness is less direct and, therefore, more difficult. Candidate methods for measuring tech savviness include assessment of:
- What someone knows (typically assessed with a quiz)
- What someone does or reports doing (typically assessed with a checklist)
- What someone feels (typically self-assessments captured with rating scales)
Documenting a multi-year research program focused on the development and assessment of tech-savviness metrics, we have published articles on a 2015 pilot study, a 2016 refinement study, and a 2018 initial validation study.
Based on those studies, we’ve concluded that the quiz approach is the least promising method due to the difficulty of constructing items that (1) discriminate low and high levels of tech savviness, (2) have a clear correct answer with appropriate distractors, and (3) remain valid over time in the face of rapid technological change.
The other two approaches—a technical activity checklist and a tech-savvy questionnaire made up of self-assessment items—are more promising, with scores that significantly correlate with each other and, in our initial validation study, significantly correlated with successful task completion rates and ease ratings.
But of these two, the most promising approach is the Technical Activity Checklist (TAC™) because (1) well-constructed checklists can discriminate a low and high level of tech savviness, (2) checklists are easy to design and maintain because they are simple lists of technical activities, and (3) checklists in a select-all-that-apply format are easy for people to complete.
One of the best ways to pick the best measure is to assess its validity. There are several ways to assess validity, but one of the most compelling is predictive validity—how well does a measure “explain” a subsequent behavior?
In this article, we report the results of four studies in which participants who completed a technical activity checklist attempted a variety of technical tasks. This allowed us to further explore the validity of the checklist approach by seeing how well it predicted task completion rates.
Technical Activity Checklists
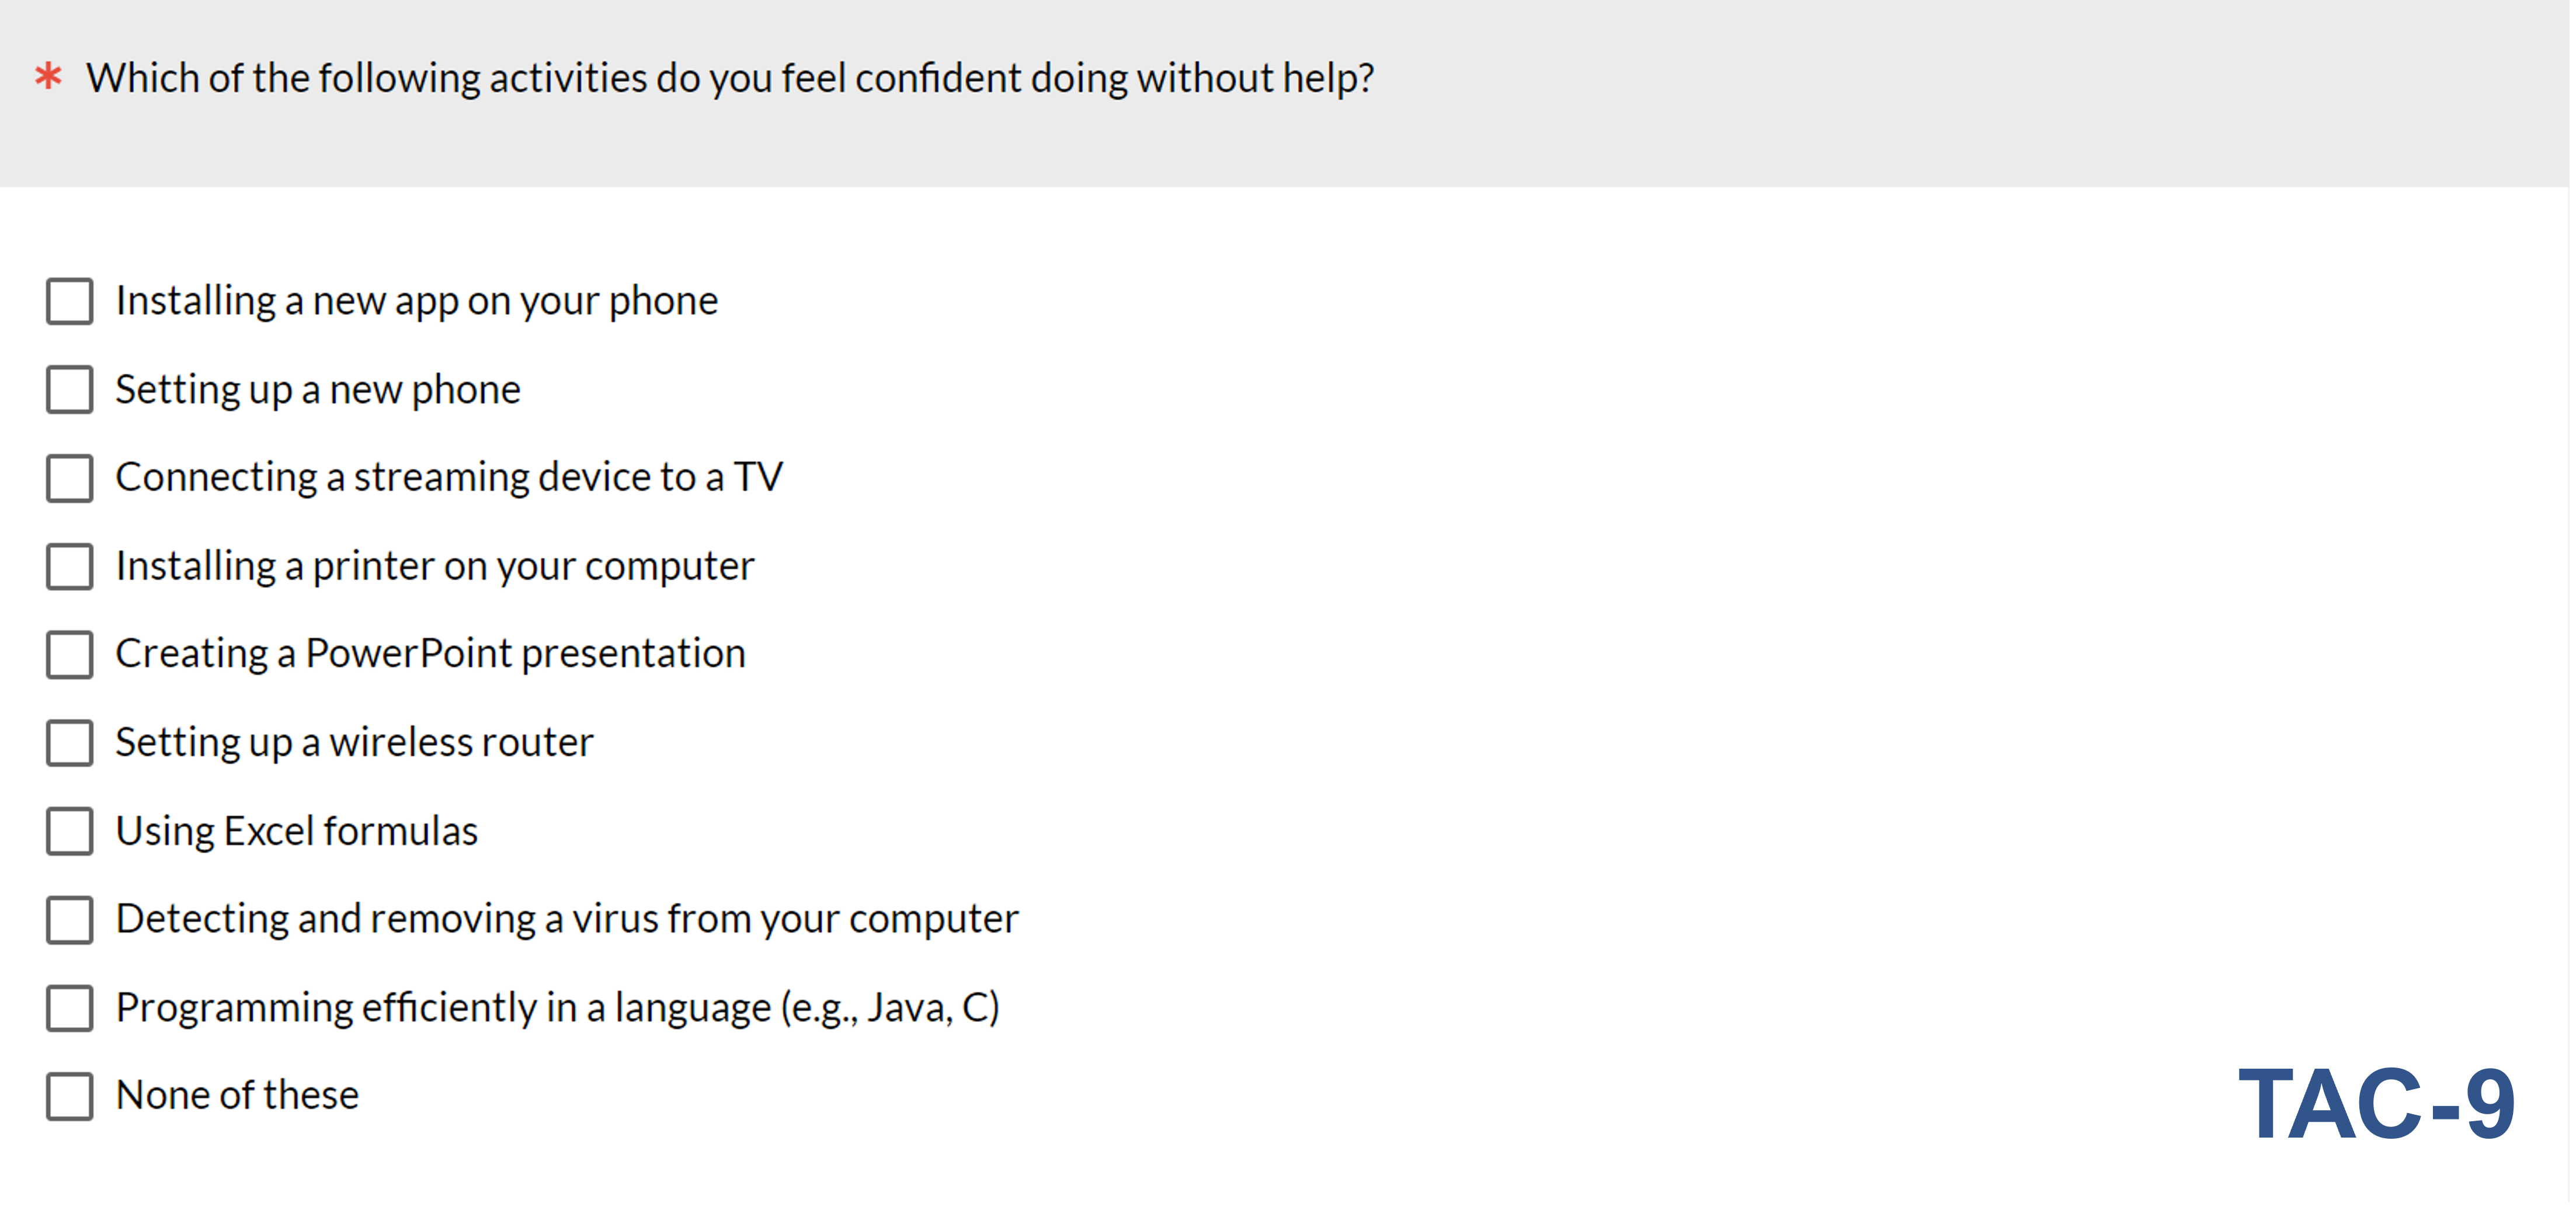
Figure 1 shows the TAC-9, the primary technical activity checklist analyzed from the data in the four studies. The checklist has nine activities (listed from the least to most technically difficult based on selection rates from our previous studies), plus a “None of these” option. In practice, we randomize the presentation order of the activities (except for “None of these,” which is always last and cancels all other selections when selected).
The checklist in two studies included a tenth item positioned between the virus and programming activities to fill a measurement gap we identified with Rasch analysis. The TAC-10 is shown in Figure 2.
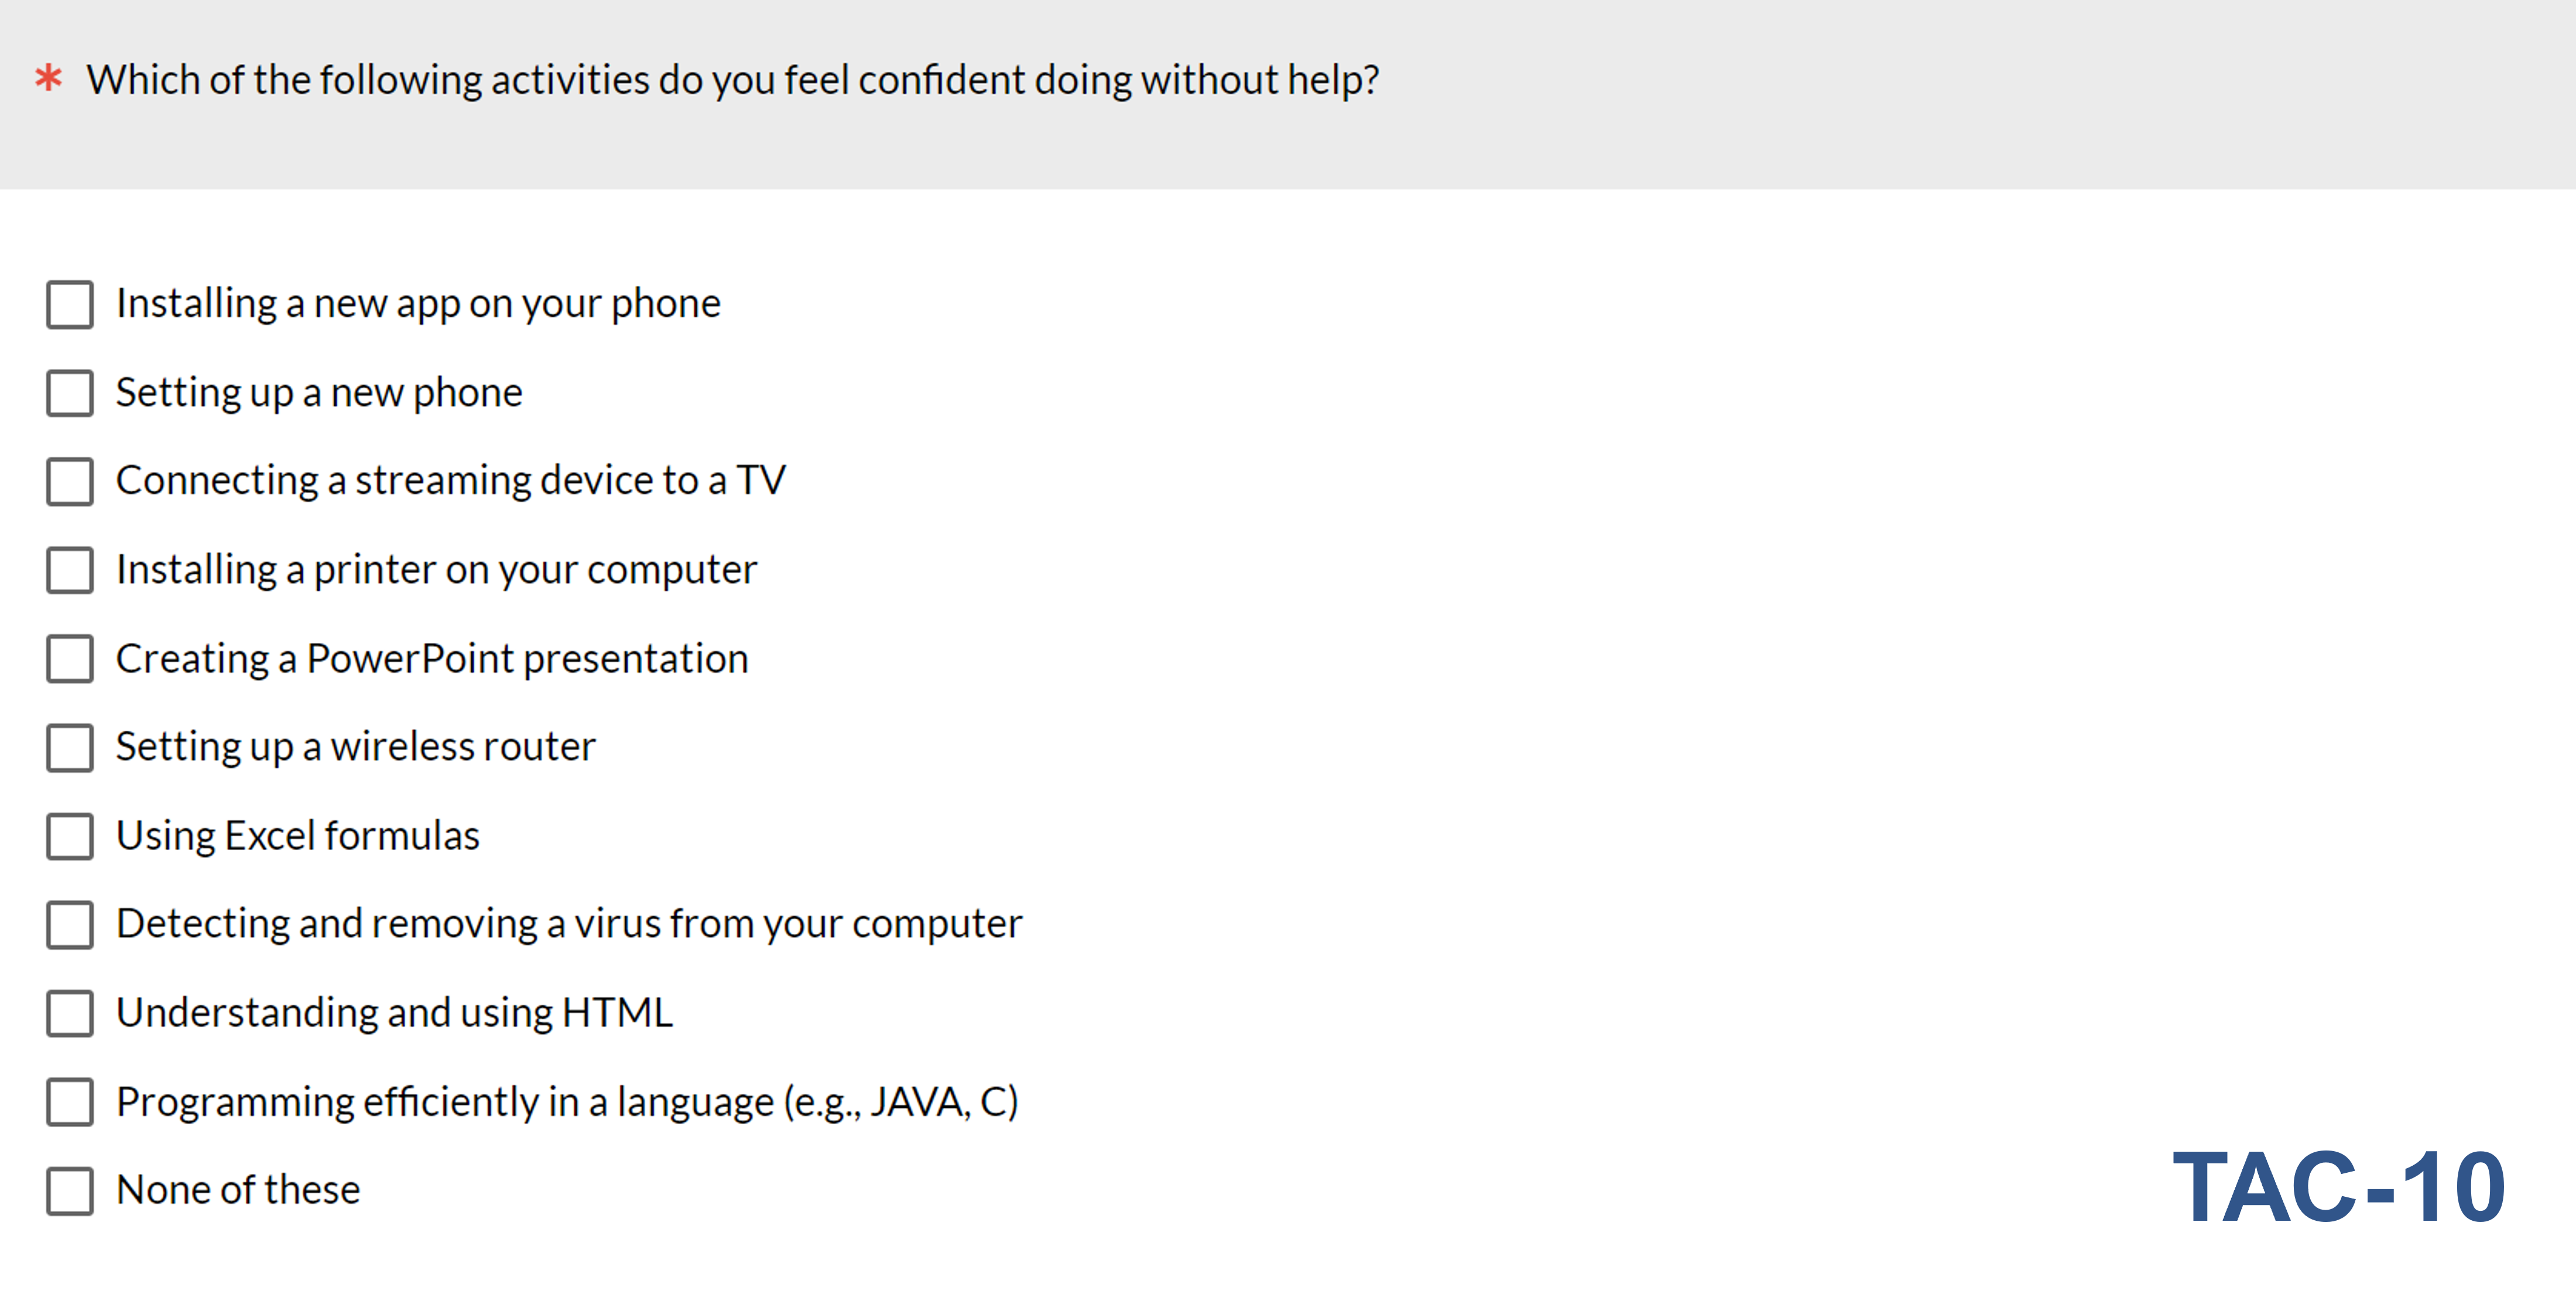
For both versions, the checklist score is the number of selections from the activity checklist, which can range from 0 to 9 for the TAC-9 and 0 to 10 for the TAC-10. Lower scores indicate lower levels of tech savviness.
Validating the TAC-9 and TAC-10
From 2018 through 2022, we conducted four studies in which participants completed a technical activity checklist and attempted a variety of technical tasks, allowing us to assess the extent to which checklist scores were predictive of successful task completion and to explore different candidate methods for using checklist scores for classifying different levels of tech savviness.
The checklists in all four studies included the activities in the TAC-9, and the checklists in the first two studies also included the HTML activity, enabling assessment of the TAC-10.
Study 1: Four Very Difficult Tasks (2018)
In our first study, we recruited 122 Mechanical Turk participants to attempt four very difficult technical tasks (named Ruby, Processor, Findability, and Google Sheets) in a remote unmoderated usability study. The tasks were:
- Ruby: Participants completed an online tutorial about the Ruby programming language. Successful task validation was based on answers to two questions, one about the validation message on the last lesson, and one that required participants to select the lines of code needed to do a specified function (success scored as 1 when both answers were correct, .5 when one answer was correct, and 0 when neither answer was correct).
- Processor: The participants’ task was to locate and upload a screenshot of their system’s processing speed (success scored as 1 for success and 0 for failure).
- Findability: Participants were asked to navigate to a difficult-to-find page on a website without using search (success scored as 1 for success and 0 for failure).
- Google Sheets: Participants attempted a series of filtering, formatting, and functional tasks with a large dataset in Google Sheets, pasting their answers into a question in the MUiQ survey for validation (success scored as 1 for success and 0 for failure).
We received usable task completion data from 72 participants. The respective successful task completion rates are shown in Table 1 (average task completion rate of 35% across the tasks, ranging at the individual respondent level from 0 to 100%).
| Task | Success |
|---|---|
| Sheets | 15% |
| Ruby | 28% |
| Proc | 46% |
| Find | 52% |
| Overall | 35% |
The TAC-9 and TAC-10 scores both correlated significantly (p < .0001) with overall task success (TAC-9: r(76) = .65; TAC-10: r(76) = .63).
Study 2: Setting Up a Printer (2021)
In our second validation study, we moved from an online unmoderated study to an in-person moderated study. We observed 38 participants attempting to set up a printer (the only task) in our Denver lab. Participants had 90 minutes to unbox and set up the printer and connect it to a network, with 26 participants (68%) completing the task.
The correlation of TAC-9 and TAC-10 scores with successful task completions were both significant (r(36) = .37, p = .01).
Study 3: Using a Video Streaming Service (2021)
In our third study, 52 people participated in an in-person moderated usability study in which they attempted six tasks with a video streaming service. The mean overall successful task completion rate was 85%, ranging from 50% to 100%.
There was a significant correlation (p = .04) between TAC-9 scores and overall successful task completion (r(50) = .29).
Study 4: Social Media Content Creation and Consumption (2022)
In a remote unmoderated usability study of a platform for social media creation and consumption, 1,358 participants were assigned to one of four sets of tasks:
- Set 1: seven tasks with n = 221 and mean success rate of 44%
- Set 2: five tasks with n = 239 and mean success rate of 61%
- Set 3: two tasks with n = 446 and mean success rate of 36%
- Set 4: five tasks with n = 452 and mean success rate of 48%
The overall mean across the four groups was 47%. Table 2 shows the correlations between the TAC-9 score and mean successful task completion rates for each set of tasks and all sets combined (Overall).
| Success | r | p | n |
|---|---|---|---|
| Set 1 | 0.21 | 0.002 | 221 |
| Set 2 | 0.11 | 0.08 | 239 |
| Set 3 | 0.01 | 0.80 | 446 |
| Set 4 | 0.17 | 0.0001 | 452 |
| Overall | 0.09 | 0.001 | 1358 |
All correlations between TAC-9 and task success were relatively small in magnitude but statistically significant (p < .10), except for Set 3. The average of Set 1 through Set 4 correlations using the Fisher z transformation was .11.
Discussion and Summary
In this article, we’ve described the predictive validation of technical activity checklist scores (TAC-9 and TAC-10) with successful task completion rates across four studies.
TAC-9 and TAC-10 scores correlated significantly with successful task completion rates. All but one correlation between TAC scores and successful completions were statistically significant (p < .10, sometimes p < .0001). The magnitudes of the significant correlations ranged from .11 (small) to .65 (large).
Technical checklists have predictive validity. On average, tech savviness explained 22% of the variation in task completion rates. TAC scores predicted outcomes the best (highest correlations) when the tasks were very difficult (done intentionally in Study 1). This is strong evidence that technical activity checklists, specifically the two we’ve examined (the TAC-9 and TAC-10), provide significant predictive validity and show promise as good measures of tech savviness.
We plan to address study limitations with future research. Because, to date, we have conducted only two validation studies that included technical activity checklists with all ten TAC-10 activities, we plan to use the TAC-10 in future usability studies to further investigate its validity.


