Surveys often suffer from having too many questions.
Many items are redundant or don’t measure what they intend to measure.
Even worse, survey items are often the result of “design by committee” with more items getting added over time to address someone’s concerns.
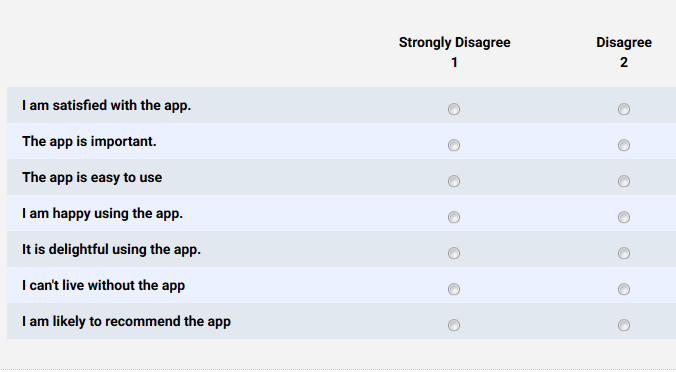
Let’s say an organization uses the following items in a customer survey:
- Satisfaction
- Importance
- Usefulness
- Ease of use
- Happiness
- Delight
- Net Promoter (Likelihood to recommend)
Are all those necessary? If you had to reduce them, which do you pick?
Instead of including or excluding items arbitrarily (first in, first out) or based on the most vocal stakeholder, you can take a more scientific approach to determine which variables to keep.
Clients often pose this question to us when examining their data. As is common with quantitative analysis, you can take multiple approaches and in this case they’re all based on correlations. Here are seven techniques we use to identify which items to remove or keep, progressing in sophistication (and needed skill and software).
-
- Correlation Between Items
Start with a simple correlation table between the items. Look to identify items that don’t tend to correlate highly with other items. The figure below is a correlation matrix between nine items in a questionnaire (labeled A to I). Item D tends to correlate lower with the other items and using this approach is a good candidate for removal. Although it’s not so low (typically r < .3) that you automatically mark it for removal as this higher correlation suggests it’s still doing a sufficient job.
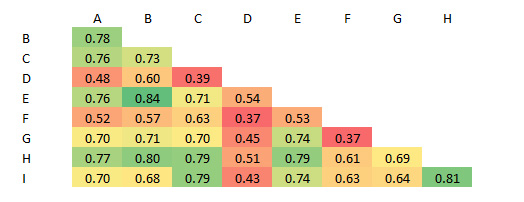
Keep in mind that items that correlate low with each other may just mean they measure a different construct (for example, usefulness versus ease). You may want different measures in your questionnaire—which you have to balance with length. But if all 9 of these items are intended to measure the same thing, higher correlations are what you want.
-
- Correlation with Other Variables
The simple correlation coefficient can also be used to assess how well each item predicts what it intends to measure (validity). You can use two ways:
Predictive Validity: Correlate each item with an outcome, such as revenue, number of sales, number of app downloads, or cart abandonment, that the item should predict. The higher the correlation, the more evidence to keep it.
Convergent Validity: Correlate the items with another measure, such as the System Usability Scale (SUS), NPS (if you aren’t using it), or customer satisfaction.
While the calculations and concept of using the correlation is simple, actually being able to correlate your attitudinal measures to business outcomes—sales, orders, or revenue—is the real challenge. For that reason, other methods of examining the data are done that don’t require an external dataset or measure.
-
- Item Total Correlation
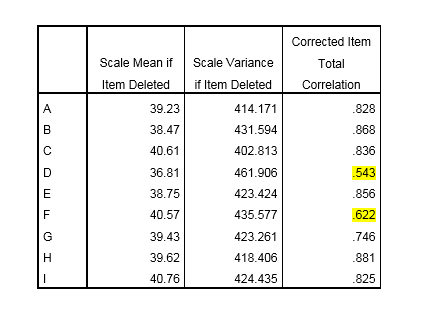
The next option would be to examine what’s called the item total correlation. It’s done by creating a total score (sum of all the 9 items) and then correlating each item’s score with the total (at the participant level). The table below shows the item total correlation in the column “Corrected Item Total Correlation” from SPSS. It shows that again item D has the lowest correlation (.54) and then item F the second lowest correlation (.62), but again all items are showing relatively high item total correlations (r >.5).
-
- Internal Reliability (Cronbach Alpha)
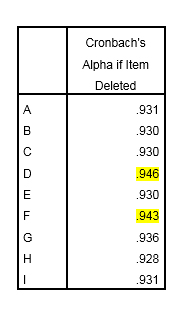
Cronbach alpha (often called coefficient alpha) is a measure of internal consistency reliability. It measures how consistent respondents are when they respond to the items. The highest score is 1, meaning perfect consistency/reliability. Scores above .7 are desirable and scores above .9 show strong reliability. Software like SPSS can identify which items reduce the reliability of your scale and become another method for removal. It’s also included in our SUPR-Q and SUS calculators. The table below shows that again the removal of items D and F would actually improve the reliability of the scale (albeit modestly). They would improve the internal consistency reliability to .946 or .943 respectively.
-
- Factor Analysis
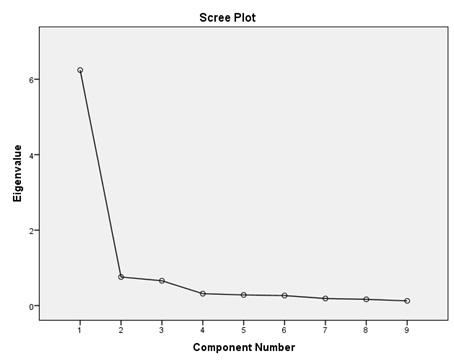
To see whether items measure different constructs you can use factor analysis. There’s good evidence these nine items actually measure the same construct (the figure below is a scree plot that illustrates this).
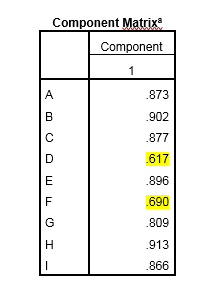
Examining the component matrix (below) reveals again that items D and F tend to “load” lowest on this construct (which isn’t surprising because they’re based on the correlations).
-
- Multiple Regression Analysis
If you had a main outcome variable (likelihood to recommend) or overall Customer Satisfaction, you could identify the items that have the most explanatory value (using significant beta coefficients). This is an extension of using the correlation for predictive or criterion validity but using multiple variables at a time.
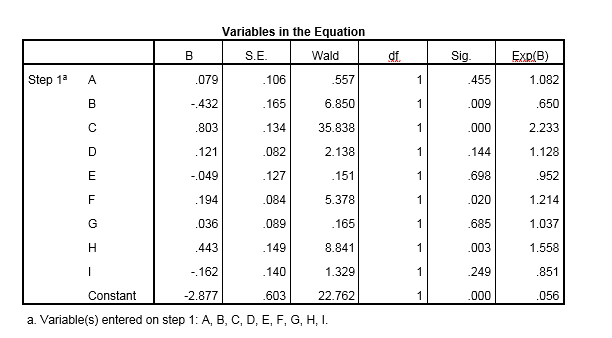
The example below is output from a binary logistic regression analysis. The dependent variable is whether participants reported that they will continue using the mobile app (yes or no) from the same survey (a measure of convergent validity). The initial results show that items A, D, E, G and I aren’t significant predictors of app retention (values in the Sig column are > .05). This puts the nail in the coffin for item D (p=.144), but also suggests more investigation and analysis is needed on selecting other items for removal.
-
- Item Response Theory/Rasch Analysis
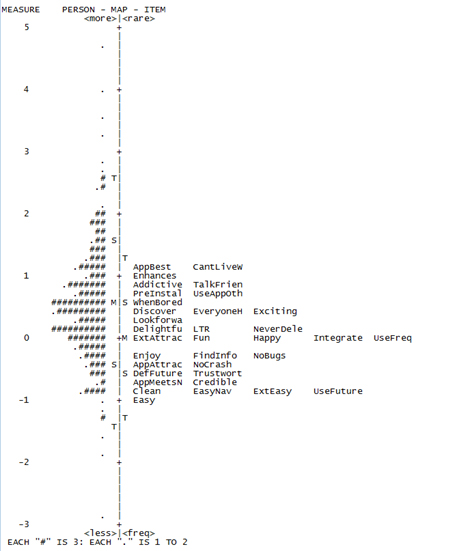
A lesser known technique called Item Response Theory (IRT) and one variation called a Rasch analysis uses a logit transformation on the raw scores to better examine the items. The figure below is an item-person map that came from our analysis of a questionnaire to measure the mobile app user experience (to be published in The Journal of Usability Studies). The items are labeled (e.g. AppBest, CantLivew, Enhances etc.), which are abbreviations for 34 possible items in the questionnaire. The hash marks on the left show how each of the 334 participants responded to the items. Items higher on the map indicated it was harder for participants to agree to them (e.g. AppBest); lower ones were easy to agree to (e.g. Easy and Clean). This map shows that several items measure at about the same level (e.g. Happy, Fun, UseFreq) in the middle of the range and are candidates for removal. We’re continuing to use IRT as a powerful technique to build better questionnaires as part of our client analyses at MU.
Summary
If you need to reduce (or change) the items in a questionnaire, use a scientific approach rather than relying on intuition or the most vocal stakeholder.
-
- Plan to use multiple techniques to prioritize items.
- Most techniques are based on a correlation (between items, to something external, or to a total score).
- Many techniques will lead to similar conclusions, including the simpler ones that rely on correlating the items together or to an item total score.
- More sophisticated techniques such as Rasch analysis, factor analysis, and multiple regression analysis may allow you to better understand different dimensions in your data but require more sophisticated skills and software (feel free to contact us).
