 When working with UX metrics (e.g., rating scale data) you need to consider both the average and the variability of the responses.
People have different experiences with interfaces, and sometimes they interpret items in rating scales differently. This variability is typically measured with the standard deviation. The standard deviation is a key ingredient in computing sample sizes.
Interpreting variability by itself can be tricky and even less intuitive than interpreting an average completion rate or average task time without reference to any other information.
To guide UX researchers on what a typical standard deviation looks like for UX rating scales, we aggregated data across 25 surveys and benchmark studies conducted between 2017 and 2022. We had standard deviation data from over 10,000 individual respondents spread across more than ten rating scales, providing over 100,000 standard deviation data points to analyze.
Description of Studies
We pulled our data from several different sources, including from our SUPR-Q benchmark reports, which contained the standardized SUPR-Q and UX-Lite items (eight five-point items), the eleven-point likelihood-to-recommend (LTR) item used to compute the Net Promoter Score (NPS), and numerous other newly developed five-point items. Several of the items in the dataset were repeated but independently administered to different respondents for different website experiences. For example, a five-point item asking, “It’s easy to make changes to my order,” was used in our SUPR-Q grocery retrospective benchmark, administered to 390 people for one of eight different grocery store websites (with approximately 45 respondents per online grocery store).
We also pulled from our business and consumer software SUS datasets, which contained the ten five-point items used in the SUS and two five-point UX-Lite items. Finally, we used several data points from published studies that included sixteen seven-point CSUQ and four seven-point UMUX items.
Item Polarity and Tone
All the five- and eleven-point items in our dataset had high values indicating agreement and low values indicating disagreement, as did most of the seven-point items (not the CSUQ items, which have the opposite polarity). All eleven-point items were positively worded, whereas the five- and seven-point items mix positive and negative tones (e.g., from the SUS and UMUX).
The resulting mix of novel and well-tested items with different formats represents what we believe is a typical selection of items used in UX or CX surveys. In total, we analyzed 4,048 items: 3,290 five-point items, 465 seven-point items, and 293 eleven-point items.
Results
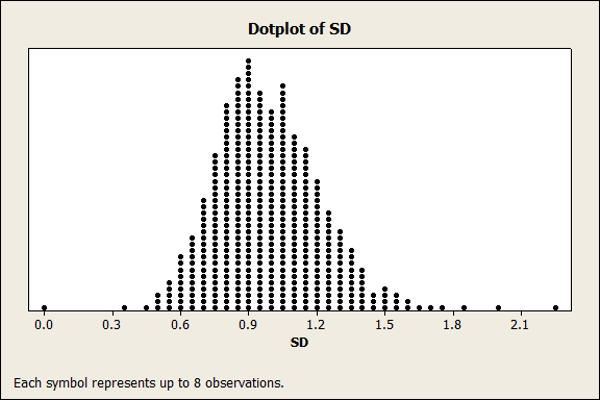
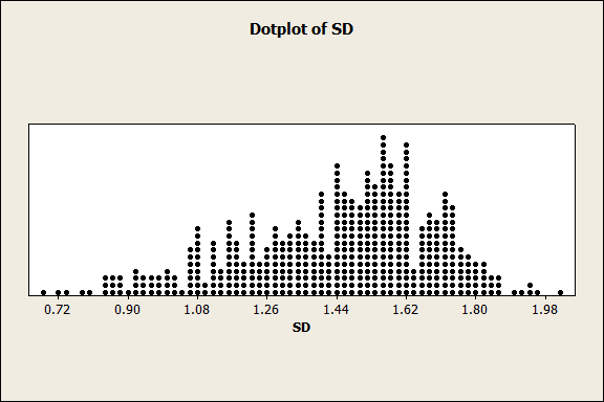
The distributions of standard deviations are shown as dot plots in Figure 1 for the five-, seven-, and eleven-point items. The distribution for five- and eleven-point items was more symmetrical, whereas our sample of seven-point standard deviations had a negative skew. We suspect this skew comes from the inclusion of the large number of CSUQ items, in which lower scores indicate higher agreement.
A. Five-Point Items
B. Seven-Point Items
C. Eleven-Point Items
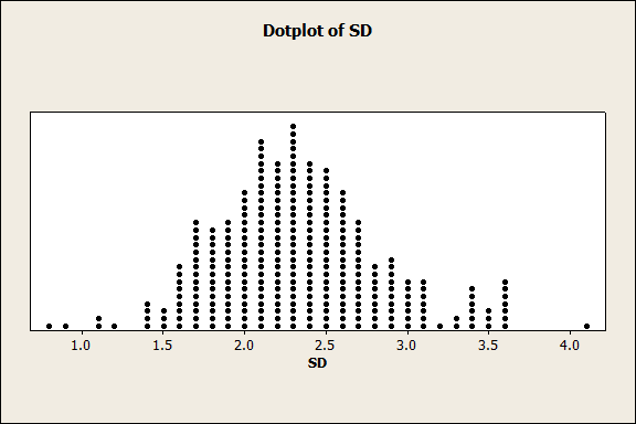
Figure 1: Distributions of standard deviations for five-, seven-, and eleven-point items.
To analyze the distributions of standard deviations, we converted the standard deviations into variances, computed the mean variance (with confidence intervals), medians, 25th and 75th percentiles, and minimum and maximum values, then we computed the square roots of the variances to get the standard deviations shown in Table 1.
| Points | SD Mean | 95% SD Low | 95% SD High | Min | Median | 25th | 75th | Max | |
|---|---|---|---|---|---|---|---|---|---|
| 5 | 1.01 | 1.006 | 1.022 | 0.00 | 0.960 | 0.824 | 1.125 | 2.24 | 3290 |
| 7 | 1.46 | 1.438 | 1.482 | 0.68 | 1.479 | 1.274 | 1.614 | 2.02 | 465 |
| 11 | 2.39 | 2.326 | 2.450 | 0.82 | 2.295 | 2.007 | 2.634 | 4.07 | 293 |
Table 1: Mean standard deviations (with 95% confidence intervals) along with min, median, max, 25th, and 75th percentiles of standard deviations based on historical survey data by number of scale points.
The five-point scales (including items used in the SUS and SUPR-Q) had an average standard deviation of just about 1 (1.01, with a 95% confidence interval from 1.006 to 1.022).
The largest standard deviation we observed for five-point scales was 2.24. Interestingly, this was larger than the maximum standard deviation observed for seven-point scales. A closer examination revealed that the higher standard deviations came from a group of negatively worded items used to assess design clutter (a scale still in the early stages of development). The standard deviations of negatively worded SUS items, however, were comparable to the positively worded ones (ranging between 0.9 and 1.1), so negative wording alone doesn’t explain the higher standard deviations for the clutter items.
The average standard deviation for seven-point scales was 1.46 (with a 95% confidence interval from 1.438 to 1.482). For the eleven-point scales, the average standard deviation was 2.39 (with a 95% confidence interval from 2.326 to 2.450).
The means and medians were similar despite some skew in the distributions. The 25th percentile (e.g., 0.824 for five-point scales) can be used as a good value for a less variable standard deviation, and the 75th percentile (e.g., 1.125 for five-point scales) can be used as a higher-than-average variability. Looking across the three scales, an interesting pattern emerges when we divide the mean standard deviations by the maximum possible range of the rating scales.
For example, a five-point scale has a range of four (5–1), a seven-point scale has a range of six (7–1), and an eleven-point scale has a range of ten (10–0). Table 2 shows the ratio of mean standard deviations to the range, plus ratios for the 25th and 75th percentiles.
It reveals that a reasonable estimate of a typical standard deviation is around 25% of the maximum range (a bit lower for items with more points). The 25th percentile is around 21% of the maximum range, and a reasonable estimate for the 75th percentile is around 28% of the maximum range (a bit lower for items with more points).
| Points | Mean | ||
|---|---|---|---|
| 5 | 25.3% | ||
| 7 | 24.3% | ||
| 11 | 23.9% |
Table 2: Percentages of scale ranges for mean, 25th percentile, and 75th percentile standard deviations.
Relationship Between Mean and Standard Deviation
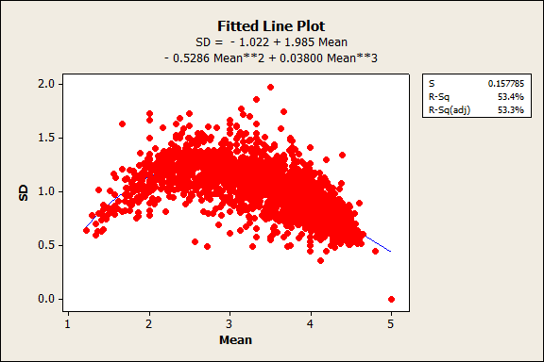
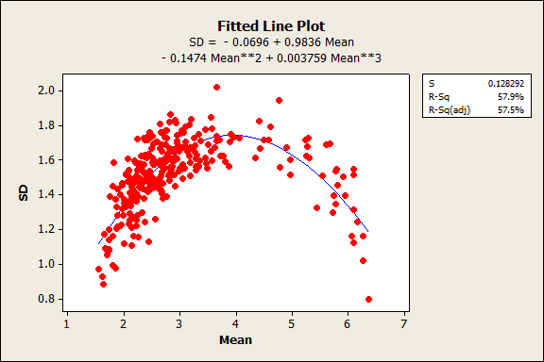
One of the properties of rating scales is that the mean and standard deviation are correlated. For example, as the mean of a five-point item increases toward 5 (or decreases toward 1), the variability goes down. It may sound counterintuitive, but to get an average of 5 or 1 on a five-point scale, all responses must be the same—no variability. Figure 2 shows the relationships and quadratic best-fitting equations for the means and standard deviations of the five-, seven-, and eleven-point items from a subset of items in the dataset.
A. Five-Point Items
B. Seven-Point Items
C. Eleven-Point Items
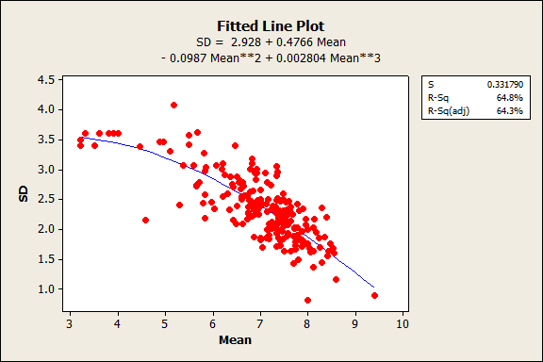
Figure 2: Relationship of means and standard deviations for five-, seven-, and eleven-point items.
There was a mix of low and high means for the seven-point scales as we see in the inverted-U pattern of Figure 2 panel B. This shows a concentration of responses between 1 and 4 (where lower scores indicate more favorable responses, mostly from the CSUQ items) and again between 4 and 7 (where higher scores indicate more favorable responses, mostly from the SEQ items). Most of the five-point items were positively toned, so the inverted U is less noticeable though still present. We had no examples in our dataset of eleven-point items where lower scores indicated more favorable responses, so the relationship looks more linear (standard deviations going down with higher scores). We suspect we’d see a similar inverted-U pattern if we had access to negatively worded eleven-point items (although these are rarely used).
Summary and Discussion
Our analysis of 4,048 five-, seven-, and eleven-point items collected in our UX research found that
The mean standard deviation of these items is about 25% of the maximum scale range. It was just over 25% for five-point items and a bit closer to 24% for seven- and eleven-point items. Based on these findings, a reasonable guideline for UX research when planning studies with new items is that the standard deviation will be close to a quarter of the range of the item’s scale. This is especially useful for sample size estimation.
About half of the standard deviations were between 20% and 28% of the maximum scale range. The 25th percentile for standard deviations of eleven-point items was 20%, while the 75th percentile for standard deviations of five-point items was 28%. Thus, the upper bound of the interquartile range was only three percentile points higher than 25%. Researchers who need to be more conservative in planning studies can use the slightly higher estimate for expected standard deviations; those who can tolerate the risk of an underpowered study could use the lower estimate.
Use lower estimates for standard deviations when expected means are near the scale endpoints. Because standard deviations approach 0 as the means of rating scales approach their endpoints, researchers who have good reason to believe that means of key rating scales in their studies will be close to the scale endpoints should use the 25th percentile estimates of the standard deviation for planning (or, if very close to an endpoint, an even smaller estimate).
Extreme variability can happen. We did see situations where some rating scales had unusually large standard deviations. For example, the highest standard deviation we observed was 56% of the maximum possible range (2.24 on a five-point scale divided by its maximum range of 4). However, this was rare as only eight values (less than 1% of the data) had standard deviations above 35% of the maximum range (explaining why the confidence intervals and interquartile ranges were narrow).
High variability can be diagnostic. High variability in an item can be an indication of confusion (or errors in responses). The historical standard deviations from this large dataset can be used to assess new items’ standard deviations. For example, a five-point item with a standard deviation of 1.75 (44% of the maximum range) would be high enough to warrant investigation.
Negative tone may add to variability, but this effect is not consistent. The rating scales with the highest standard deviations came from a scale of design clutter (still in development) that uses only negative-tone items. This suggests respondents may not be properly responding to these items. Interestingly, however, we did not see the same systematic increase in variability with the negative-tone SUS items. Whatever is happening here cannot be solely due to item tone.
Limitations: While our sample of items was large (4,048), we looked at only 25 surveys, and several of the items were answered by the same respondents (e.g., SUS and SUPR-Q items). A larger and more diverse dataset may provide higher confidence in the observed range of standard deviations, but we would expect only a minor deviation from our current findings.
Main takeaway: When you have historical data about the standard deviations and means of your rating scales, use them. When you don’t, you can often approximate the standard deviation by dividing the maximum range of the scale by 4 (we’ll discuss this rule in more detail in a future article).