 One of the primary goals of measuring the user experience is to see whether design efforts actually make a quantifiable difference over time. A regular benchmark study is a great way to institutionalize the idea of quantifiable differences. Benchmarks are most effective when done at regular intervals (e.g., quarterly or yearly) or after significant design or feature changes.
A UX benchmark is something akin to getting a checkup at the doctor. You get your blood pressure, weight, height, cholesterol, and other health measures checked. These metrics help describe quantitatively how healthy you are. They can be compared to existing criteria (e.g., to determine if your blood pressure or cholesterol is relatively high) and tracked over time. If there’s a problem, you create a plan to improve your health. And the same idea applies to UX benchmarks (Sauro, 2018, p. 2).
Benchmark studies require larger sample sizes than traditional find-and-fix formative usability studies. The larger sample sizes are needed to ensure more precise estimates of population parameters around key task metrics (e.g., completion rates and time) and study metrics (e.g., SUPR-Q and SUS). And when making comparisons to earlier benchmarks or competitors, sample sizes need to be large enough to separate the signal of real improvements in the experience from the inevitable noise of sampling error.
Finding the right sample size for benchmark studies involves balancing both statistical and logistical considerations.
Statistical Considerations
The statistical considerations for finding sample sizes are quite straightforward after you work out the math (which we’ve done for you). We have tables in the Benchmarking book that show you how to achieve a certain level of precision in a standalone study (Table 1) and how to detect an expected size of difference (Table 2).
| Margin of Error (90% Confidence) | Sample Size |
|---|---|
| 24% | 10 |
| 20% | 15 |
| 17% | 21 |
| 15% | 28 |
| 14% | 32 |
| 13% | 38 |
| 12% | 45 |
| 11% | 54 |
| 10% | 65 |
| 9% | 81 |
| 8% | 103 |
| 7% | 136 |
| 6% | 186 |
| 5% | 268 |
| 4% | 421 |
| 3% | 749 |
Table 1: Sample sizes for standalone benchmark studies for 90% level confidence (using a binary completion rate at 50%). Adapted from Table 6.1 in Benchmarking the User Experience.
For example, for a standalone benchmark study to achieve a margin of error lower than 10% with 90% confidence around most metrics, plan on a sample size of 65.
If you’re comparing your experience to an earlier design or a competitor’s design with different users in each benchmark study and want to detect differences of 12% or greater, you should plan for a sample size of 213 in each group for a between-subjects study or 93 total for a within-subjects study.
For more detail on these computations, see Chapter 6 in Benchmarking the User Experience.
| Difference to Detect 90% Confidence and 80% Power | Sample Size Within-Subjects | Sample Size Between-Subjects (Each Group) |
|---|---|---|
| 50% | 17 | 11 |
| 40% | 20 | 17 |
| 30% | 29 | 32 |
| 20% | 50 | 75 |
| 12% | 93 | 213 |
| 10% | 115 | 307 |
| 9% | 130 | 380 |
| 8% | 148 | 481 |
| 7% | 171 | 629 |
| 6% | 202 | 857 |
| 5% | 246 | 1,234 |
| 4% | 312 | 1,930 |
| 3% | 421 | 3,433 |
| 2% | 640 | 7,726 |
| 1% | 1,297 | 30,911 |
Table 2: Sample sizes for comparison benchmark studies for within- and between-subjects study benchmarks (using 90% confidence and 80% power). Adapted from Table 6.2 in Benchmarking the User Experience.
If the cost per participant is relatively small (say under $15) and you have plenty of samples to pull from, then it’s just a matter of using the tables and planning your study. For many consumer website experiences, the cost of recruiting and honorariums for 100–200 participants for an unmoderated study is comparable to running a ten-person moderated study.
But what if you don’t have access to a lot of users or the users you need are difficult and expensive to recruit, such as small business owners or users of niche payroll software?
Logistical Considerations
It’s often the logistical constraints of finding the right participants within a reasonable budget and time that dictates the sample size.
When working with clients at MeasuringU, it’s not uncommon for us to encounter significant challenges in finding enough of the right participants; for example, users of B2B software products may need to fit specific profiles. Our discussion then pivots from the ideal sample size to the minimum sample size that will still get “meaningful” data.
While there isn’t a clear threshold where data goes from meaningless to meaningful, you can look at the sample size tables to try and find the sample size at which you get the most gain in precision for a small increase in sample size.
The level of precision rises the most when sample sizes are small. You gain the most from increasing your sample size after the first few participants, after which there’s a diminishing return.
For example, you can see in Table 1 that the margin of error around your metrics decreases seven points (24% to 17%) when you go from a sample size of 10 to 21. To further increase precision with another seven-point drop in the margin of error, you’d need to more than triple that sample size (n = 65).
For within-subjects studies, you can also detect differences in completion rates with sample sizes between 20 and 30, though the differences are relatively large (30–40%+ differences—see the Table 2 line that starts with 40% and 30%). To detect 40% differences in a between-subjects study, you’d need about 34 participants (17 x 2).
Both tables assume completion rates of 50%, which leads to the most conservative sample size estimates. For task times, we found in earlier research that a sample size of 20 has a similar margin of error (less than 20% for 95% confidence).
We can also use the large sets of data we have on the System Usability Scale (SUS) and Single Ease Question (SEQ) to generate historical standard deviations of 21 for SUS and 1 for the SEQ (variability is a key ingredient in sample size computations). This data resulted in the entries in Table 3.
| Metric | Standalone Margin | Within-Subjects Difference | Between-Subjects Difference |
|---|---|---|---|
| SEQ | 0.4 | 0.58 | 0.8 |
| SUS | 8 | 12 | 17 |
Table 3: SEQ and SUS expected margin of error (n = 20) for standalone studies at 90% confidence, and detectable differences for within-subjects and between-subjects comparisons for 90% confidence and 80% power.
At a sample size of 20, the margin of error is about 8 points for the SUS and about .4 points for the SEQ. If you obtain a SUS score of 70 at the end of the benchmark with 20 participants, the expected 90% confidence interval would range from 62 to 78. For the SEQ, if you observe a mean of 5.5 with n = 20, the 90% confidence interval would be about 5.1 to 5.9. Table 3 also shows it’s possible to detect large differences in within- and between-subjects studies. At a sample size of 20 using a within-subjects experimental design, you can detect a difference of .58 in SEQ scores and a 12-point difference in SUS scores. For between-subjects designs, the critical differences are 17 for the SUS and .8 for the SEQ.
So, for both standalone and comparison studies (especially within-subjects), sample sizes of 20–30 seem to provide the most gain in measurement precision for the smallest recruiting pain.
Problem Detection Considerations
Because most benchmark studies often have the goals of not only quantifying the experience but also finding the reasons behind the numbers, you can also take into account the ability to detect problems.
At a sample size of 20, you can see MOST of the most obvious usability problems and a lot of the less obvious ones. Figure 1 shows the probability of seeing an issue at least once depending on how common it is at sample sizes of 10 and 20. You achieve near saturation (100% discovery) for problems that affect 25% of customers when n = 10. But for rare problems (those affecting 1% of customers), you double your discovery from 10% with n = 10 to 20% when n = 20.
At a sample size of 20, you have at least a 90% chance of seeing problems that affect 10% or more of the user population at least once (compared to at least 65% when n = 10). As a point of reference, the notorious butterfly ballot was thought to affect about 1 out of 10 voters, so at a sample size of 20, you would have had a very good chance of seeing this issue at least once.
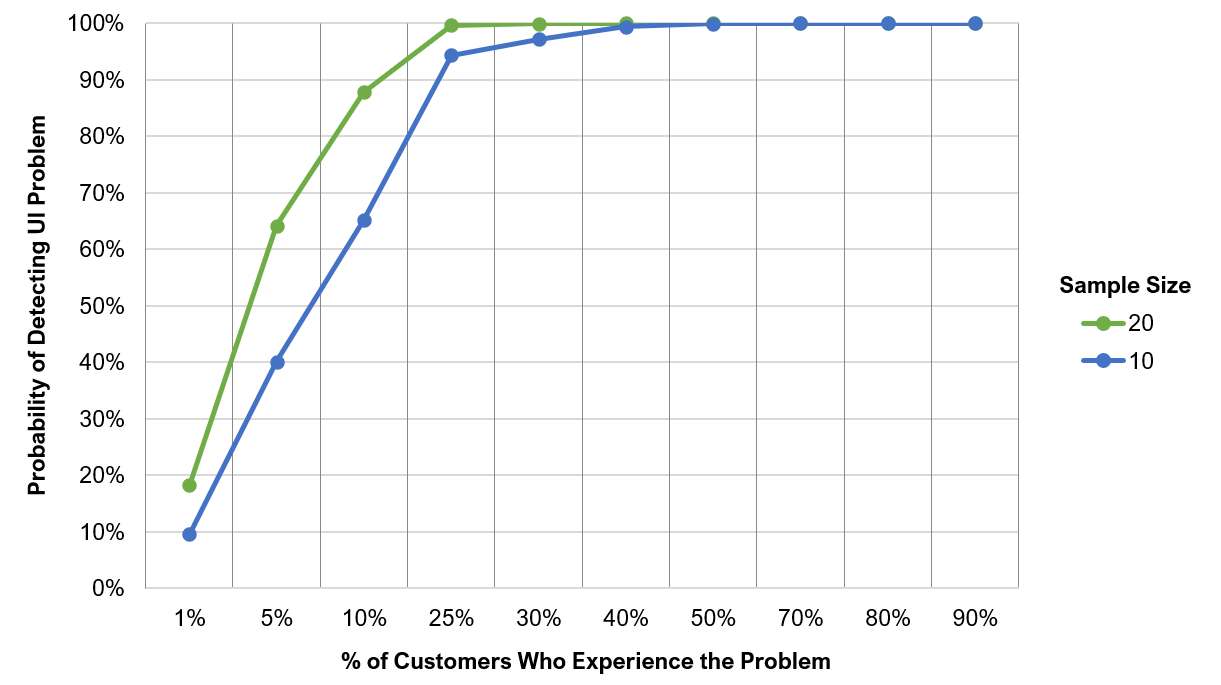
Figure 1: Probability of detecting a UI issue at least once for n = 10 and n = 20 for issues with likelihoods of occurrence from 1 to 90%.
Summary
When the cost and time (logistics) for recruiting aren’t prohibitive, determine your sample size based on the statistical precision needed for a standalone study or the size of difference you hope to detect for a comparative benchmark study. If the cost of sampling is high, or it’s difficult to find participants, aim for at least 20 to 30 participants.
If that turns out to be impossible, you can relax the minimum sample size a bit. Data isn’t meaningless when n = 18 or 19, just a bit less precise. But for much smaller sample sizes, always use the tables or some means of determining whether the sample size is simply too small to achieve the precision/saturation you need for the decisions you must make. If that is the case, you should strongly consider reworking your benchmarking plans so you can obtain enough participants.