
How much did you spend on Amazon last week?
If you had to provide receipts or proof of purchases, how accurate do you think your estimate would be?
In an earlier article we reported on the first wave of findings for a UX longitudinal study. We found that attitudes toward the website user experience tended to predict future purchasing behavior.
In general, customers of websites who rated the experience relatively poorly (in the bottom quintile) reported purchasing less and spending less in the subsequent 90 days than those who rated websites more favorably.
To draw our conclusions, we asked participants to self-report their purchase behavior. First, we asked participants to select which, if any, of a selected group of websites they had purchased from (e.g., Walmart, Best Buy, Target) in the prior 90 days. The list also included the name of the website the participant had indicated they had previously purchased from.
We then asked participants to report the total number of times they purchased in the 30–90 days since the initial survey and how much money they estimate they spent. But how accurate is this self-reported purchase data?
Assessing the Accuracy of Self-Reported Data
It can be quite difficult (and invasive) to track actual behaviors and activities. Consequently, many studies, like ours, rely on self-reporting for data such as purchase history and health information.
There are published studies examining the accuracy of self-reported data and, as you would expect, self-reports aren’t fully accurate. But how accurate they are depends on the questions being asked.
For example, two studies by Brenner and DeLamater found self-reported rates of exercise and church attendance were double the actual frequency of those behaviors when compared to other records (Brenner and DeLamater 2016, Brenner and DeLamater 2014).
A study by Geisen et al. (2016) assessed the accuracy of the Consumer Expenditure Quarterly (CEQ). The CEQ is an influential survey conducted by the US Census Bureau that’s used to calculate the weight of items in the Consumer Price Index (CPI) on household items (such as appliances, clothing, and utilities). The CEQ asks respondents to recall purchases dates and amounts for the prior 90 days for a variety of products (similar to our study).
The authors asked 115 respondents to provide receipts and any corroborating records of self-reported purchase data similar to those asked in the CEQ. A total of 3,039 expenditures were listed from the respondents but records were only provided for 36% of the expenditures.
Expenditures that were purchased more recently, that were more expensive, or were housing, telephone, or utility purchases were also more likely to have a record.
Of these available records, around half (46%) of the self-reported data contained errors (defined as being off by more than 10% from the record). On average, the expenditure amounts were under or overestimated by about 30%.
In examining the reasons for the discrepancy, the vast majority were that they simply could not accurately recall the cost expenditure.
In another study, Ahmed, Brzozowski, and Crossley (2006) [pdf] examined data from a large (n = 10,898) representative sample of Canadian households from the Canadian Food Expenditure Survey, which asked respondents to recall how much they spent on food. They found the recall measure overestimated expenditures compared to the diary study by between 8% and 21% across two weeks. They found the diary study itself though was an “imperfect measure.”
Examining Our Data
We received self-reported purchase data from 1,160 participants between January and March 2019 as part of our longitudinal study of UX behaviors. In that survey we asked whether participants who provided their purchase estimates (amount and number) would be willing to provide receipts or records verifying the transaction data. A bit less than half, 515 (44%), of the participants agreed to participate in the follow-up study. Here are some examples of the websites participants recently purchased from (recall we asked for purchases other than Amazon):
- eBay
- United Airlines
- Planet of the Vapes
- Walmart
- Big Finish
- Fashion Nova
- Zappos
- Target
- Grove Collaborative
- Poshmark
- Crew
We invited around half (237 of the 515) of the respondents who agreed to be contacted to participate in a follow-up survey for additional compensation. In the survey we asked participants to upload receipts and records that would provide evidence of their purchases. Participants were reminded of the store and amount they reported during the survey, but they were not told the specific amount and store ahead of time.
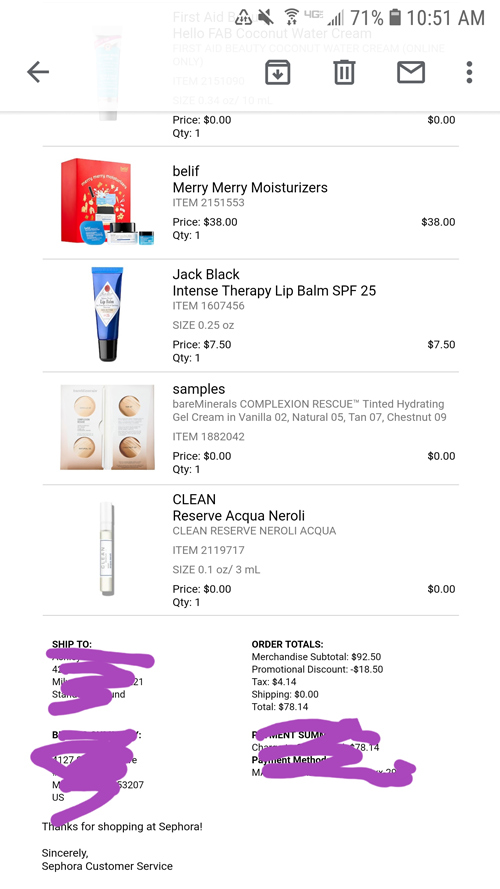
Figure 1: Example uploaded purchase verification from a participant for the Sephora website.
Of the 237 invited, 137 (58%) completed the survey. The other 100 withdrew after receiving the invitation or provided partial data and abandoned the survey. We suspect a large reason for the drop out was that participants didn’t easily have access to nor want to take the time to find receipts for their past purchases.
Of the 137 completed responses, eight respondents reported having problems with saving and uploading screenshots of their receipts, leaving 129 with the opportunity to upload a receipt to match their self-reported purchase information.
Eleven respondents didn’t upload any receipts, leaving 118 respondents with at least one receipt uploaded for us to examine. The mean number of receipts uploaded was 2.3, with a range of 1 to 17. The respondent attrition funnel can be seen in Figure 2. The average SUPR-Q score was almost identical to the full sample (4.18 vs. 4.21), suggesting a reasonably representative sample with respect to the experience.
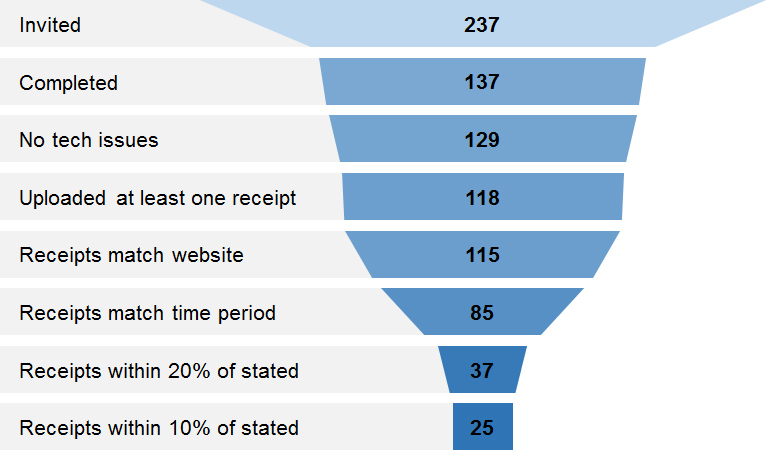
Figure 2: Attrition funnel showing the number of respondents that started and then provided valid purchase data for each verification step.
Purchase Verification
We examined receipts from the 118 participants and found that almost all, 115 of them (98%), provided receipts for the website they said they made their most recent purchase for. The remaining three (2%) participants provided receipts for another website. Or, of the 129 who had an opportunity to upload a receipt, 115 of them (89%) provided a receipt that matched the store.
Amount Verification
We examined the receipts from the 115 participants that matched the reported website purchase. Next, we verified the purchase period (previous 30 to 90 days depending on the survey date) and found 85 respondents provided receipts that both matched the website and were within the time period (refer to Figure 2).
Following the procedure by Geisen et al., we considered a purchase to be accurate if it was within 10% of the reported purchase amount. For example, if a participant said they spent $50 at eBay and the receipt shows $47, it would be considered a match.
Of the receipts from the 85 respondents, 25 of them (29%) provided totals that were within 10% of the self-reported amount and 37 (44%) provided receipts within 20% of the self-reported amount. Compared to the total number of receipts from respondents that matched their website (115), 78% contained an error. This is definitely higher than the 46% error rate reported by Geisen et al.
Respondents tended to slightly overestimate their self-reports compared to their receipts (52% overestimated and 48% underestimated). Five respondents understated their actual spending receipts by at least double, significantly skewing the average error in estimates. For example, one of these respondents reported spending $250 at Target but provided a receipt totaling $963.58—an estimation error of 285%. To account for this skew, we used the median and found the median reported purchase amount was under or overestimated by 25%. This estimation error is actually quite similar to the 30% error reported by Geisen et al.
We asked participants to provide any qualifications to their uploads. Several of the comments shed some light on the differences between the self-report and records.
- I stated the purchase was $250 when apparently it was actually $199. My mistake.
- Turns out the total was closer to $7, not $8. Sorry for the confusion!
- I didn’t add exactly, so it was actually a little more than $400.
- I said I had ordered $300, but it turned out to be about $315.
- I guess I overestimated how much I spent—more around $100 or so.
Note that the first two comments show the respondents had estimates that were off by more than 10% of their receipts ($250 vs. $199 and $8 vs. $7) but certainly seem within an acceptable estimate, suggesting 20% may be a more realistic threshold for estimation accuracy.
Earlier research by Geisen et al, found that reoccurring and large purchases tended to be the most accurately recalled, and in general, people tend to “telescope” earlier purchases to a more recent time period. What’s more, we asked participants to provide an estimate of the amount they spent without letting them know we would ask for proof of purchase (this was asked only later in the survey).
It’s likely the combination of unaudited estimating, infrequent small purchases, and possibly telescoping are leading to the less accurate purchase amounts. Despite this, several of our estimates of accuracy are close to the more rigorous study done by Geisen et al.
Revisited Analysis with Actual Purchase Data
In our earlier analysis, we found the respondents who reported the best experiences (highest SUPR-Q quintiles) reported spending 54% more and purchased 25% more than participants who had the worst relative experience. We can revisit that conclusion using this verified data. To conduct this analysis, we used the 115 receipts that matched the reported website (even if they fell outside the time period), allowing us to have a reasonable sample size to detect patterns.
Figure 3 shows the SUPR-Q quintile scores for the amount respondents said they spent compared to what we could verify from the uploads.
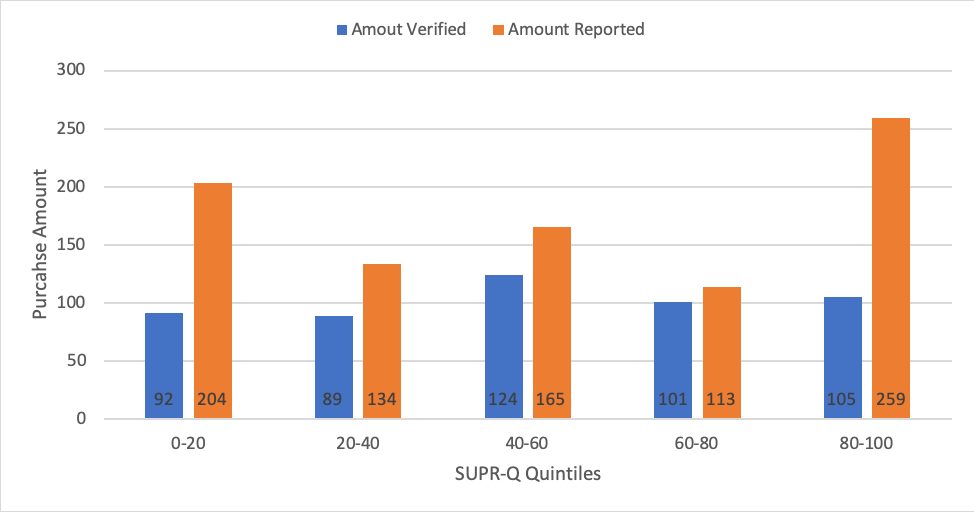
Figure 3: Amount respondents said they spent and amount we verified by SUPR-Q quintiles.
The mean amount respondents said they spent is higher for each SUPR-Q quintile compared to what we verified. This is especially the case for the first (80–100) and fifth (0–20) SUPR-Q quintiles (the respondents who rated their experience in the top 20% compared to the bottom 20%).
Using the self-reported purchase data (called “Amount Reported” in Figure 3) for this group shows a similar but attenuated pattern to our earlier findings. The respondents with the best relative experience reported spending 21% more in the subsequent 30–90 days ($259 in top quintile vs. $204 in bottom quintile).
When we look at the verified amounts, we see an even more diluted pattern (called “Amount Verified” in Figure 3). The top quintile spent about 13% more than the bottom quintile ($105 vs. $92). Neither the self-reported nor the verified amount differences are statistically significant.
Number of Purchases
In examining the receipts and comparing that to reported number of purchases we suspect the number of items purchased and number of transactions were conflated. Many receipts contained dozens of items (especially Walmart and Target). In our earlier purchase survey, some respondents reported making hundreds to thousands of purchases from online websites over a 1 to 2-year period. In these cases, most likely some participants interpret a purchase to be the any item purchased versus the number of unique transactions.
For this analysis, we used the total number of receipts uploaded by each participant as a proxy for the number of transactions, which may be a better indicator of loyalty than a single purchase with multiple items (see Figure 4).
Participants who had the highest relative experience had almost twice as many uploaded receipts as those who had the worst relative experience (3.4 vs. 1.8). This difference is marginally significant at p = .098.
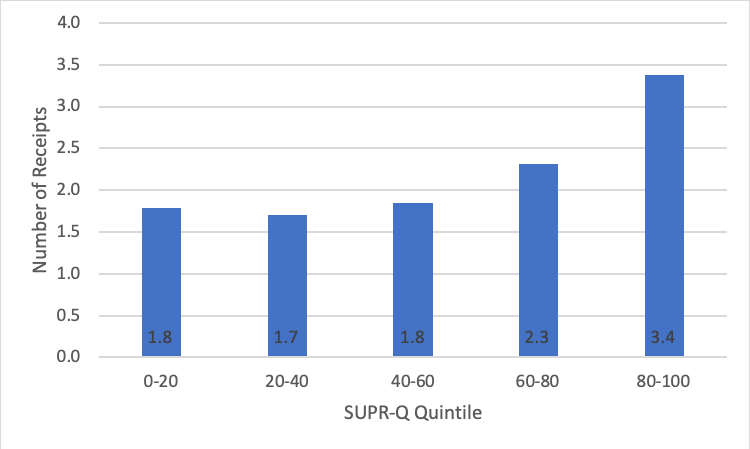
Figure 4: Number of uploaded receipts by SUPR-Q quintile. Respondents with the best relative experience uploaded almost twice the number of receipts compared to those with the worst relative experience (3.4 vs. 1.8; p = .089).
Summary and Takeaways
Our analysis of self-reported purchase data compared to verified receipt data found:
Purchase rates were accurate. We found that almost all participants (98%) who completed the study were able to provide proof of purchase for the website they reported purchasing from. This suggests that self-reported purchase rates are likely accurate. That is, if a respondent said they purchased from eBay or Walmart, they most likely did.
Amount spent was less accurate. We found that only 29% of the receipts that matched the store had amount totals that were within 10% of the self-reported amount and 44% of receipts were within 20% of the amount. Only 22% of receipts that both matched the store purchase and the timeframe were within 10% of the self-reported amount. This low accuracy on the amount spent is likely a consequence of at least three things: inaccurate recall from smaller non-reoccurring purchases, telescoping the purchase into a more recent time period (leading to overestimating amounts), and the consequence of respondents estimating amounts without being asked to check or keep records of the transactions. Using the verified purchase amounts did show a similar, although much more attenuated, pattern of higher purchase amounts for participants with the best experience. This suggests an “unaudited” estimate of small amounts spent on a website may be at best a crude indicator of the actual amount spent. It also suggests that a 20% threshold may be more realistic for self-reported purchase accuracy (for example, $8 reported vs. $7 verified is an error of 13%).
Better experiences precede more transactions. Using the total number of receipts participants uploaded as a proxy for transactions suggests again that participants with the best relative experience purchase more frequently than those with the less relative experience. A future analysis can continue to investigate this finding as well as clarify the distinction between number of items purchased and number of transactions.
Non-response bias is a factor. There is a chance for non-response bias that may be inflating our very high purchase rate of 98%. That is, it could be that those respondents who didn’t complete the follow up study didn’t actually purchase from the store. However, our final response rate was around 50% of the number invited to provide proof of purchase (Figure 2). Even if we assume all those who didn’t respond actually didn’t make the purchase, it still puts the verified response rate at around 50%.
Increasing recall is necessary. There have been studies going back over 50 years that have addressed the accuracy problem with self-reported purchases as well as suggesting ways to increase them. For example, we could have let participants know ahead of time that their purchase data would be audited as well as using diary-study formats that allow for better record keeping. This likely would increase our purchase amount accuracy; however, it’s unclear whether this introduces another problem of affecting responses. For example, participants may only report purchases that they definitely can verify, such as reoccurring large purchases. A future analysis can also examine balancing recall errors with ease of obtaining self-reported purchase behavior.
Thanks to Emily Geisen for commenting on an earlier draft of this article.