 When learning statistics, you’ll encounter many formulas based on principles of probability and mathematics. But statistics isn’t just a formulaic process where you enter data and are told what to do. Statistics should guide, not dictate, decisions.
In making decisions, though, there are different styles of interpreting data. Although a lot of people think statistics will provide definitive right and wrong answers, the practice is much more nuanced and subject to interpretation. In fact, statistics, like other disciplines, is influenced by the people using them and the context in which they are used. Interpreting statistical output can be a lot like interpreting the law.
For example, in constitutional interpretation, multiple well-educated and informed people can read the same words and interpret those words to mean different things. What constitutes speech? With legal interpretation, we’ve come to expect differences that can result in heated debate, as judges and justices are selected based on how they differ in their interpretation of the same few words. Styles of legal interpretation can lie on a spectrum from conservative to liberal, with many subtle distinctions.
While statistics doesn’t have a Magna Carta, constitution, or bill of rights, it does have guiding principles. Those principles, like the written law, are subject to interpretation. And while it may seem odd to compare statistics to politics, the two have much in common when it comes to understanding differences in opinions.
Experts in statistics, as in other disciplines (e.g., particle physics, radiology), disagree. We see this disagreement in how a video of a participant attempting a task elicits different interpretations and remedies from different UX professionals.
Interpretative differences can take many forms. In statistics, there tends to be a continuum of interpretation styles. Robert P. Abelson, a former statistical professor at Yale, has attempted to define these styles modeled on what we see in politics.
In 1995, Abelson published Statistics as Principled Argument, a book targeted at students taking their first-year graduate statistics course. He would joke that his original title was going to be, “Lots of Things You Ought to Know about Statistics, but Are Too Stupefied to Ask.”
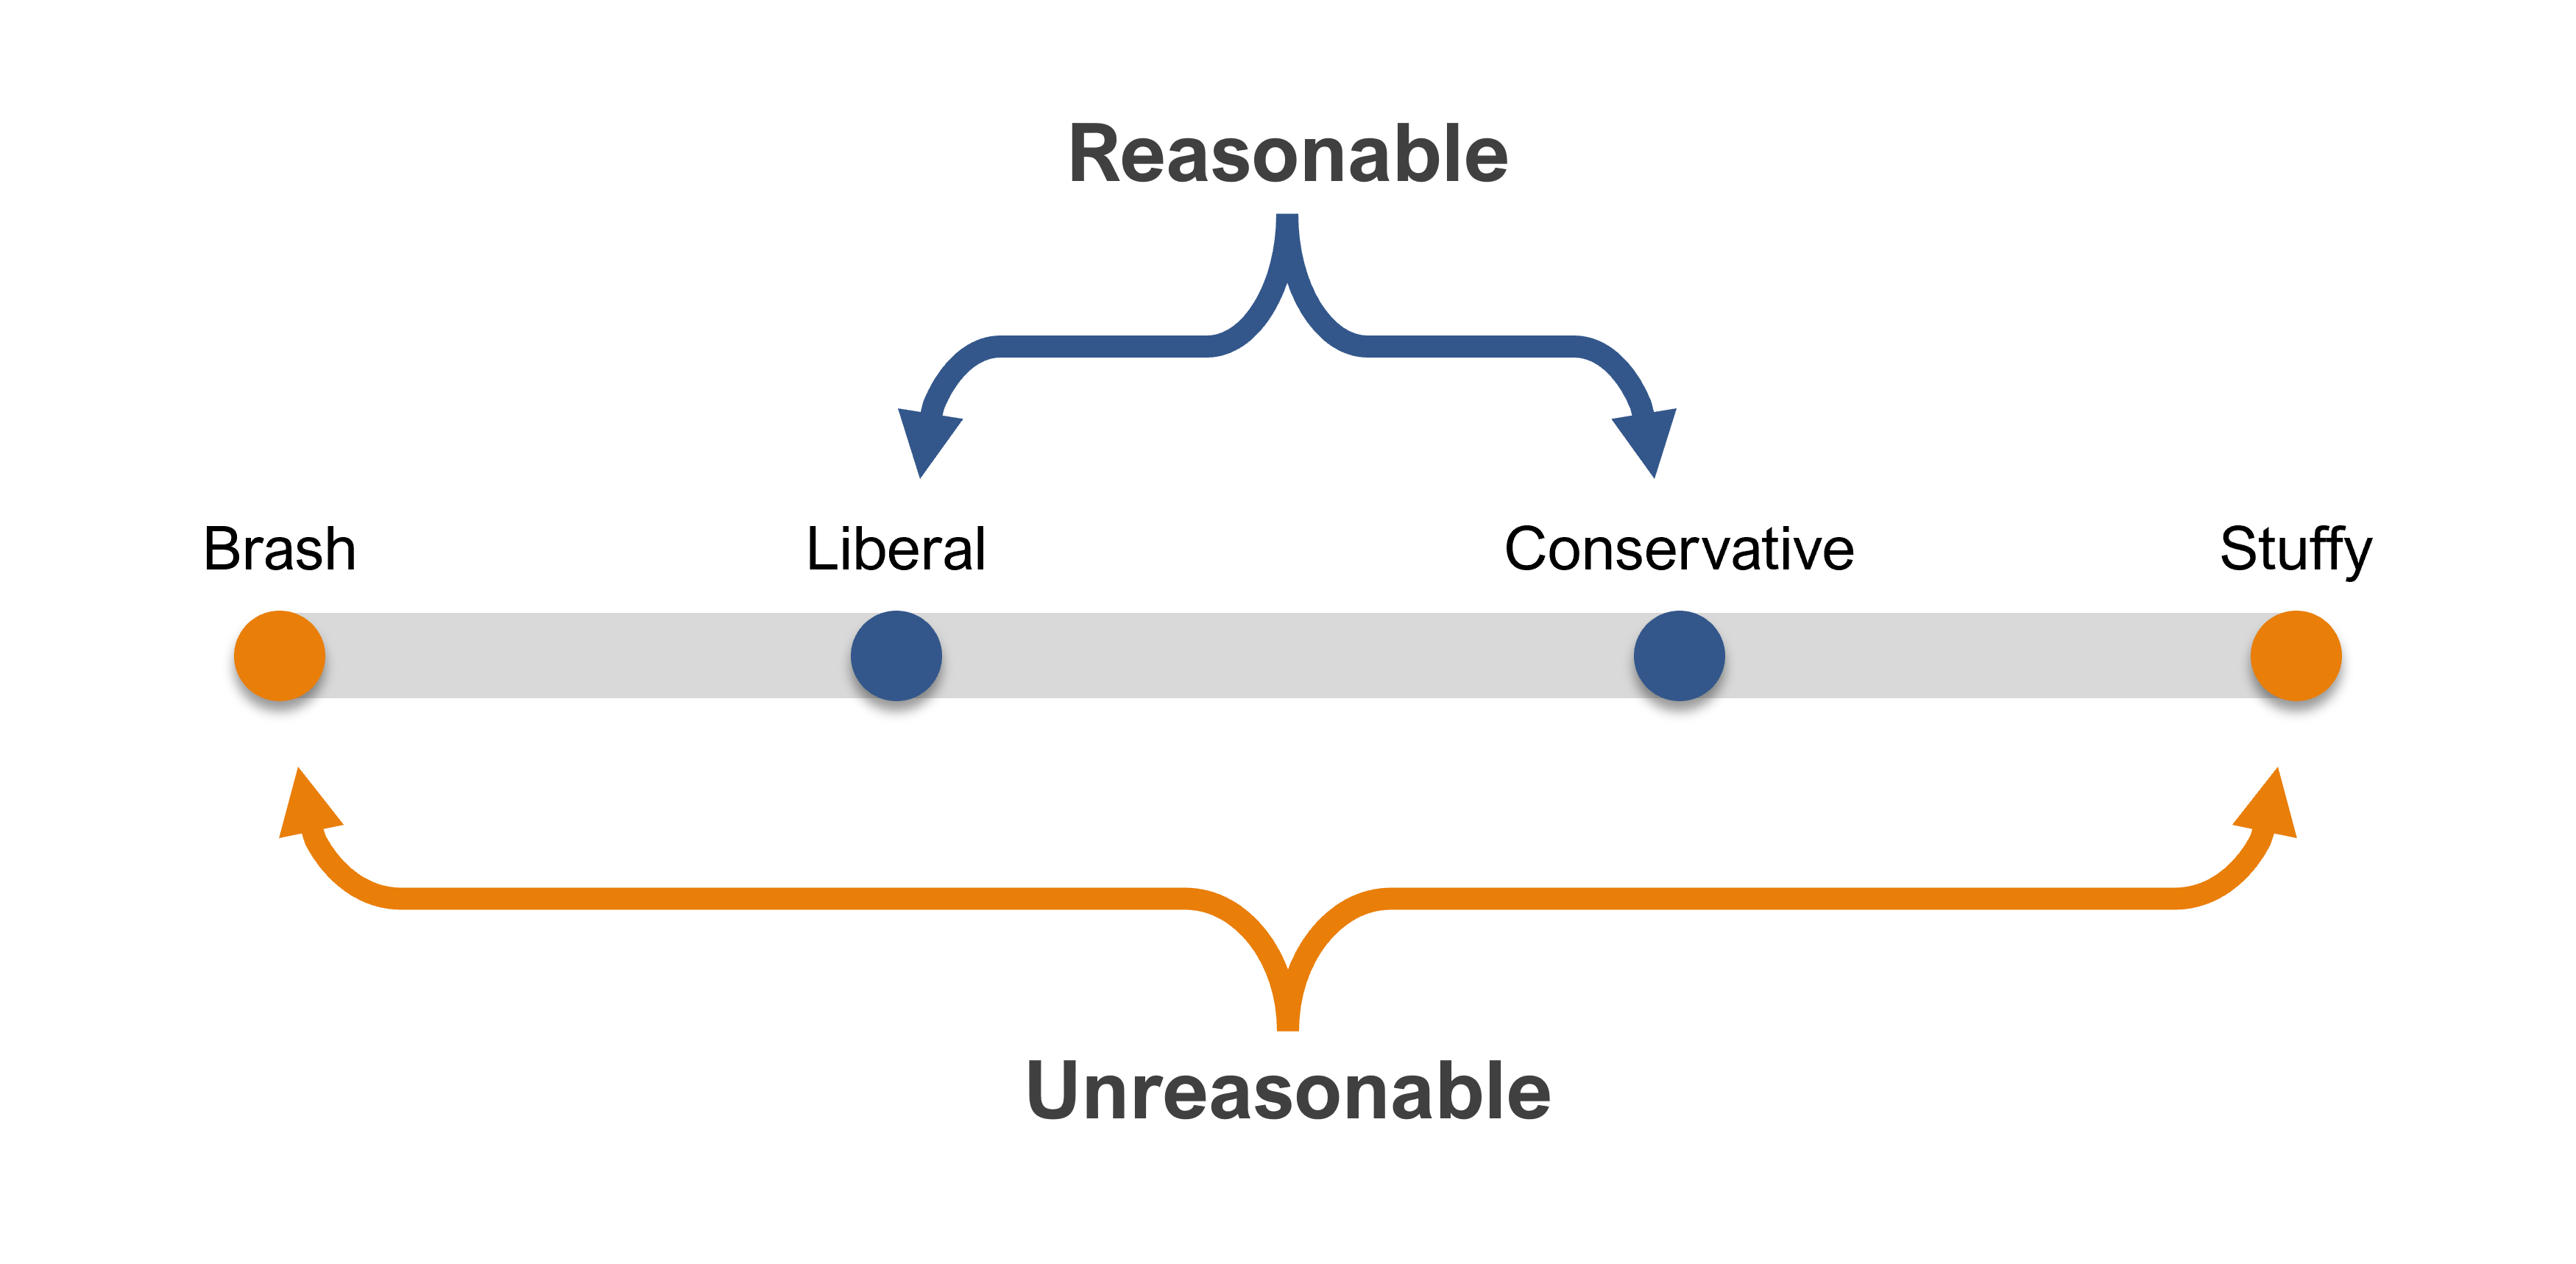
In that book, Abelson articulated four different styles of statistical rhetoric, displayed in Figure 1 from brash to stuffy.
In this article, we review Abelson’s four styles and describe a fifth style—the pragmatic style.
The Brash Style
On the spectrum of attitudes, we start with an extreme-left attitude. When applied to statistical rhetoric, in most cases, researchers who exhibit the brash style would rather have their analyses produce statistically significant outcomes than fail to reject their null hypotheses.
Taken to an extreme, researchers who are desperate to achieve statistical significance have several ways to create the illusion of statistical significance. The use of these methods when they cannot be justified is the hallmark of the brash style. Here are some symptoms of this style:
Conducts one-tailed tests when they are not appropriate. Statistical tests can be one-tailed or two-tailed. All other things being equal, one-tailed tests indicate statistical significance more often than two-tailed tests. One-tailed tests are appropriate in a small set of research contexts, for example, when comparing a sample of data to a set benchmark. Otherwise, the logic of statistical hypothesis testing requires the use of two-tailed tests.
Engages in p-hacking. Just by chance, if you run enough tests, some of them will indicate statistical significance even though there is no real effect (i.e., Type I errors). This practice is known as p-hacking. One way to do this is to test all possible splits in a data set, whether or not they were related to hypotheses documented before data collection. Another is to run all possible multiple comparisons for an independent variable with many levels (e.g., multiple products in a retrospective UX survey), focusing on significant results without regard to the number of comparisons.
States actual p-value but talks around it. If you have decided ahead of time, based on careful consideration of the research context, to set the alpha criterion to p < .05, you should stick with it. If you have analyzed the relative costs of Type I and Type II statistical decision errors and concluded that an alpha criterion of p < .10 (or p < .001) is appropriate, then stick with that. (There is nothing magical about p < .05.) But these decisions need to be made before running statistical tests. If you fudge on the p-values to support the conclusions you want to make, your style is brash.
Manipulates outliers. Like the decision about which alpha criterion to use, decisions about how to treat outliers should be made before data collection and analysis. Researchers with a brash style make that decision after they see the data, either including or excluding outliers as needed to support the points they want to make.
We refer to the rhetorical style that overstates every statistical result as brash. Investigators who use the … devices previously listed, freely and inappropriately, invite skepticism and disfavor. (Abelson, 1995, p. 55)
The Stuffy Style
On the other end of the spectrum is the extremely conservative stuffy style. It’s the extreme opposite of the brash style (“anything goes”), reaching extreme cautiousness (“nothing goes”). Researchers using a stuffy style would exhibit these symptoms:
- Never use one-tailed tests, even when they’re appropriate.
- Never explore data with more than one type of analysis.
- Never exclude outliers no matter how extreme they are.
- Always use the most conservative methods for multiple comparisons (e.g., Scheffé’s method).
- Never use an alpha criterion greater than p < .05, and never distinguish between outcomes that are close to the alpha criterion and those that are far from it.
Abelson noted that some statistics textbooks and instructors promote an excessively cautious, stuffy style. The problem with the stuffy style is that all these practices emphasize the control of Type I errors (false positives) and ignore the effect on Type II errors (false negatives), substantially inflating combined Type II errors to cause an “Easter Island” problem.
When there are multiple tests within the same study or series of studies, a stylistic issue is unavoidable. … Random patterns will seem to contain something systematic when scrutinized in many particular ways. If you look at enough boulders, there is bound to be one that looks like a sculpted human face. Knowing this, if you apply extremely strict criteria for what is to be recognized as an intentionally carved face, you might miss the whole show on Easter Island. (Abelson, 1995, p. 70)
Some of these textbook authors are likely teaching a stuffy style aimed towards fields that need to protect against false discoveries, such as is medicine and pharmaceuticals. For example, 80% of the highly promising and “groundbreaking” cancer drugs, roughly 15 years after publication, were no longer used in clinical practice. That’s even after several rounds of statistically significant findings in clinical trials!
The Liberal and Conservative Styles
The liberal style of statistical rhetoric is the first of the two reasonable styles.
The liberal style is more exploratory and speculative, while the conservative style is tighter and more cautious. Think of a liberal style as similar to classical liberalism in politics, with an emphasis on freedom and individual liberties.
In statistics as in politics, either style can be defended, and there are individual differences in preference. Also as in politics, the most successful arguments are those that satisfy both liberals and conservatives. (Abelson, 1995, p. 57)
For example, there will be stylistic agreement when a liberal approach fails to reject a null hypothesis and when a conservative approach claims statistical significance. On the other hand, there will be stylistic disagreement when a liberal approach claims statistical significance, but a conservative approach does not.
When that happens, reasonable people, liberal and conservative, may disagree on the interpretation of the results.
The Pragmatic Style
It seems to us that there is a fifth style between liberal and conservative—the pragmatic style (Figure 2).

The hallmark of the pragmatic style is to be stylistically consistent within a study or series of related studies and to adopt a more liberal or conservative style based not on personal preference but on careful analysis of the research context.
As we wrote at the beginning of Chapter 9 in Quantifying the User Experience (Sauro & Lewis, 2016, p. 250):
Within a single study or group of related studies, you should consistently apply whatever decision you’ve made, controversial or not. Ideally, you should make and document these decisions before collecting any data to reduce the temptation to pick and choose among the alternatives to make the findings favorable to your point of view (capitalizing on chance effects).
For example, if false declarations of statistical significance (Type I errors) would have devastating consequences, and failing to claim significance (Type II errors) would not, then it makes sense to adopt a very conservative style (e.g., setting the alpha criterion to p < .005 when assessing medical treatments).
However, when avoiding Type II errors is at least as important as avoiding Type 1 errors (e.g., assessing a new software design created to address problems in the previous design), a more liberal style is warranted.
Furthermore, pragmatic researchers avoid a narrow focus on statistical significance, using it as only the first analytical step before using confidence intervals to assess practical significance.
We speculate that Abelson did not describe this stylistic strategy because his experience was primarily in academic research, with its focus on publication and its general bias toward the control of Type I errors over Type II errors in the process of evaluating the plausibility of theories.
When you take statistical tools into industrial research contexts, there is substantially greater variability in the appropriate balance between Type I and Type II decision errors, and simple declarations of achieving or failing to achieve statistical significance are not sufficient for decision making.
Industrial researchers, including UX researchers, are best served by adopting a pragmatic style.
Summary
Abelson (1995) described four styles of statistical rhetoric:
- Brash: Unreasonably aggressive in the search for statistical significance.
- Stuffy: Unreasonably cautious to avoid methodological criticism.
- Liberal: Reasonable version of brash—relaxed and open to exploration.
- Conservative: Reasonable version of stuffy—appropriately cautious and less afraid of criticism.
Thinking about these styles and their implications for research in different contexts can be helpful for researchers who use statistical analysis to guide their research narratives.
A conservative style is appropriate in some research contexts (e.g., research on medical devices). However, in a typical UX research context, avoiding Type II errors (false negatives) can be as important as avoiding Type I errors (false positives), so a more liberal style is warranted.
Based on stylistic practices that include (1) consistency within related studies but a willingness to be liberal or conservative depending on the research context and (2) a focus on practical rather than just statistical significance, we’ve described a fifth style between liberal and conservative—the pragmatic style.