 Question wording in a survey can impact responses.
That shouldn’t be much of a surprise. Ask a different question and you’ll get a different answer.
But just how different the response ends up being depends on how a question has changed. Subtle differences can have big impacts; alternatively, large differences can have little impact. It’s hard to predict the type and size of impact on responses without testing.
For example, in an earlier study we found only a small impact when changing the wording of the Likelihood to Recommend question. The difference in scores between asking WILL you recommend and WOULD you recommend changed the results by about 1%. That was a small wording change that had only a small effect.
But changes to response options can also alter responses in unpredictable ways.
Unfortunately, there’s more folklore than scientific inquiry around “right” and “wrong” ways of presenting response options. For example, there’s a sort of conventional wisdom that you should alternate the tone of items from positive to negative in a questionnaire. We (and others) have demonstrated why that’s not a good idea.
There’s also advice to use only three points in a response scale, but our research (and others) has shown that using so few points in a scale usually does more harm than good.
In general, it’s best to test and not guess the effects (when possible) of changing question wording and response options.
For example, we tested the effect of adding colors to 11-point scales (showing red, yellow, and green). What we thought would result in a big difference was relatively small.
One question recently posed to us was what the effects of using “Extremely” versus “Very” were on the endpoints of a five-point rating scale.
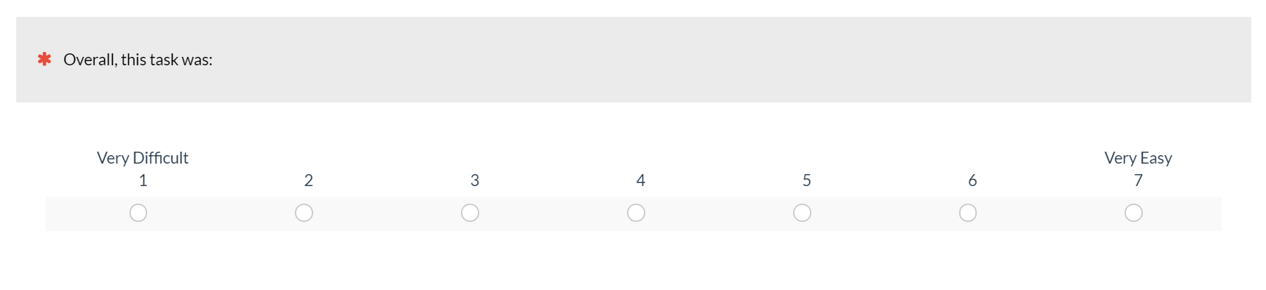
For example, the Single Ease Question uses “Very” as its top-box anchor.
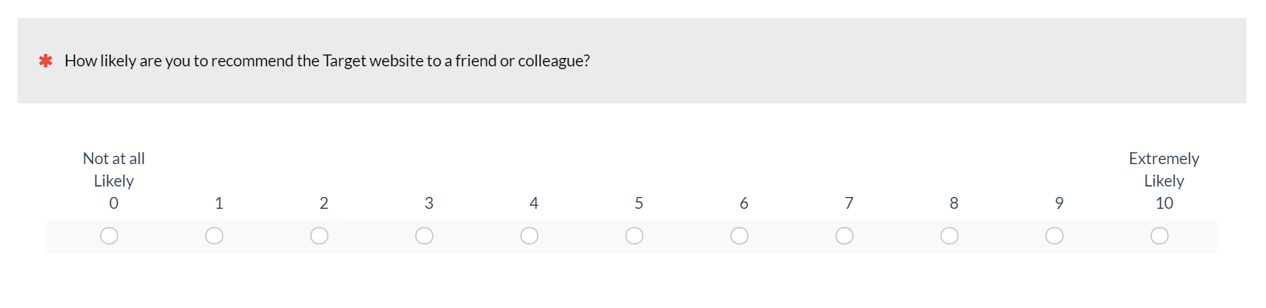
 The Likelihood-to-Recommend item used to compute the NPS uses “Extremely” as its top-box response.
 And more general satisfaction items with varying number of points sometimes use “Extremely” and sometimes “Very.” What does this do to responses?
Research on Endpoint Labels
A number of studies have investigated the effects of labeling scale points. But the focus has almost always been on whether to label all points or just the endpoints (a topic for a future article). There was no research I could find on the effects of specifically varying the wording of labels from “Extremely” to “Very.”
In a study we conducted over a decade ago at UXPA, we examined the effects of changing the wording of the original SUS items by making them more extreme, either more positive or more negative.
For example, the first item in the ten-item SUS questionnaire (when asked about a website experience) is “I think that I would like to use this website frequently.”
The more extreme positive version of this statement we used in our study was “I think that this is one of my all-time favorite websites.”
The extreme negative statement we tested was “I think I never want to use the website again.”
The results of that study showed that people were more likely to disagree to the extreme positive and negative statements. The effect was quite large (about a 25% impact on SUS scores). And interestingly, the effect was a bit larger for the extreme positive items, suggesting people were more likely to disagree with positive statements than negative statements.
In that study we drastically changed the item wording but kept the response options the same (1 = Strongly Disagree to 5 = Strongly Agree). What happens if we keep the question the same and only adjust the endpoint labels from “Very” to “Extremely”? We conducted a study to find out.
Very vs. Extremely: Within-Subjects Study
In October 2019, we asked 213 U.S.-based online panel participants to respond to two versions of a five-point satisfaction item. We kept the scope of this study to just a satisfaction item with five fully labeled and numbered response scales. Future studies can examine the additional effects of different scale points, questions, and scale types.
The first version of the satisfaction item was scaled from “Very Dissatisfied” to “Very Satisfied” (Figure 1) and the second version was scaled from “Extremely Dissatisfied” to “Extremely Satisfied” (Figure 2).
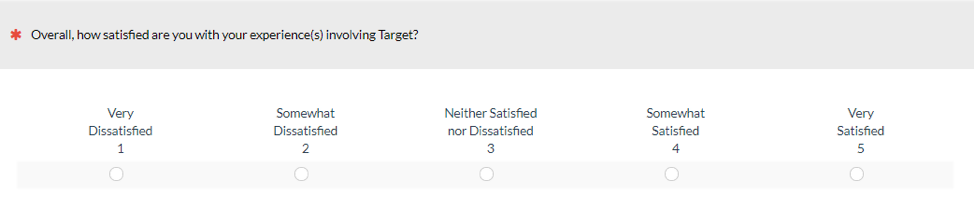
Figure 1: The “Very” version of the five-point satisfaction scale.
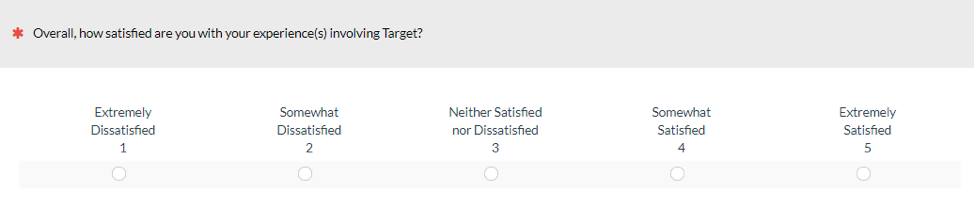
Figure 2: The “Extremely” version of the five-point satisfaction scale.
We used a within-subjects study based on the results of our will vs. would results, which showed that differences between people can mask more subtle differences in wording. In this within-subjects study, participants saw both the “Very” and “Extremely” versions of the satisfaction item. Only participants who reported having made a purchase from one of the four retailers (IKEA, The Home Depot, Lowes, Target) were then asked to respond to both satisfaction questions.
These questions were part of a larger survey and the two variants were randomized to be shown either in the beginning of the survey or at the end. Between the two satisfaction questions were other unrelated questions regarding attitudes toward design elements and other measures of brand attitude and intent to recommend. Roughly half of the participants saw the “Very” question first and the other half the “Extremely” variant first.
Study Results
Figure 3 shows there was an overall slight pattern of satisfaction scores being modestly higher on the “Very” condition in two of the four brands we measured. These differences were not large: .01 for IKEA and .03 for Lowes. The Home Depot score was identical. Target scores were higher on the “Extremely” satisfaction question (.02). However, none of these differences were statistically significant using a paired t-test at the p < .05 threshold.
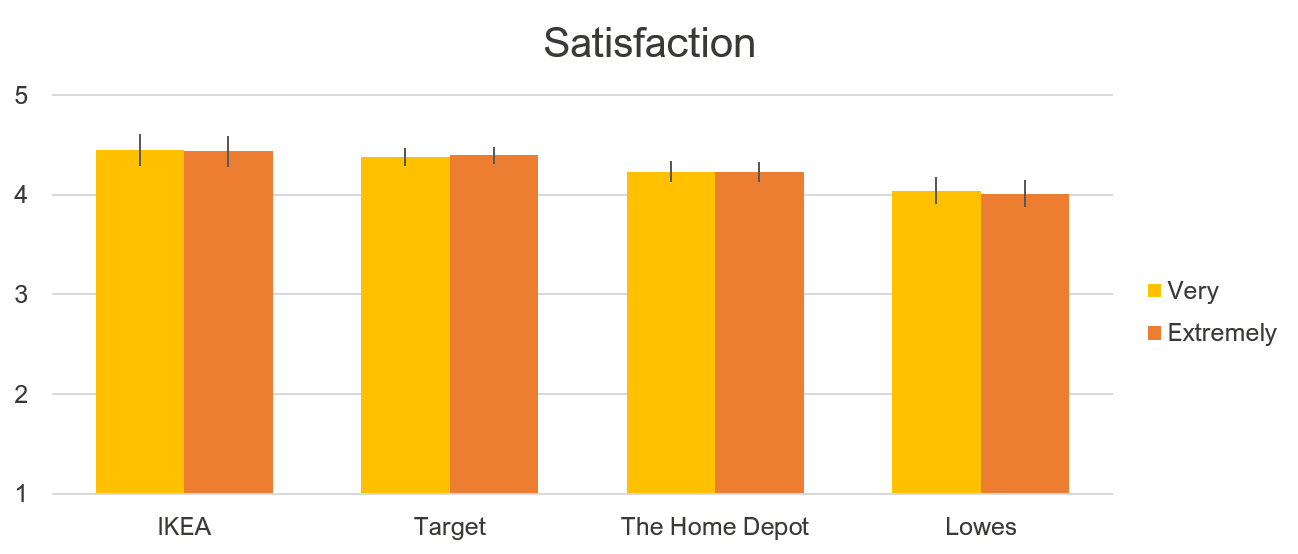
Figure 3: Differences in mean satisfaction between the “Very” and “Extremely” versions.
We then aggregated the responses across the brands and also found a very small difference of .01, with “Extremely” being slightly lower than “Very.” A statistical test was not conducted because people could respond to more than one brand (violating the independence assumption of the paired-t test).

Figure 4: Aggregate means in “Very” and “Extremely” responses.
Changes to the mean score is not the only effect on responses. It could be that other shifts are happening but aren’t as detectable on the mean. To find out, we also looked at how individual responses changed. In total there were 520 responses across the four brands from the 213 respondents. The vast majority of responses (92.3%) didn’t change, showing good stability between both presentations of the items (suggesting this instance of satisfaction was reliable). Of the 7.7% of responses that did change, it was mixed, with 4.2% going down when “Extremely” was present, offset by 3.5% that increased.
We next looked at the shift in extreme responses—those that moved to or from a 5. Table 1 shows that when the “Extremely” version is shown rather than “Very,” 16 out of the 520 responses changed from 5 to 4 (a 3.1% reduction in top-box scores). This was offset by 9 responses (1.7%) moving from 4 to 5. Overall, the “Extremely” version resulted in a 1.4 percentage point shift in responses away from the top-box response. The percent changes observed were not statistically significant; however, a future study with a larger sample size may find these differences to be statistically significant if the same patterns hold.
| Going from “Very” to “Extremely” | Total | % |
|---|---|---|
| 4 to 5 | 9 | 1.7% |
| 5 to 4 | 16 | 3.1% |
Table 1: Shift to and from top-box responses across four brands from “Very” to “Extremely” versions of the satisfaction item.
Summary and Discussion
The results of our study with 213 participants responding to a “Very” vs “Extremely” version of a five-point satisfaction revealed:
Using “Extremely” instead of “Very” decreases scores slightly but not significantly. Our results showed only small and not statistically significant differences when changing the endpoint labels from “Very” to “Extremely.” When “Extremely” was used, mean responses were slightly lower in two of the four brands we measured.
“Extremely” reduces top-box scores. There were slightly larger differences when only examining changes in top-box scores. Fewer respondents selected the top-box satisfaction response when “Extremely” was present. Again, this difference was modest and not statistically significant with a net difference of 1.4 percentage points.
People are less likely to agree to extremes. Both this study and our earlier study on extreme SUS items are consistent with the general principal that the more difficult a question or response is to agree to, the fewer people who will agree to it. This is also the idea behind the SUPR-Qm, which uses Item Response Theory and intentionally has some items that are more difficult for respondents to agree with to better differentiate between attitudes.
This study had limited scope. We only tested one type of scale, a five-point satisfaction item that was fully labeled and numbered. It’s unclear whether these small differences will increase or attenuate if we also fluctuate the number of points to, say, seven or eleven and if we change the type of questions and the actual labels used (for example in the Likelihood to Recommend item used in the NPS). These are all good topics for future research.
Don’t guess; test. It’s worth repeating that much conventional wisdom on response scales is either unsubstantiated, incorrect, exaggerated, or maybe highly dependent on the context in which questions and scales are used. It’s hard to know whether small changes to item wording or response formats will have a big or small impact on scores. When in doubt, check the research, and if possible, test your assumptions. (Or ask us and we might just test them for you!)