 Small changes can have big impacts on rating scales. But to really know what the effects are, you need to test.
Labels, number of points, colors, and item wording differences can often have unexpected effects on survey responses.
In an earlier analysis, we compared the effects of using a three-point recommend item compared to an eleven-point recommend item.
In that study, we showed how a three-point scale stifles respondents and loses information about extreme respondents (who are usually better predictors of future behavior). Those results are consistent with the published literature, which mostly shows that three-point scales have inadequate reliability and poor validity.
In our study, we used a three-point scale that asked respondents whether they will recommend a business to a friend. The usually phrased “how likely are you to recommend” didn’t map well to a yes/no/maybe scale, so we reworded it to use the “will you recommend” as shown in Figure 1.
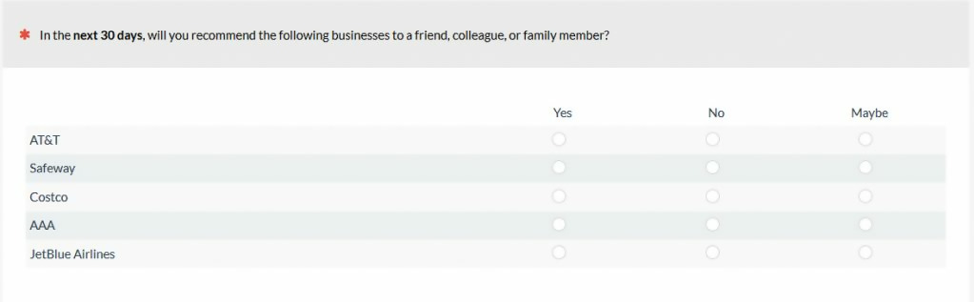
Figure 1: An example of a “will recommend” item used in our earlier study.
Adam Ramshaw of Genroe wondered whether our use of will affected the results compared to asking whether people would recommend.
There is a subtle difference in meaning between “will” (which implies a definite future action) compared to ”would” (which implies a potential future action, or even something that was in the future but isn’t anymore). Often small differences to a question’s wording or scale format can have important effects. Is that the case here? Does changing the wording of the recommend intention question from “Would you recommend?” to “Will you recommend?” affect results?
We’ve seen many slight wording differences in the Likelihood to Recommend item, including adding qualifiers such as “to a friend or colleague or family member,” or “if you were asked.” To find out what affect changing “will” to “would” may have on the results, we conducted two studies.
Study 1: Will vs. Would Between Subjects
In September 2019, we asked 320 U.S.-based online panel participants to respond to one of two versions of the 11-point Likelihood to Recommend item for a selected list of nine retailers and airlines they reported having recently purchased from (Amazon, Target, Walmart, Home Depot, Lowes, United Airlines, Southwest, Delta, IKEA).
Participants were randomly assigned to one of the response scales that varied only in whether they used “will” (148 participants; shown in Figure 2a) or “would” (172 participants; shown in Figure 2b). The items were shown as part of a larger survey that included additional questions about satisfaction (and the color variations shown in our earlier article).
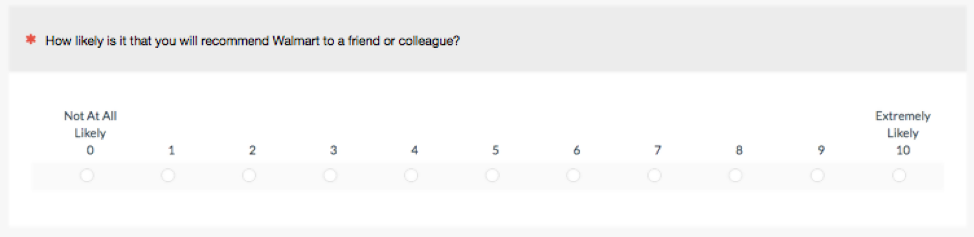
Figure 2a: The “will recommend” variant shown to 148 participants.
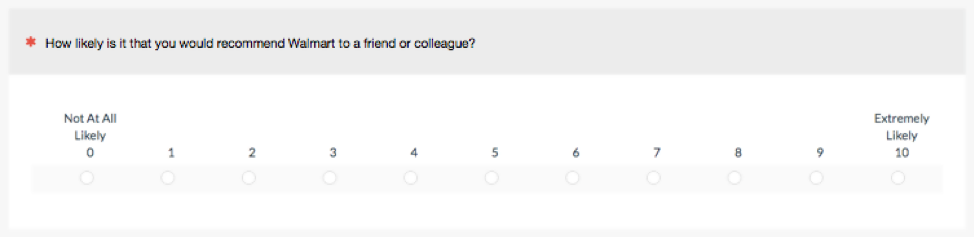
Figure 2b: The ”would recommend” variant shown to 172 participants.
Study 1 Results
Learning from the findings of our study on color changes, we first aggregated all responses (so if one person reflected on five brands, their scores are included five times). The aggregated results across participants and brands are shown in Figure 3. The “would” condition had a slightly lower number of detractors compared to the “will” condition (26% vs. 32%).
Note: We did not conduct a statistical test on the aggregated data because the same person’s responses are used multiple times within each category, violating the independence assumption of most statistical tests. We conducted statistical tests on the per-brand analysis.

Figure 3: Difference in response patterns for aggregated responses for the “will” and “would” wording variations of the Likelihood to Recommend item.
In looking at the differences within the nine brands (see Figure 4) there’s less of a pattern. The “will” variation had lower mean scores for six brands (e.g., Amazon, Target) and higher for three others (e.g., Delta, Southwest).
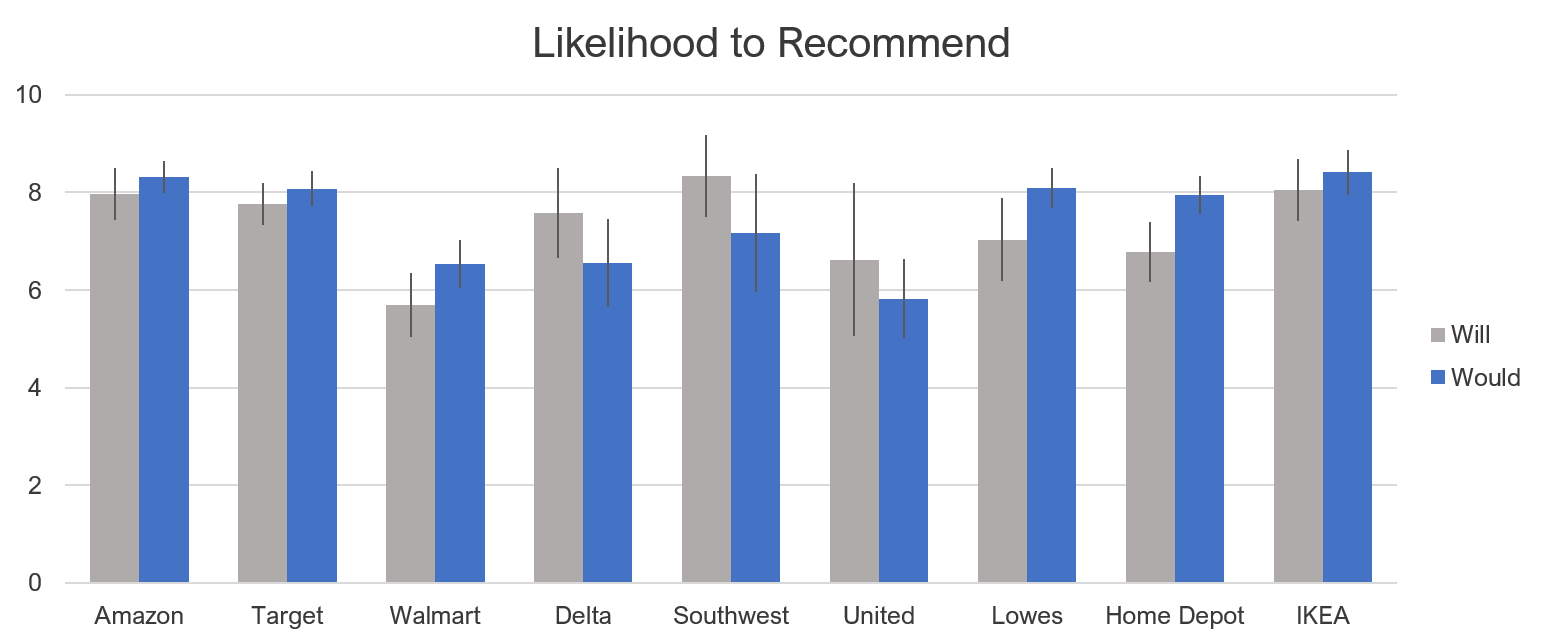
Figure 4: Difference in response patterns for each of the nine brands for the “will” and “would” variations of the Likelihood to Recommend item.
The results of Study 1 suggest that the “would” wording has only a small effect of reducing the detractor responses, but only when the results are aggregated across participants and across brands. One shortcoming of this study is the sample sizes weren’t evenly balanced. For example, there were about twice as many people who rated their Likelihood to Recommend on United in the “would” condition (17) versus the “will” condition (8). While that’s not a problem when comparing for each brand (the confidence intervals can handle uneven sample sizes), it’s possible that much of the difference we observed in the aggregated data comes from this imbalance in sample sizes. To help offset this potential confounding effect, we conducted a second within-subjects study.
Study 2: Will vs. Would Within Subjects
In October 2019 we asked 213 participants to reflect on a subset of the brands from the first study (Target, Lowes, Home Depot, and IKEA) and asked to respond to the 11-point Likelihood to Recommend (LTR) item. Participants were only shown companies that they reported having made a purchase from in the last year.
Because this was a within-subjects study, participants saw both the “will” and “would” versions of the LTR item. These questions were part of a larger survey, and the two variants were randomized to be shown either in the beginning of the survey or at the end. Between the two LTR questions were other unrelated questions regarding attitudes toward design elements and other measures of brand attitude and intent to recommend. Thus, roughly half the participants saw the “would” variant first and the other half saw the “will” variant first.
Study 2 Results
The aggregated results across participants and brands are shown in Figure 5 for the LTR. While Study 1 (between subjects) resulted in fewer detractors in the “would” condition, this effect went away after controlling for the variability between subjects and sample sizes.
In Study 2 the wording of the LTR item had little to no effect on the number of promoters and detractors. The “will” condition had slightly more promoters than the “would” condition (45% vs. 44%) and slightly fewer passives (32% vs. 33%).
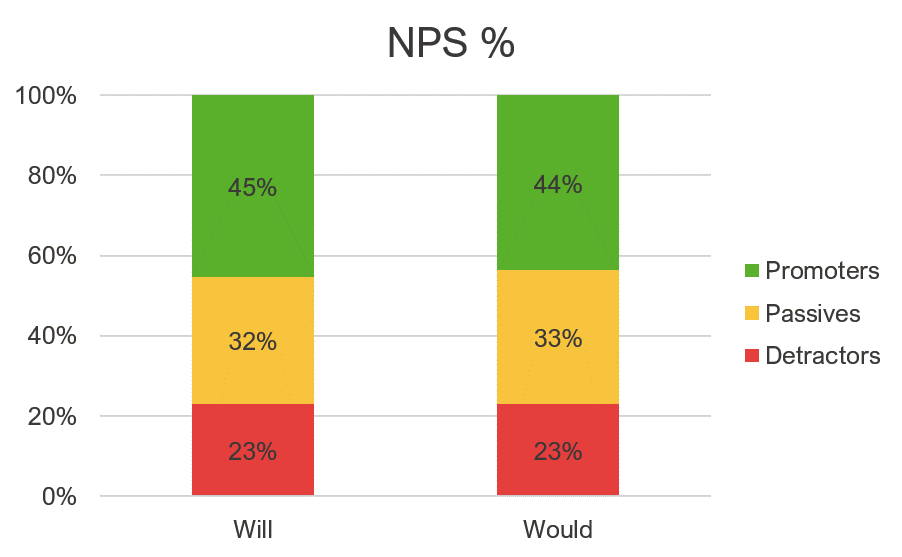
Figure 5: Difference in response patterns for aggregated responses for the “will” and “would” wording variations of the Likelihood to Recommend item.
Figure 6 shows there was an overall pattern of LTR scores being slightly (0.9%) higher on “will” LTR questions across companies. These differences in scores were not large, ranging from 0.03 (0.4%) for Home Depot to 0.12 (1.5%) for Target. Only the difference for Target was statistically significant (using a paired t-test; p = .01)

Figure 6: Differences in mean Likelihood to Recommend scores between the “will” and “would” versions. The differences for Target were statistically significant (p < .05).
“Would” Results in Slightly More Negative Scores
To better understand what is causing the slight shift in mean scores, we looked at the number of participants who moved categories when the “would” version of the Likelihood to Recommend item was used compared to “will.” In total there were 520 responses from the 213 participants across the four brands and two scale variants.
Table 1 shows that when the “would” version is shown rather than “will” version, the largest movement is from positive to negative (6.2% shift to a less positive category): promoters become passives (22) and passives become detractors (10). This is offset with 4.8% moving from negative to positive: passives become promoters (14) and detractors become passives (11). Overall, the “would” version resulted in slightly more participants (1.4%) moving from positive to negative ratings.
| From "Will" | To "Would" | Number | % |
|---|---|---|---|
| Promoter | Passive | 22 | 4.2% |
| Passive | Promoter | 14 | 2.7% |
| Detractor | Passive | 11 | 2.1% |
| Passive | Detractor | 10 | 1.9% |
Table 1: Shift of the 520 responses across four brands from the “will” to the “would” versions of the LTR.
Summary and Takeaways
Across two studies with 533 participants responding to a “will” or “would” version of the 11-point Likelihood to Recommend item we found:
Using “will” instead of “would” recommend slightly increases scores. Using “will recommend” instead of “would recommend” had a small, statistically significant increase of 1.5% for only one brand (Target) in our second study. Across all brands, the average mean difference was less than 1% higher for the “will” condition. The larger differences we observed in our first study were confounded by the effects of different sample sizes for some brands on each condition. We saw larger differences from showing or not showing the neutral label and even the effects of color.
While “will” implies definitely, the results show opposite. We had suspected using the word “will” may imply a more definite future action to respondents and reduce scores, as in “I definitely WILL do something,” compared to the less definite “I would do something.” We, therefore, expected the mean scores for “will” to be slightly lower (as people might hedge their intentions). However, the results show the opposite as the means were nominally higher for the “will” groups (again, slightly and statistically in only one case).
It may matter in other contexts. While we didn’t see major differences in this study, it could be that people don’t respond differently enough to the subtle meaning of the words to have a meaningful impact. But it could also be because of at least three other mitigating reasons: the brands we were asking participants to reflect on, our administration in the survey, and the respondents’ inattention. Other brands or experiences may be more sensitive to changes in “will” to “would.” It’s also possible that because our intent-to-recommend items were presented in a larger survey, respondents paid less attention and didn’t notice the change in wording. And finally, it’s also likely that participants don’t carefully read items and instead scan them for key words and use shortcuts (heuristics) to interpret and respond to them (regardless of how long the study is). A future study can examine the effects of changing “will” and “would” in isolation and see what percentage of participants even notice the difference.