The Difference between Observed and Latent Variables

You can’t see customer satisfaction. You can’t see usability. There isn’t a thermometer that directly measures someone’s intelligence. While we can talk about satisfied customers, usable products, or smart people, there isn’t a direct way to measure these abstract concepts. And clearly these concepts vary. We’ve all had experiences that left us feeling unsatisfied or

Read More »

Controlling for Brand Attitudes in UX Studies

There are a number of variables that affect UX metrics. In most cases though, you’ll simply want to measure the user experience and not these other “nuisance variables” that may mask the experience users have with an interface. This is especially the case when making comparisons. In a comparative analysis you use multiple measures to

Read More »

5 Steps for Getting Started with Statistics for Research

Statistics can be daunting, especially for UX professionals who aren’t particularly excited about the idea of using numbers to improve designs. But like any skill that can be learned, it takes some time to understand statistical concepts and put them into practice. Most participants at our UX Boot Camp go from little knowledge of statistics

Read More »

Essential Excel Skills For Researchers Part 2

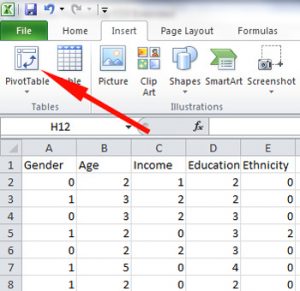
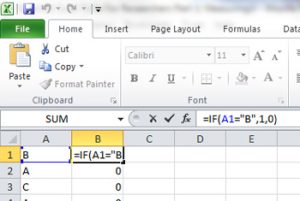
Excel is an invaluable tool for analyzing and displaying data. In Part 1 I covered some essentials Excel skills, such as conditionals, absolute references and the fill handle. In this second part I’ll cover a few more advanced functionalities that mimic database manipulations. You can also find these examples in the downloadable spreadsheet. 1. VLOOKUP

Read More »

Essential Excel Skills For Researchers Part 1

Excel is a powerful program. It’s like an onion, peeling back layers to reveal increasingly specialized functions. The minute you think you’ve mastered it, you discover a new set of functions. It can take years to learn it and unfortunately there’s not usually a class on learning Excel in university. Students have to pick things

Read More »

Can You Take the Mean of Ordinal Data?

Yes, of course you can. But it depends on who you ask! It’s a common question and point of contention when measuring human behavior using multi-point rating scales. Can you take the average of a Likert item (or Likert-type item) similar to the following? The website is easy to use: Here’s how 62 participants after

Read More »

Visualizing Data: Raw vs Difference Scores

One of the best ways to make metrics more meaningful is to compare them to something. The comparison can be the same data from an earlier time point, a competitor, a benchmark, or a normalized database. Comparisons help in interpreting data in both customer research specifically and in data analysis in general. For example, we’re

Read More »

Create a UX Measurement Plan

Whether you’re introducing how to measure user experience to an organization or trying to advance the maturity of your UX practice, you need a plan for measuring and improving the user experience. Before you can implement any plan, you have to be sure you know who your users are. Perfectly executing the right plan on

Read More »

How to Handle Multiple Comparisons

You go to your doctor for a checkup. You’re feeling fine but as a matter of procedure, your doctor orders a battery of tests and scans to be sure all is well. She runs 30 tests in total. A few days later she calls and tells you one of the tests came back positive–an indication

Read More »

5 Steps for Better Customer Sampling

For most customer research, you’re rarely able to measure the attitudes or behaviors of everyone. Instead you take a sample of your customers and use this sample to make inferences about the rest of your customers. Even if you’re in a situation where you can collect data from all current customers, it’s not possible to

Read More »
0
    0
    Your Cart
    Your cart is emptyReturn to Shop
    Scroll to Top