 In an earlier article, we demonstrated the validity of measuring tech savviness with technical activity checklists (TAC™) by analyzing the correlation between TAC scores and successful completion rates in four usability studies. The TAC scores significantly correlated with success rates (i.e., people with higher levels of tech savviness tended to complete more tasks). On average, tech savviness explained about 22% of the variation in task success, making it a significant driver of why people attempting technical tasks succeed or fail.
Establishing validity is a crucial step in the development of a standardized questionnaire, demonstrating that it measures what it’s intended to measure. A logical next step is to extend the utility of the TAC by identifying thresholds. What makes someone only slightly tech savvy? What defines high tech savviness? How many levels of tech savviness can be discerned from the data?
In this article, we describe the development of a scheme using TAC scores and task completion rates to classify participants into tech-savvy groups (e.g., high, medium, low).
The TAC Questionnaires
When we think of tech savviness, it’s helpful to classify people into at least binary (low or high) levels, and potentially ternary (low, medium, high) or more levels. While the TAC may be a good candidate item to measure tech savviness, what are the logical thresholds that make someone low or high tech savvy?
From 2021–2022, we used screeners from several studies to collect over 6,000 completed technical activity checklists that included the activities shown in Figures 1 (TAC-9) and 2 (TAC-10). We used the percentage of activity selections to set up candidate classification schemes for the TAC-9 and TAC-10.
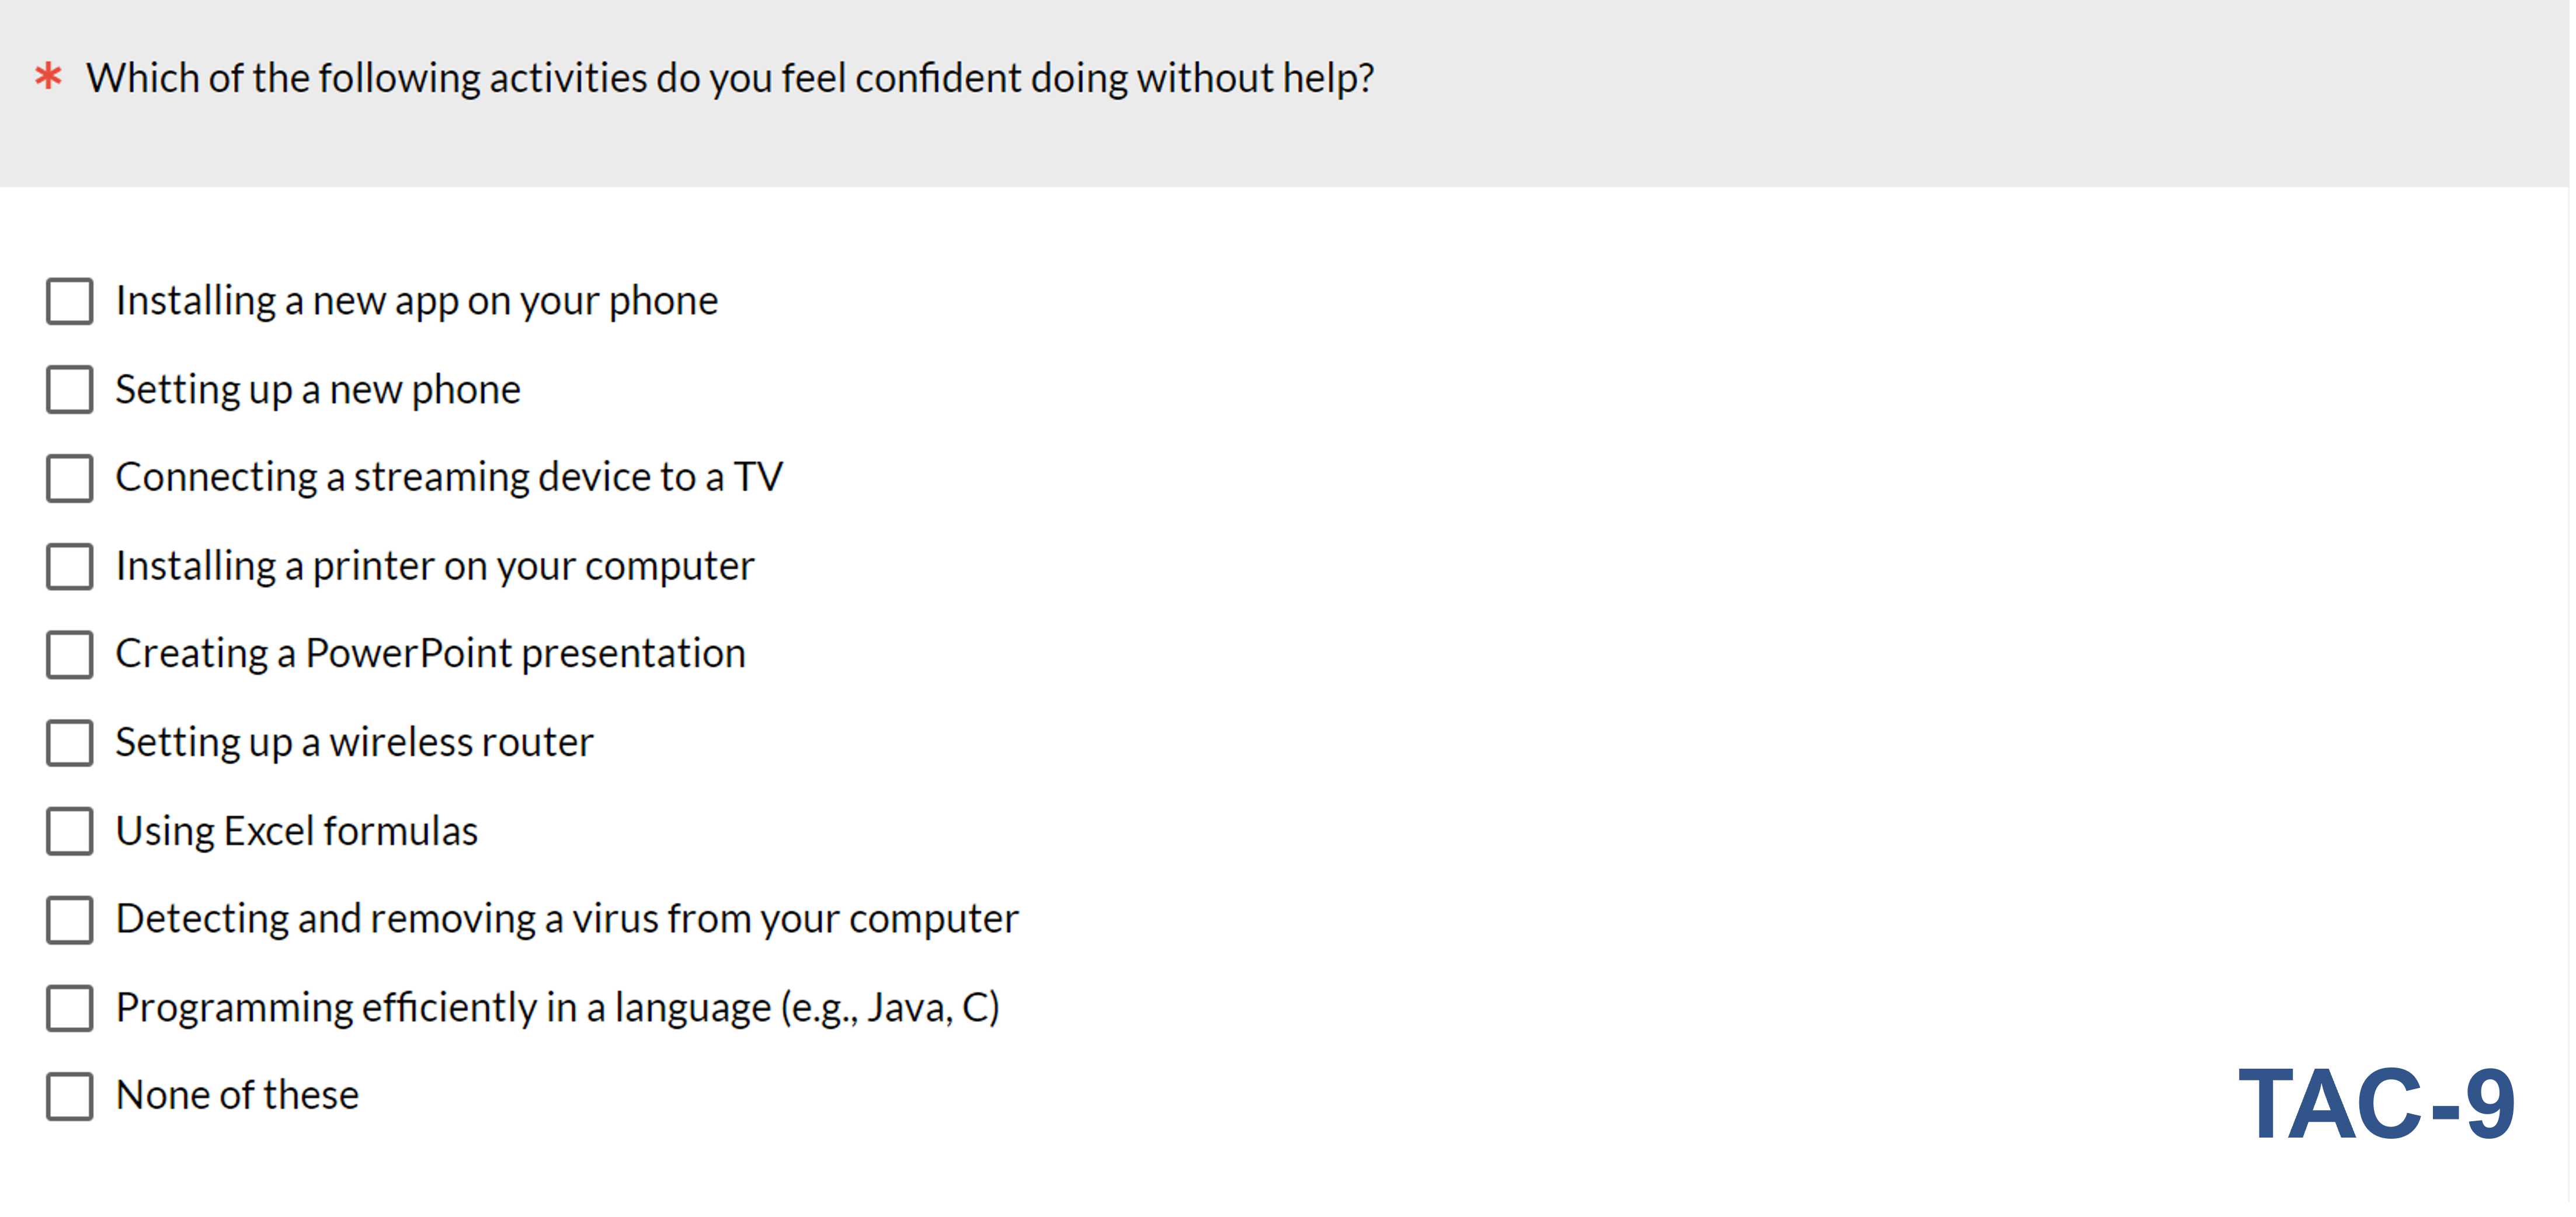
Figure 1: The TAC-9, created with MUiQ®. In practice, we randomize the presentation order of the activities except for “None of these,” which is always last and, when selected, cancels all other selections.
In two studies, the checklist included a tenth item, positioned between the virus and programming activities to fill a measurement gap identified with Rasch analysis (the TAC-10 shown in Figure 2).
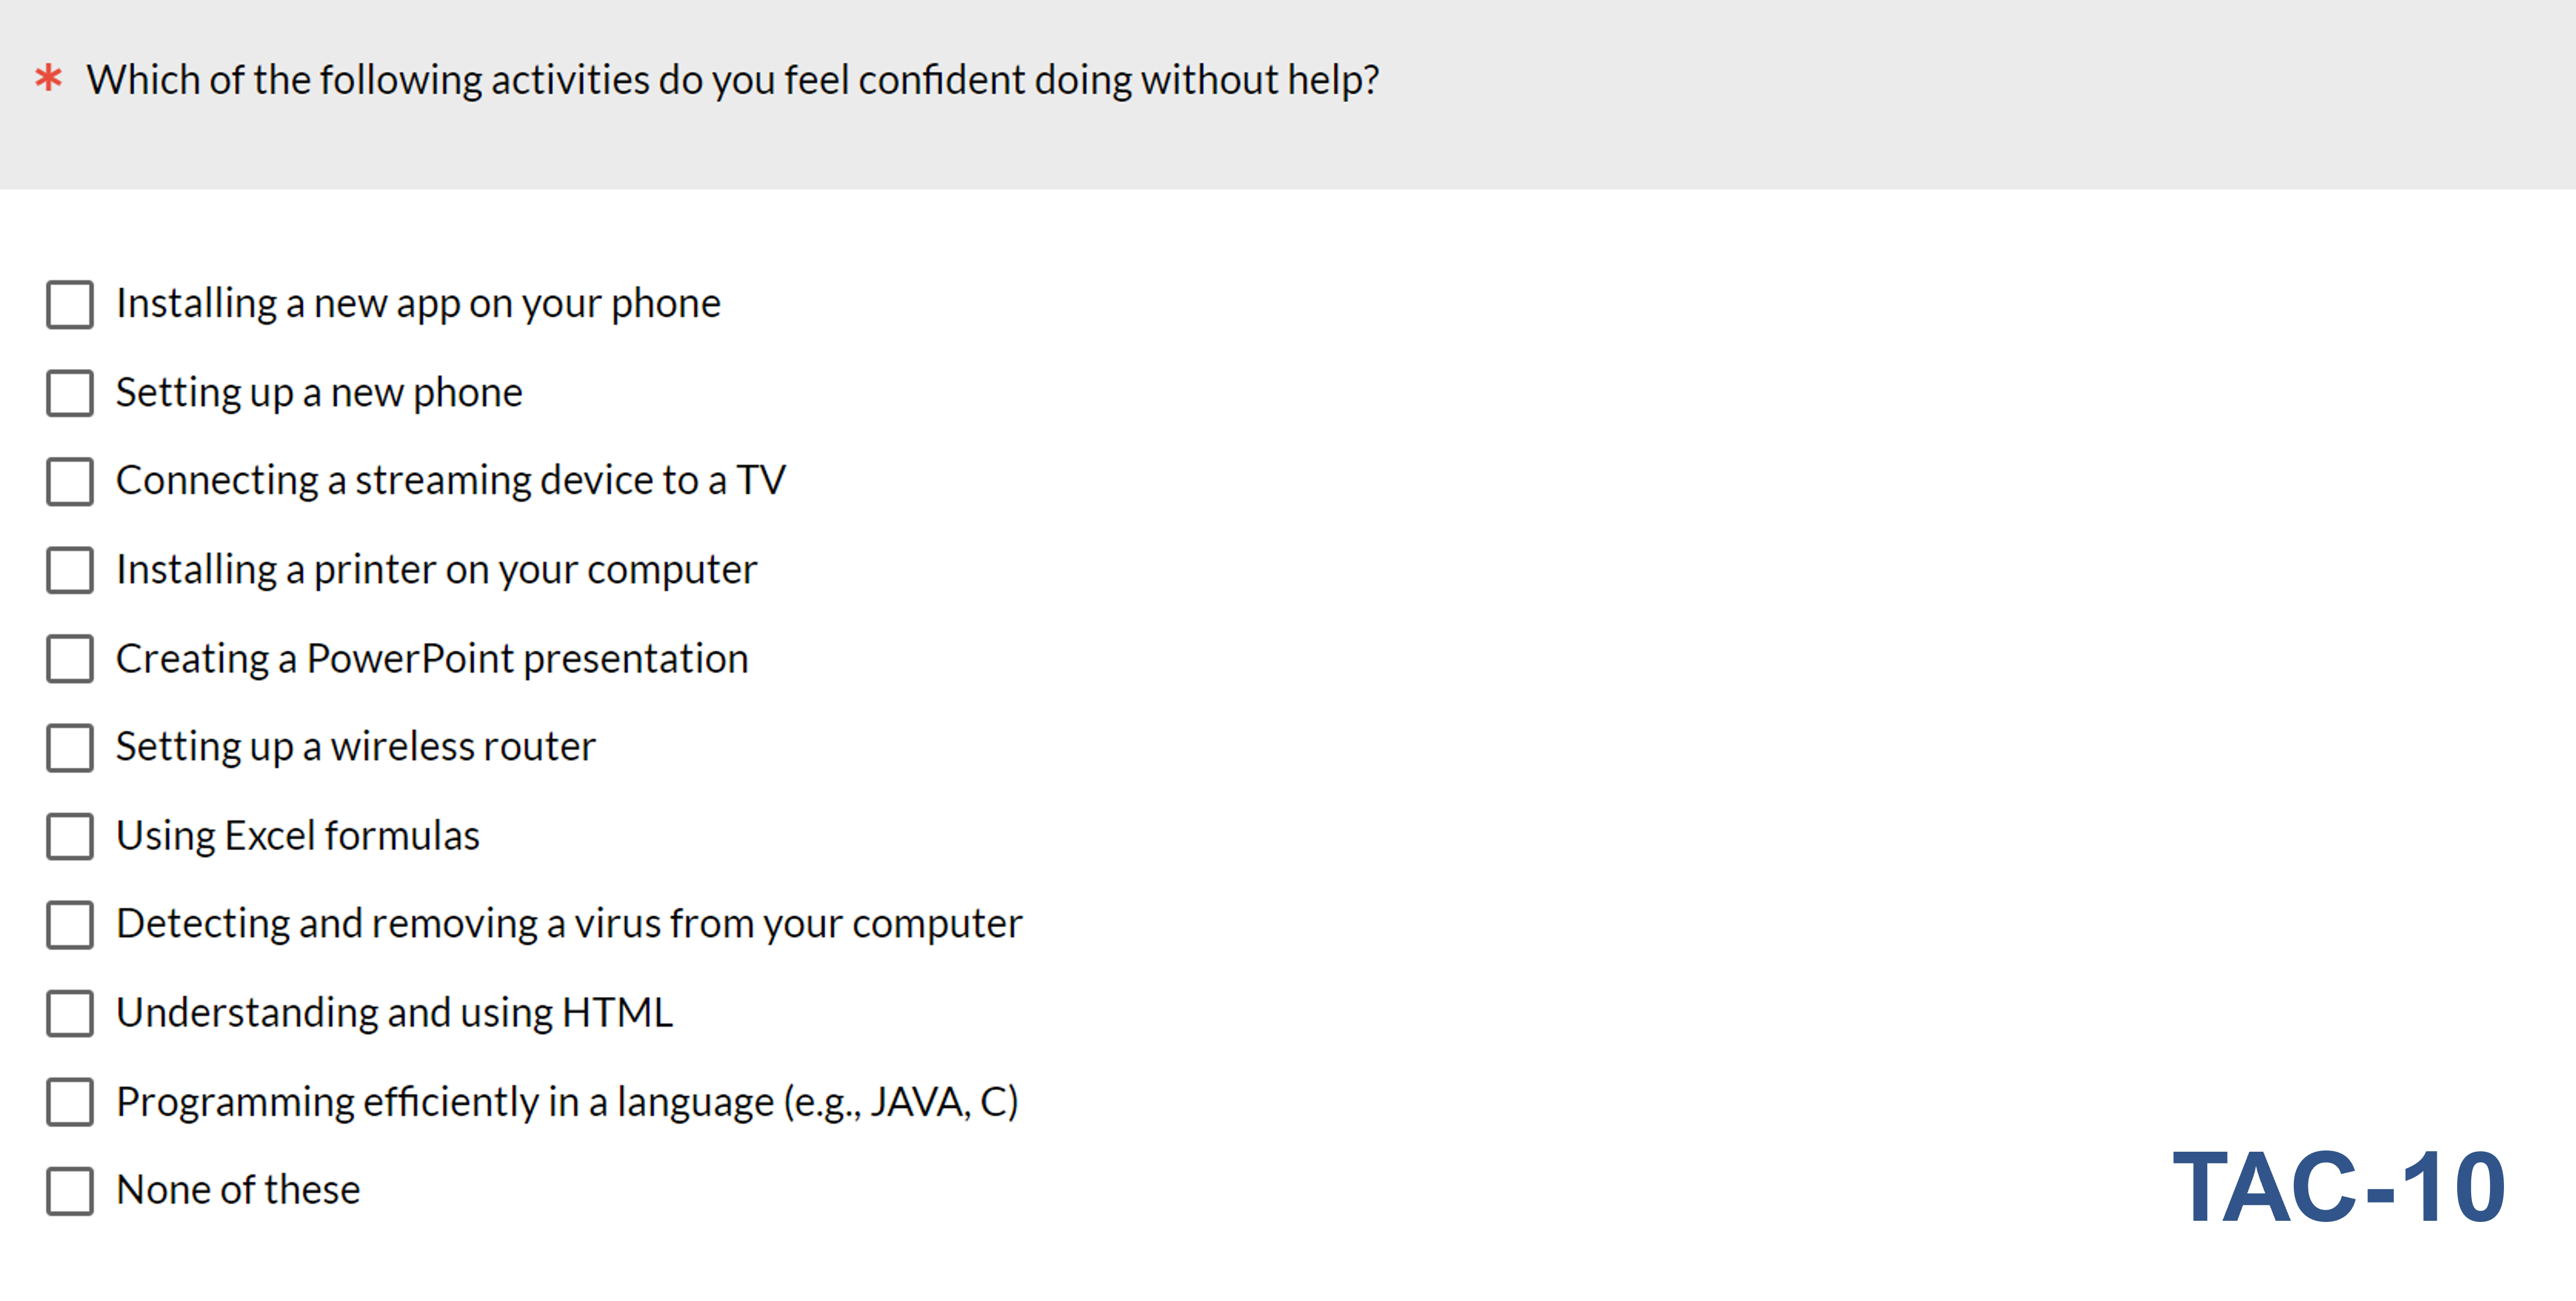
Figure 2: The TAC-10, created with MUiQ®.
For both versions, the score is the number of selections from the activity list, which can range from 0 to 9 for the TAC-9 and 0 to 10 for the TAC-10. Lower scores indicate lower levels of tech savviness.
Classification Schemes
We performed classifications separately for the TAC-9 and TAC-10.
TAC-9 Classification
As shown in Table 1, we developed two candidate methods for classification into two groups, two for classification into three groups, and one for classification into five groups. The goal for Two Groups Method A was to split the sample as close to 50–50 as we could; for Two Groups Method B, it was to adjust the split point to ensure the Low group was really low (based on inspection of the results from the usability studies).
| Score | % People | A | A% | B | B% | A | A% | B | B% | 5 Grp | 5 Grp% |
| 9 | 8.0% | High | 59.9% | High | 87.2% | High | 35.7% | High | 35.7% | Very High | 8.0% |
| 8 | 27.7% | High | High | High | High | High | 27.7% | ||||
| 7 | 24.2% | High | High | Medium | 41.5% | Medium | 51.5% | Medium | 41.5% | ||
| 6 | 17.3% | Low | 40.2% | High | Medium | Medium | Medium | ||||
| 5 | 10.0% | Low | High | Low | 22.9% | Medium | Low | 15.0% | |||
| 4 | 5.0% | Low | Low | 12.9% | Low | Low | 12.9% | Low | |||
| 3 | 4.2% | Low | Low | Low | Low | Very Low | 7.9% | ||||
| 2 | 2.0% | Low | Low | Low | Low | Very Low | |||||
| 1 | 1.2% | Low | Low | Low | Low | Very Low | |||||
| 0 | 0.5% | Low | Low | Low | Low | Very Low | |||||
Table 1: Candidate TAC-9 classification schemes.
For the Three Groups Method A version, the goal was to get as close as possible to 33% in each group. The strategy for the Three Groups Method B version was to maintain the low group from the Two Groups Method B version and get about 50% in the medium group, with the remaining percentage in the high group.
In the Five Groups version, the low group from the Three Groups Method A version was divided into low and very low groups, the medium group was unchanged, and the high group was divided into high and very high groups.
TAC-10 Classification
Slightly modifying the TAC-9 classification strategies, Table 2 shows candidate TAC-10 classification schemes.
| Score | % People | A | A% | B | B% | A | A% | B | B% | 5 Grp | 5 Grp% | |||||||||
| 10 | 7.7% | High | 48.1% | High | 86.3% | High | 23.0% | High | 48.1% | Very High | 7.7% | |||||||||
| 9 | 15.3% | High | High | High | High | High | 15.3% | |||||||||||||
| 8 | 25.1% | High | High | Medium | 48.1% | High | Medium | 48.1% | ||||||||||||
| 7 | 23.0% | Low | 51.9% | High | Medium | Medium | 46.1% | Medium | ||||||||||||
| 6 | 15.2% | Low | High | Low | 28.9% | Medium | Low | 15.2% | ||||||||||||
| 5 | 7.9% | Low | Low | 13.7% | Low | Medium | Very Low | 13.7% | ||||||||||||
| 4 | 3.2% | Low | Low | Low | Low | 5.8% | Very Low | |||||||||||||
| 3 | 1.9% | Low | Low | Low | Low | Very Low | ||||||||||||||
| 2 | 0.5% | Low | Low | Low | Low | Very Low | ||||||||||||||
| 1 | 0.2% | Low | Low | Low | Low | Very Low | ||||||||||||||
| 0 | 0.0% | Low | Low | Low | Low | Very Low | ||||||||||||||
Table 2: Candidate TAC-10 classification schemes.
We anticipated that TAC-9 and TAC-10 classification would work well for identifying two groups, might work well for three groups, but would probably not work as well for five groups due to TAC score range limitations and the difficulty obtaining sufficient sample sizes for the very low and very high groups.
Validating TAC-9 and TAC-10 Classification Levels
To explore different candidate methods for validating different levels of tech savviness, we returned to the four validation studies conducted between 2018 and 2022. Across the four studies, participants completed technical activity checklists and attempted a variety of technical tasks. The first two studies included the HTML activity (supporting evaluation of the TAC-9 and the TAC-10), and the latter two didn’t (supporting evaluation of only the TAC-9). More details on the studies are available in the earlier validation article.
Study 1: Four Very Difficult Online Tasks (2018)
The first study used 122 Mechanical Turk participants who attempted four relatively difficult tasks (Ruby, Processor, Findability, and Google Sheets) with an average task completion rate of only 34%.
We used ANOVA to analyze the TAC-9 and TAC-10 classification schemes with the average of participants’ successful completion rates across the four tasks as the dependent variable. The main effect of technical activity checklist classification was statistically significant (p < .01) for all classification methods (TAC-9 and TAC-10 for two, three, and five groups).
Study 2: Setting Up a Printer (2021)
We conducted a moderated usability study in which 38 participants attempted to set up a printer (the only task), with a mean successful task completion rate of 68%.
ANOVAs using classification method as the independent variable and success rate as the dependent variable were statistically significant for all classification methods (Table 3).
| Checklist | 2 A | 2 B | 3 A | 3 B | 5 Grp |
|---|---|---|---|---|---|
| TAC-9 | 0.003 | 0.05 | 0.03 | 0.02 | 0.09 |
| TAC-10 | 0.007 | 0.04 | 0.007 | 0.02 | 0.08 |
Table 3: Significance of ANOVA main effects of classification for TAC-9 and TAC-10.
Study 3: Using a Video Streaming Service (2021)
In our third study, 52 people participated in a moderated usability study in which they attempted six tasks with a video streaming service. The mean overall successful task completion rate was 85%.
Table 4 shows the significance levels for the various TAC-9 classification methods. In this study, the A versions for two and three groups were not statistically significant, but the B versions were, as was the five-group classification.
| Checklist | 2 A | 2 B | 3 A | 3 B | 5 Grp |
|---|---|---|---|---|---|
| TAC-9 | 0.68 | 0.03 | 0.12 | 0.02 | 0.04 |
Table 4: Significance of ANOVA main effects of classification for TAC-9 in Study 3.
Study 4: Social Media Content Creation and Consumption (2022)
In a remote unmoderated usability study of a platform for social media creation and consumption, 1,358 participants were assigned to one of four sets of tasks (Set 1: seven tasks with n = 221 and mean success rate of 44%, Set 2: five tasks with n = 239 and mean success rate of 61%, Set 3: two tasks with n = 446 and mean success rate of 36%, Set 4: five tasks with n = 452 and mean success rate of 48%; the overall mean across the four groups was 47%).
Due to the differences in this study for tasks included in each set, successful completion rates, and correlation with TAC-9, we included Set as a variable in the ANOVAs conducted to assess classification quality. This allowed us to check for any statistically significant interactions between the task sets in this study and the classification groups.
Analysis of interactions between success rates for task sets and TAC-9 classifications were not statistically significant, but the main effect of TAC-9 classification was statistically significant for all the methods (Table 5).
| Checklist | 2 A | 2 B | 3 A | 3 B | 5 Grp |
|---|---|---|---|---|---|
| TAC-9 | .009 | .002 | .004 | .008 | .025 |
Table 5: Significance of ANOVA main effects of classification for TAC-9 in Study 4.
TAC Classification Patterns
Just because many of the classification methods were statistically significant doesn’t mean the classification patterns produced the expected order (e.g., lower task success rates for lower TAC scores), so we analyzed this for all two-, three-, and five-group classifications.
Two Groups
Figure 3 shows the patterns of success rates for each two-group classification method for each study.
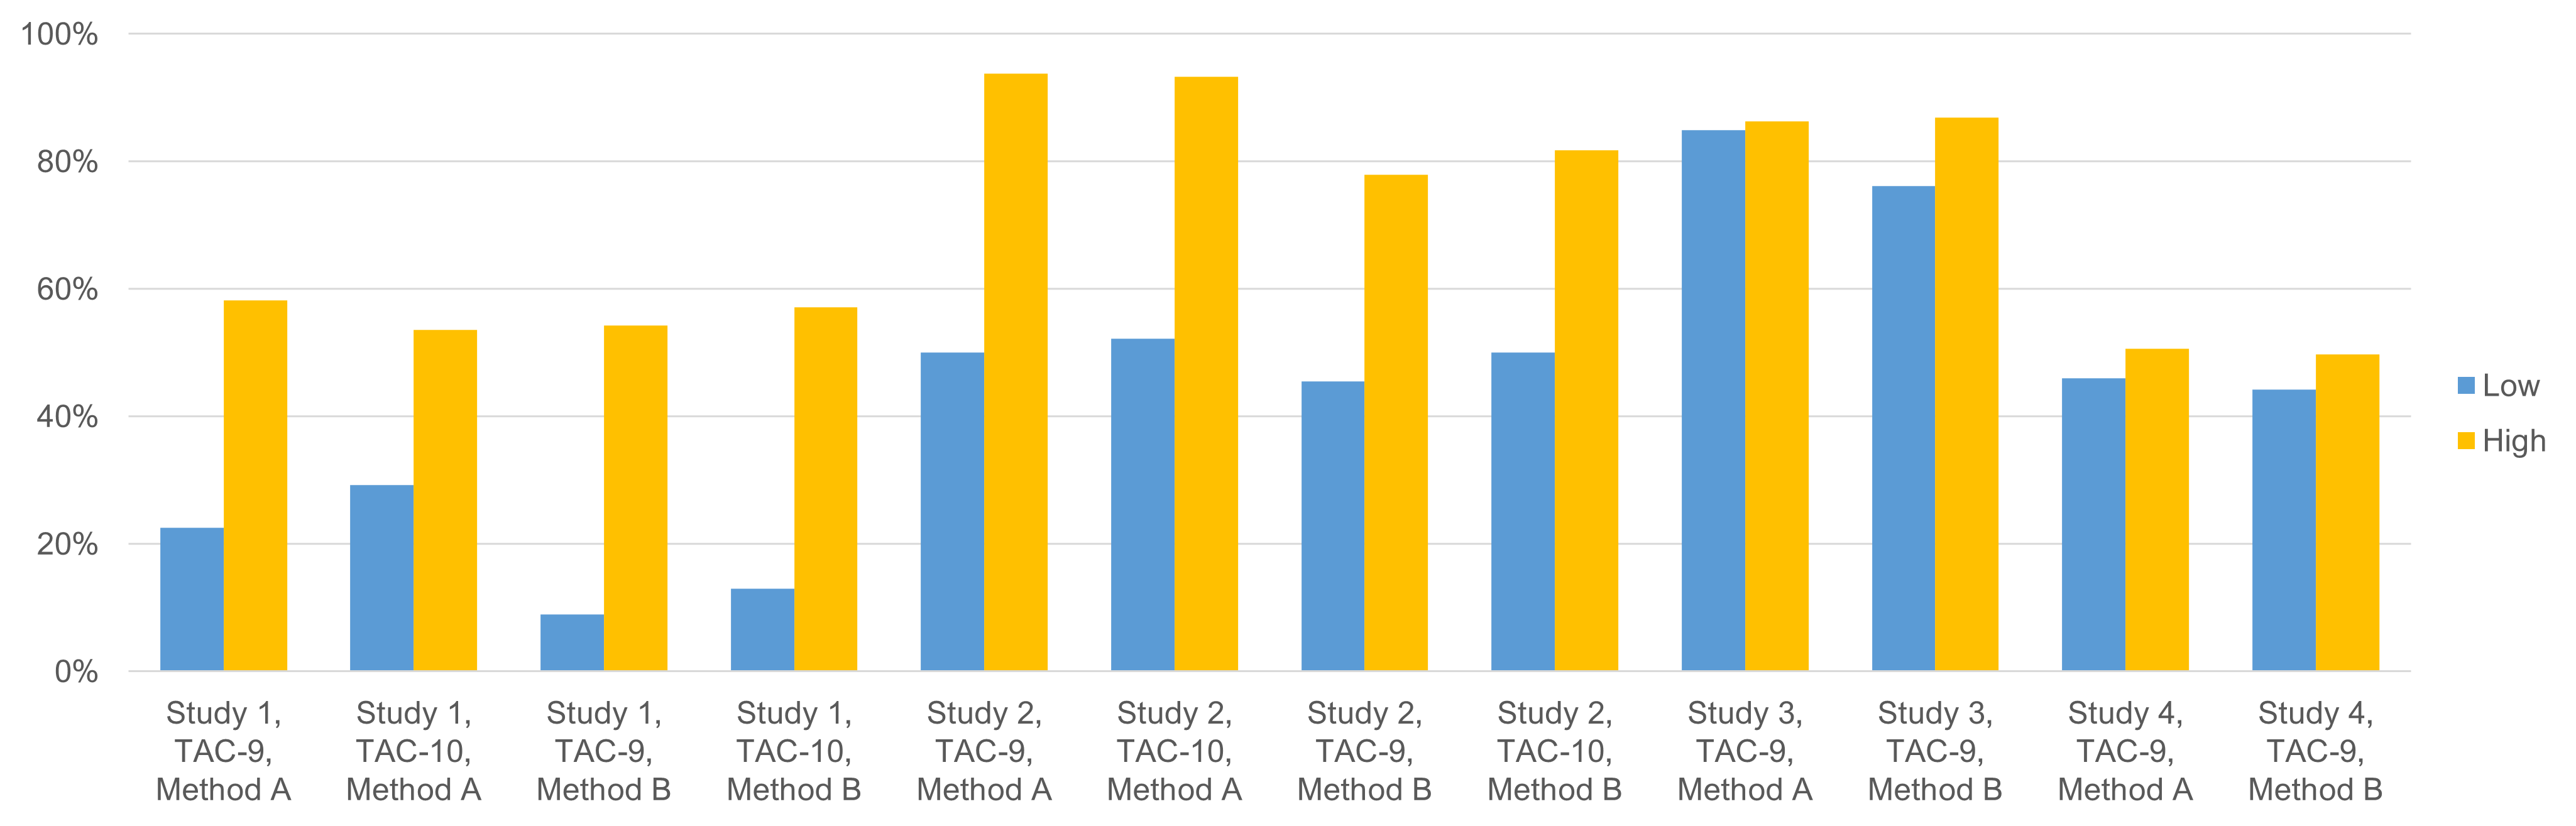
The patterns of successful completion rates matched the expected patterns for TAC classification into two groups, with close correspondence between TAC-9 and TAC-10 classifications. For each classification method, the Low group had a smaller percentage of successful task completions than the High group. These differences were statistically significant in all except one instance (Study 3, TAC-9, Method A).
Three Groups
Figure 4 summarizes the three-group classification patterns across methods and studies.

Overall, the three-group classifications were not as consistent as the two-group classifications, with deviation from the expected pattern for Method A in five of six cases (the exception was Study 2, TAC-9). Method B, however, matched the expected pattern in five of six cases (the exception was Study 1, TAC-9). In Study 2, TAC-9 and TAC-10 Method B had identical classification patterns. TAC-10 Method B produced the expected pattern in both studies where it was used.
Five Groups
The five-group classification patterns are shown in Figure 5.
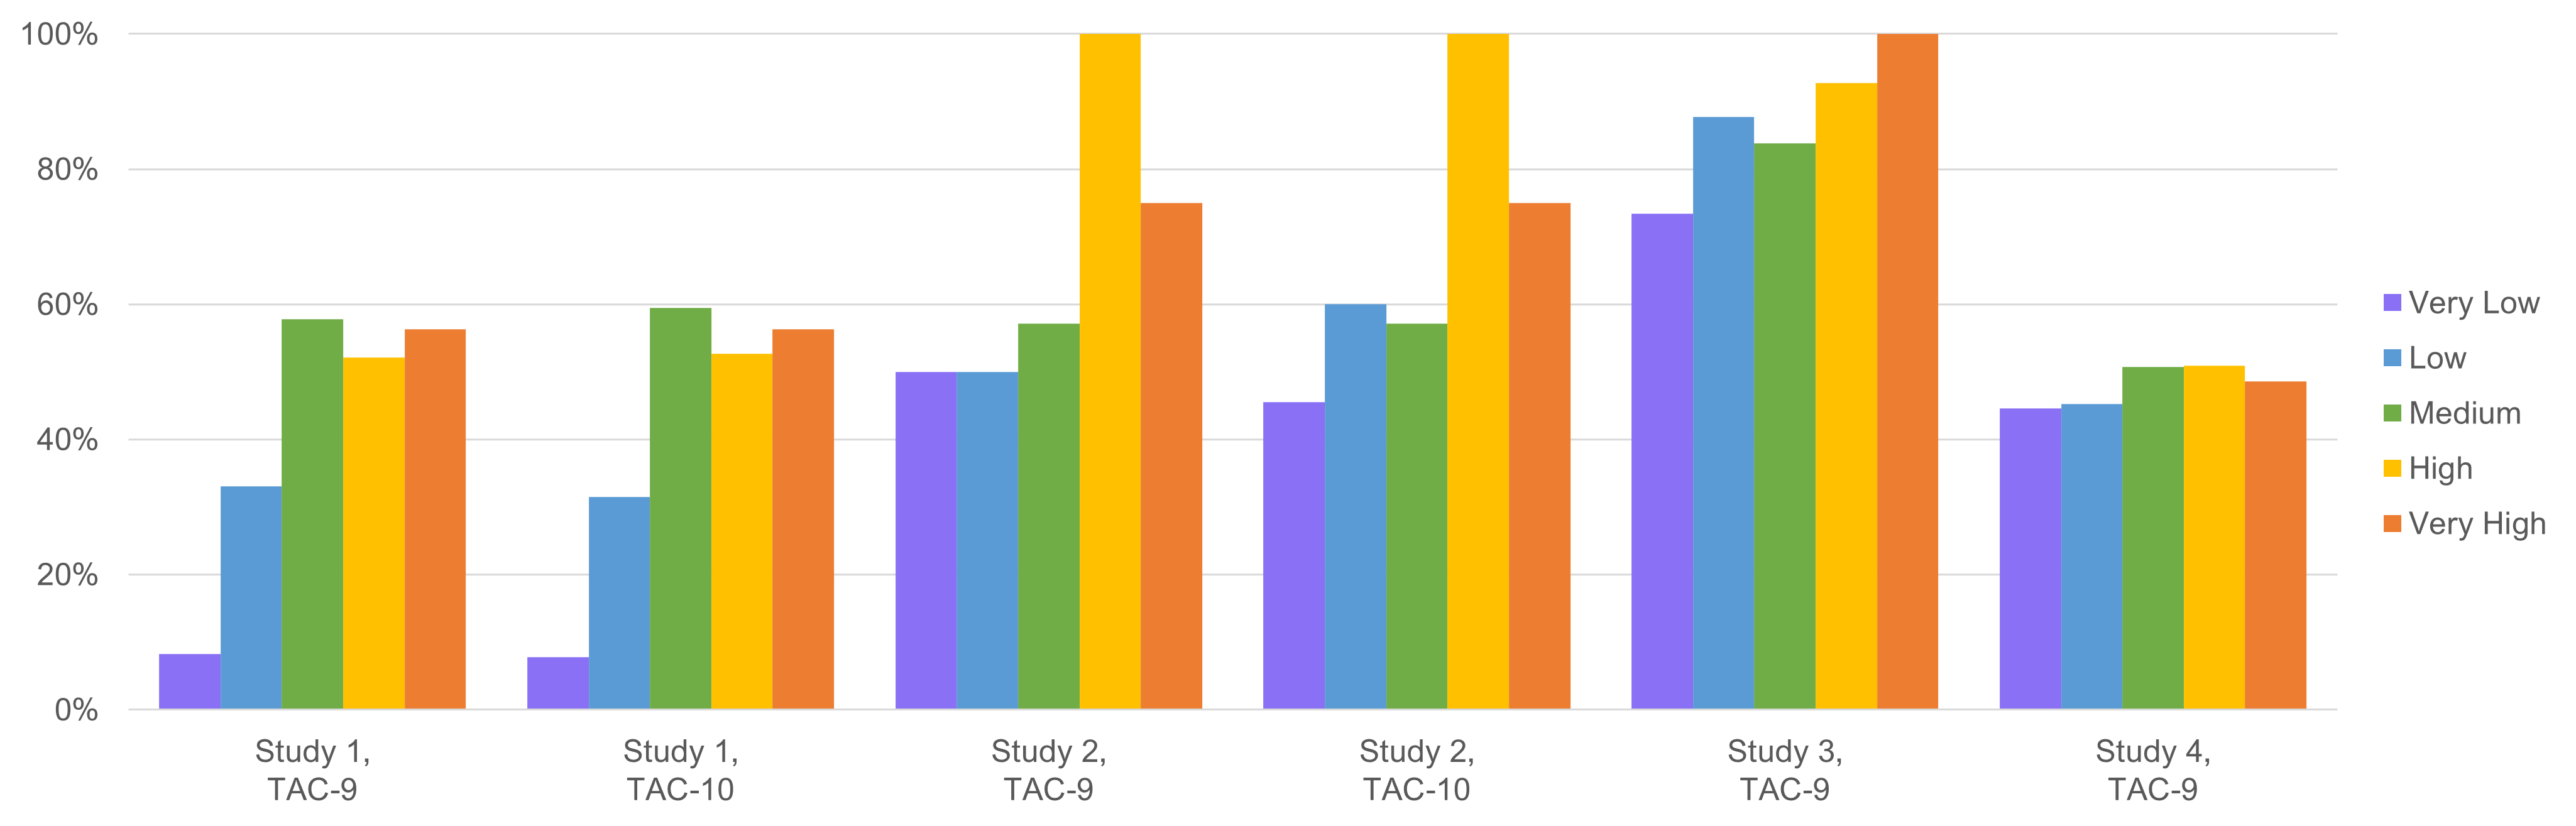
The patterns for five-group classification were in roughly the desired order, but with at least one discontinuity for each classification method. Once again, where they were both used, the TAC-9 and TAC-10 classification patterns were similar.
Discussion and Summary
Our analysis of technical activity checklist (TAC) scores to classify participants into tech-savvy groups found that:
TAC-9 and TAC-10 scores worked very well for classification into two groups (low and high tech-savvy). Across these analyses, TAC-9 and TAC-10 classifications were statistically significant in 11/12 two-group classifications (the exception was TAC-9 Method A in Study 3). In every case, the mean successful completion rate for the low group was less than the mean for the high group.
TAC-9 and TAC-10 scores worked reasonably well for classification into three groups (low, medium, and high tech-savvy). Classification into three groups was not as consistently accurate as classification into two groups. Three-group classification with Method B was better than classification with Method A. Classification with TAC-10 Method B worked very well in the studies where it could be analyzed (Studies 1 and 2).
We do not recommend using TAC-9 or TAC-10 for classification into five groups. Classification patterns for five groups were roughly in the correct order, but given that there was at least one discontinuity for each method, we do not recommend extending classification from three to five groups.
Having good results for two- and three-group classification for each of the four validation studies is encouraging given the methodological variation in those studies. Two were moderated usability studies (Studies 2 and 3), and two were remote unmoderated usability studies (Studies 1 and 4). Study 2 was a usability study of hardware setup and wireless connection to a computer, while the other three studies touched on different aspects of digital usability (a broad variety in Study 1, a streaming service in Study 3, and social media content creation/consumption in Study 4). There was also a wide range of task difficulty across the studies, as indicated by overall successful task completion rates (Study 1: 34%, Study 2: 68%, Study 3: 85%, Study 4: 47%).
Considering all results, we recommend using TAC-10 Method B for tech-savvy classification. TAC-10 Method B worked very well for classification into two groups and into three groups in Studies 1 and 2. Even though TAC-10 wasn’t used in Studies 3 or 4, its similarity to the TAC-9 classifications in Studies 1 and 2 indicates that the classification adjustments made due to adding HTML to the activity set had little effect on the groups into which individuals were placed, and in one case (Study 2, Method B), the TAC-9 and TAC-10 classification decisions were identical. Also, the use of TAC-10 over TAC-9 is recommended by our previously reported Rasch analyses. See Table 6 for the recommended TAC-10 classifications.
| Two Groups | Low | High | |
| Checklist Scores | 0 – 5 | 6 – 10 | |
| Three Groups | Low | Medium | High |
| Checklist Scores | 0 – 4 | 5 – 7 | 8 – 10 |
Table 6: Recommended TAC-10 classifications for two and three levels of tech savviness.


