 UX research is geared primarily toward understanding how to improve the experience of products, websites, and software. The intent is not to assess people but to use people to assess product experiences.
But people’s ability to solve technical problems—what we often loosely refer to as tech savviness—can confound our research findings. That is, including only technically savvy people in our product research may mask problems that less tech-savvy people will have.
Conversely, including only those with low levels of tech savviness may uncover problems that won’t encumber most users. Consequently, it’s important to measure tech savviness as a covariate in UX research. But how do you measure tech savviness?
Earlier, we published an article on different ways you might measure tech savviness, including assessing
- What someone knows
- What someone does (or reports doing)
- What someone feels (attitudes, especially self-assessments)
We have also published articles that describe our multi-year program of investigating these different candidate measures of tech savviness:
In this article, we use Rasch analysis to understand the measurement properties of three versions of a technology activity checklist that we have used to measure tech savviness; one with sixteen activities, one with nine, and one with ten.
MeasuringU Technical Activity Checklist (TAC)
Since 2015, researchers at MeasuringU have experimented with different sets of activities that vary widely in technical difficulty, presented in select-all-that-apply checklists, to explore the feasibility of this method as a measure of tech savviness. We’ve gone through various versions, removing redundant items and adding other items to fine-tune the general method we refer to as the MeasuringU Technical Activity Checklist (TAC™).
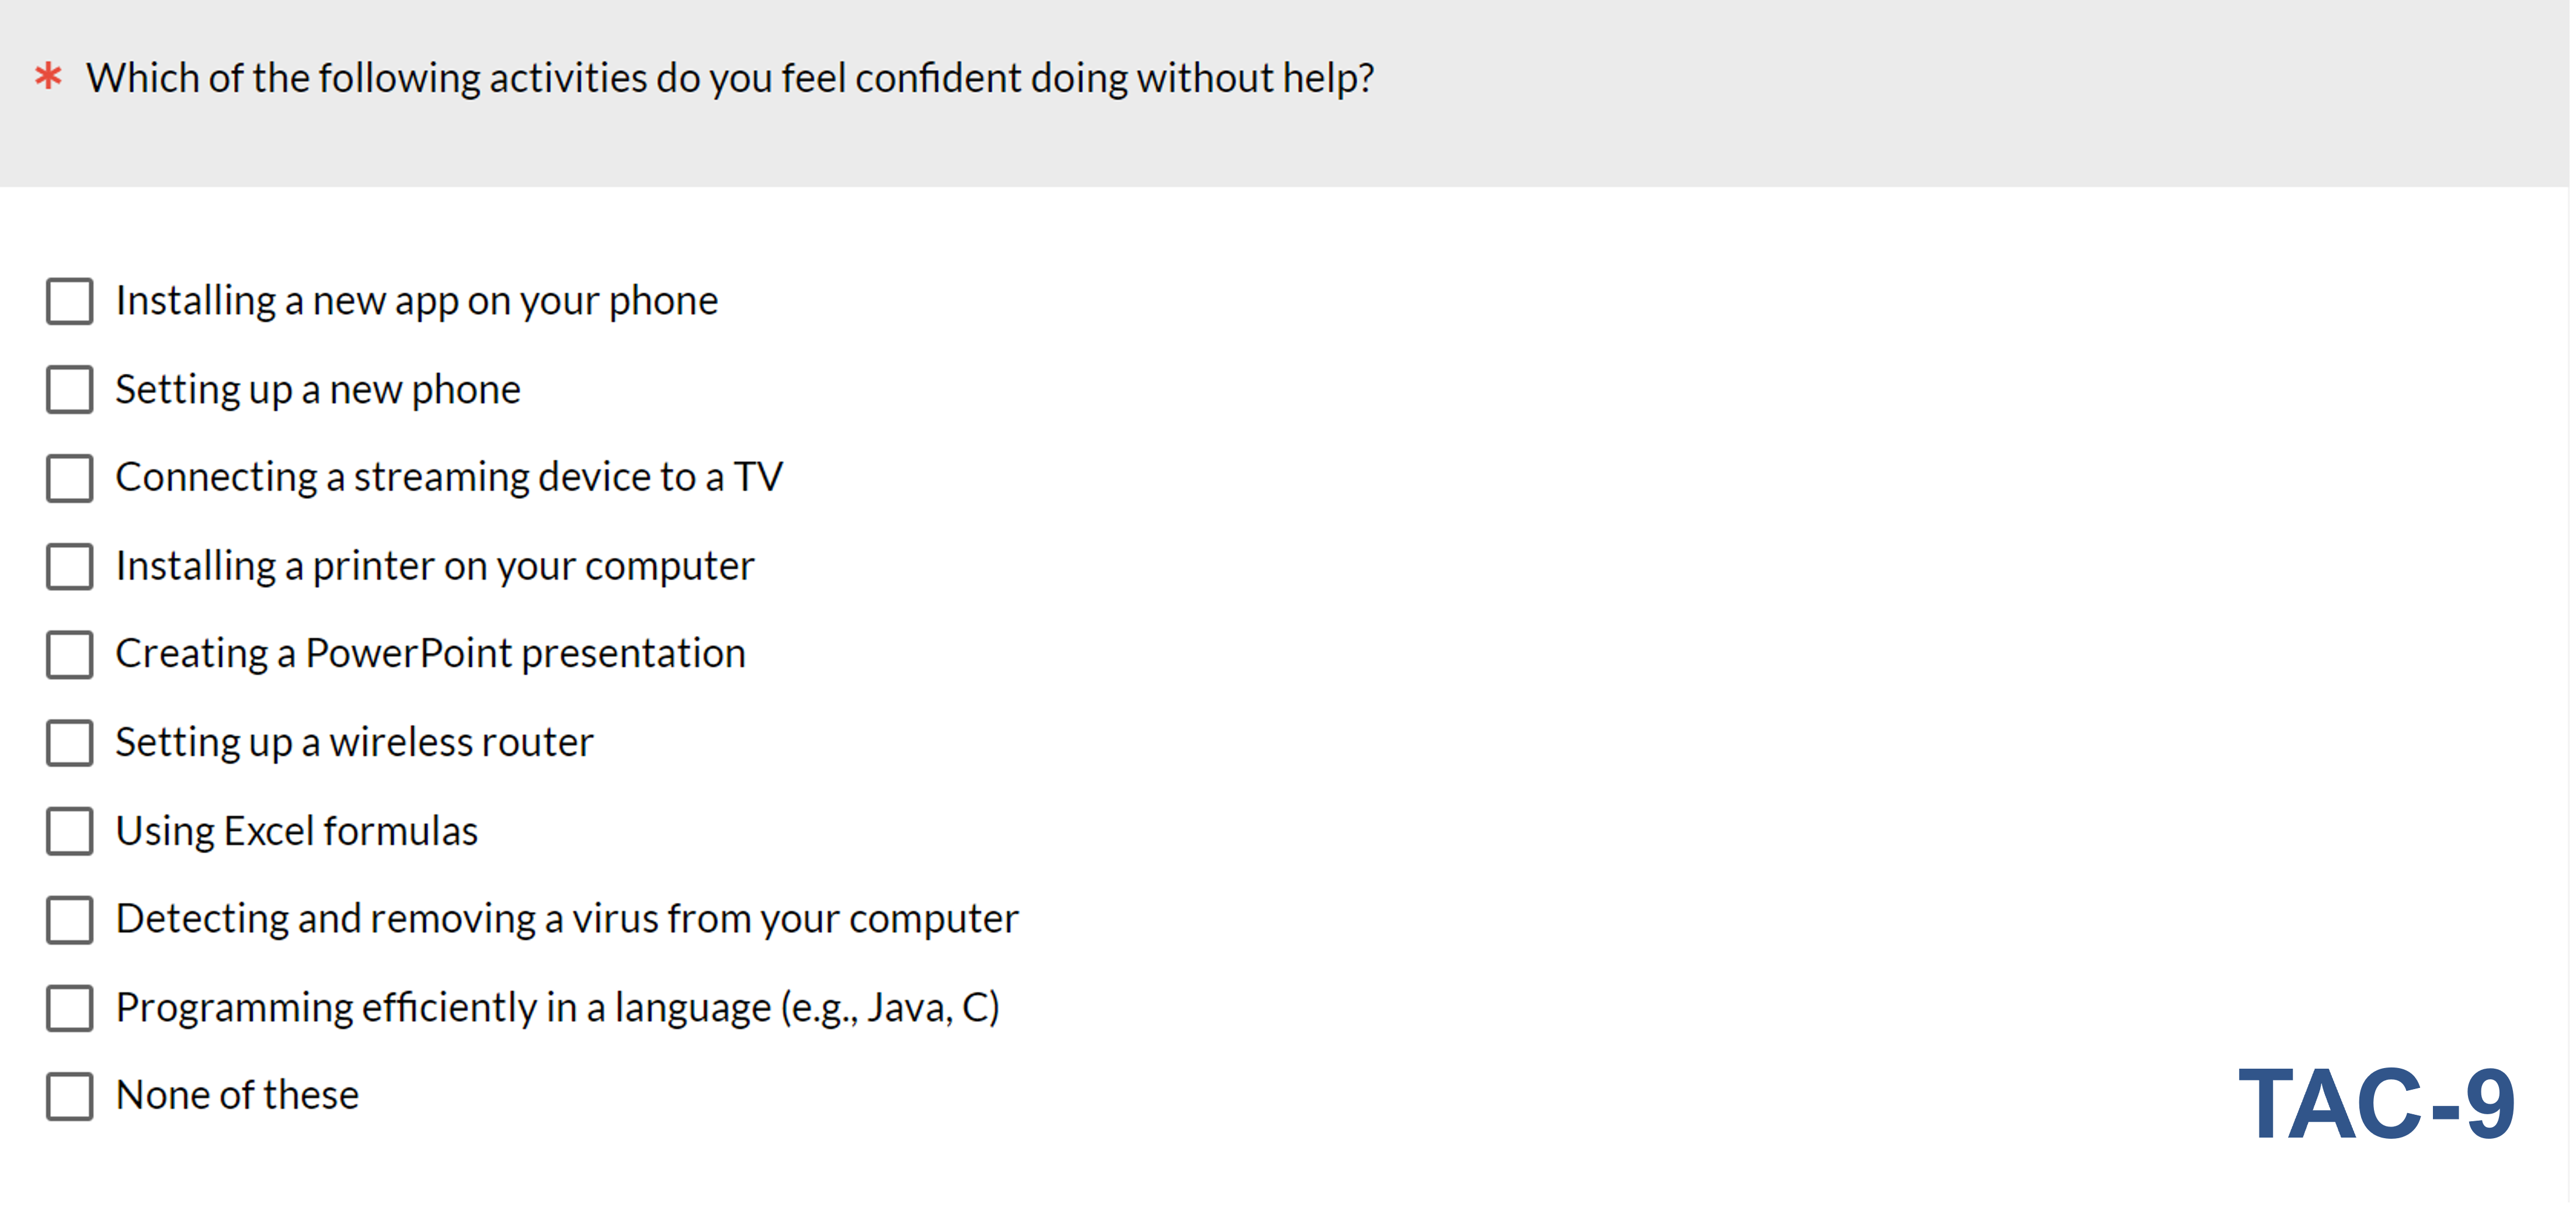
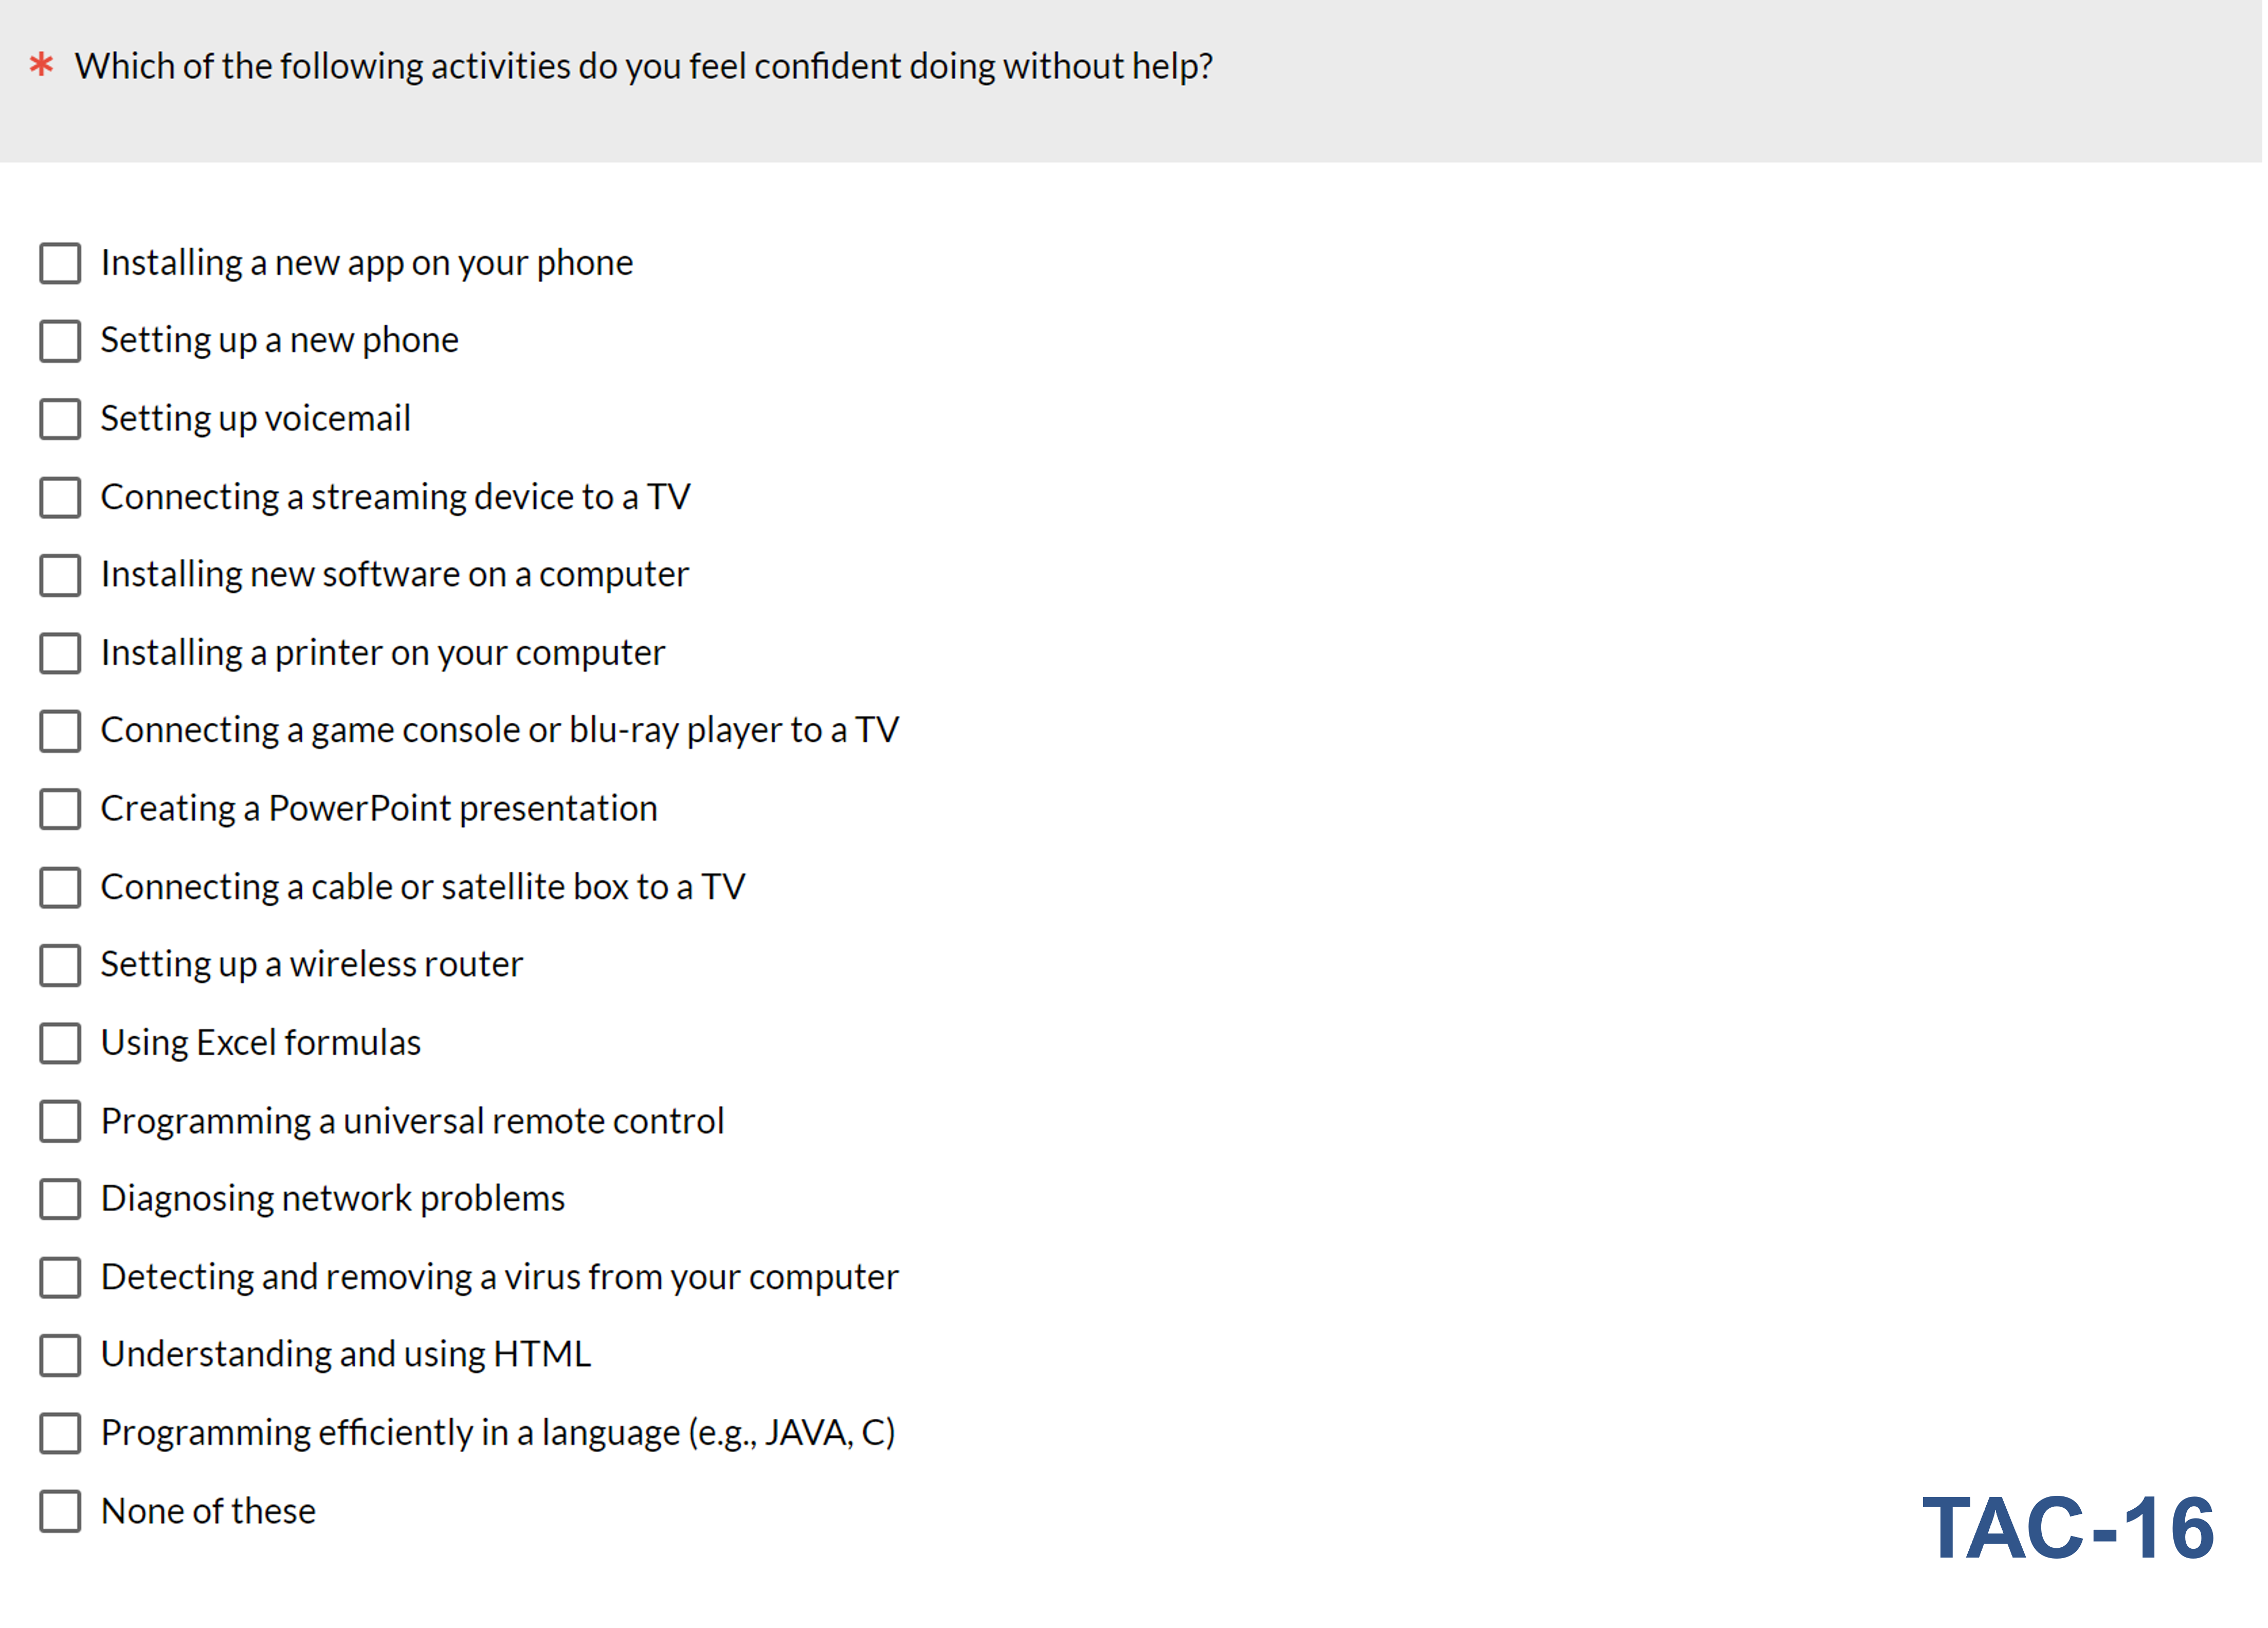
For specific versions of the TAC, we append the number of activities in the checklist after “TAC.” For example, Figure 1 shows the TAC-9, which is the version we have used the most since 2018. The TAC-9 is derived from the TAC-16, a longer version shown in Figure 2. The activities in the figures are arranged from top to bottom by our best estimates of their selection frequency (Table 1), which we assume reflects the different levels of tech-savviness needed to do them confidently without help. For example, it’s relatively easy to install a new app on a phone (typical selection frequency over 90%), but very difficult to be an efficient programmer in languages such as Java or C (typical selection frequency less than 20%). In practice, we randomize the order of presentation and include a “None of these” option that always appears at the bottom of the list.
| Task | Percent Selection |
|---|---|
| Installing a new app on your phone. | 99% |
| Setting up a new phone. | 97% |
| Setting up voicemail. | 96% |
| Connecting a streaming device to a TV. | 95% |
| Installing new software on a computer. | 93% |
| Installing a printer on your computer. | 92% |
| Connecting a game console or Blu-ray player to a TV. | 88% |
| Creating a PowerPoint presentation. | 87% |
| Connecting a cable or satellite box to a TV. | 82% |
| Setting up a wireless router. | 80% |
| Using Excel formulas. | 67% |
| Programming a universal remote control. | 63% |
| Diagnosing network problems. | 62% |
| Detecting and removing a virus from your computer. | 59% |
| Understanding and using HTML. | 37% |
| Programming efficiently in a language (e.g., Java, C). | 12% |
Table 1: Estimated selection frequencies of 16 technical activities (n = 4,731).
Analyses of the TAC-16, TAC-9, and TAC-10
We recently collected a large sample of completed checklists using the TAC-16 as part of a screening survey (n = 4,731), and in combination with the screening survey and a large-scale survey, an even larger sample size for the TAC-9 (n = 6,089).
With that data, we used Rasch analysis to create 16- and 9-activity models (TAC-16 and TAC-9), represented as the Wright maps shown in Figure 3. The Wright map is a critical visualization in Rasch analysis, putting item difficulty and person scores computed from a set of data on a common logit (log odds) scale. Item retention/exclusion decisions are made based on the extent to which items cover a good range of difficulty without overlap or large gaps as represented on the Wright map.
The 16-activity map shows clear separations for the upper (difficult) and lower (easier) activities, respectively, programming efficiently and installing a phone app. From the bottom up, the following groups of activities are in about the same place on the 16-activity Wright map (the items that were not part of the TAC-9 are struck through):
- Setting up voicemail
- Setting up a new phone
- Connecting a streaming device to a TV
- Installing new software on a computer
- Creating a PowerPoint presentation
- Connecting a game console or Blu-ray player to a TV
- Connecting a cable or satellite box to a TV
- Setting up a wireless router
- Detecting and removing a virus from your computer
- Diagnosing network problems
- Programming a universal remote control
- Using Excel formulas
Thus, the distribution of activities on the Wright map in Figure 3 generally supports our less-formal historical analyses in which respondents selected variables at about the same frequencies. The only questionable decision was removing the HTML activity from the list, which is positioned between “detecting/removing a computer virus” and “programming efficiently” without being very close to either. This issue is visible in the Wright map for the TAC-9, which shows a reasonable distribution of activities on the logit scale except for the large gap between detecting/removing a computer virus and programming efficiently.
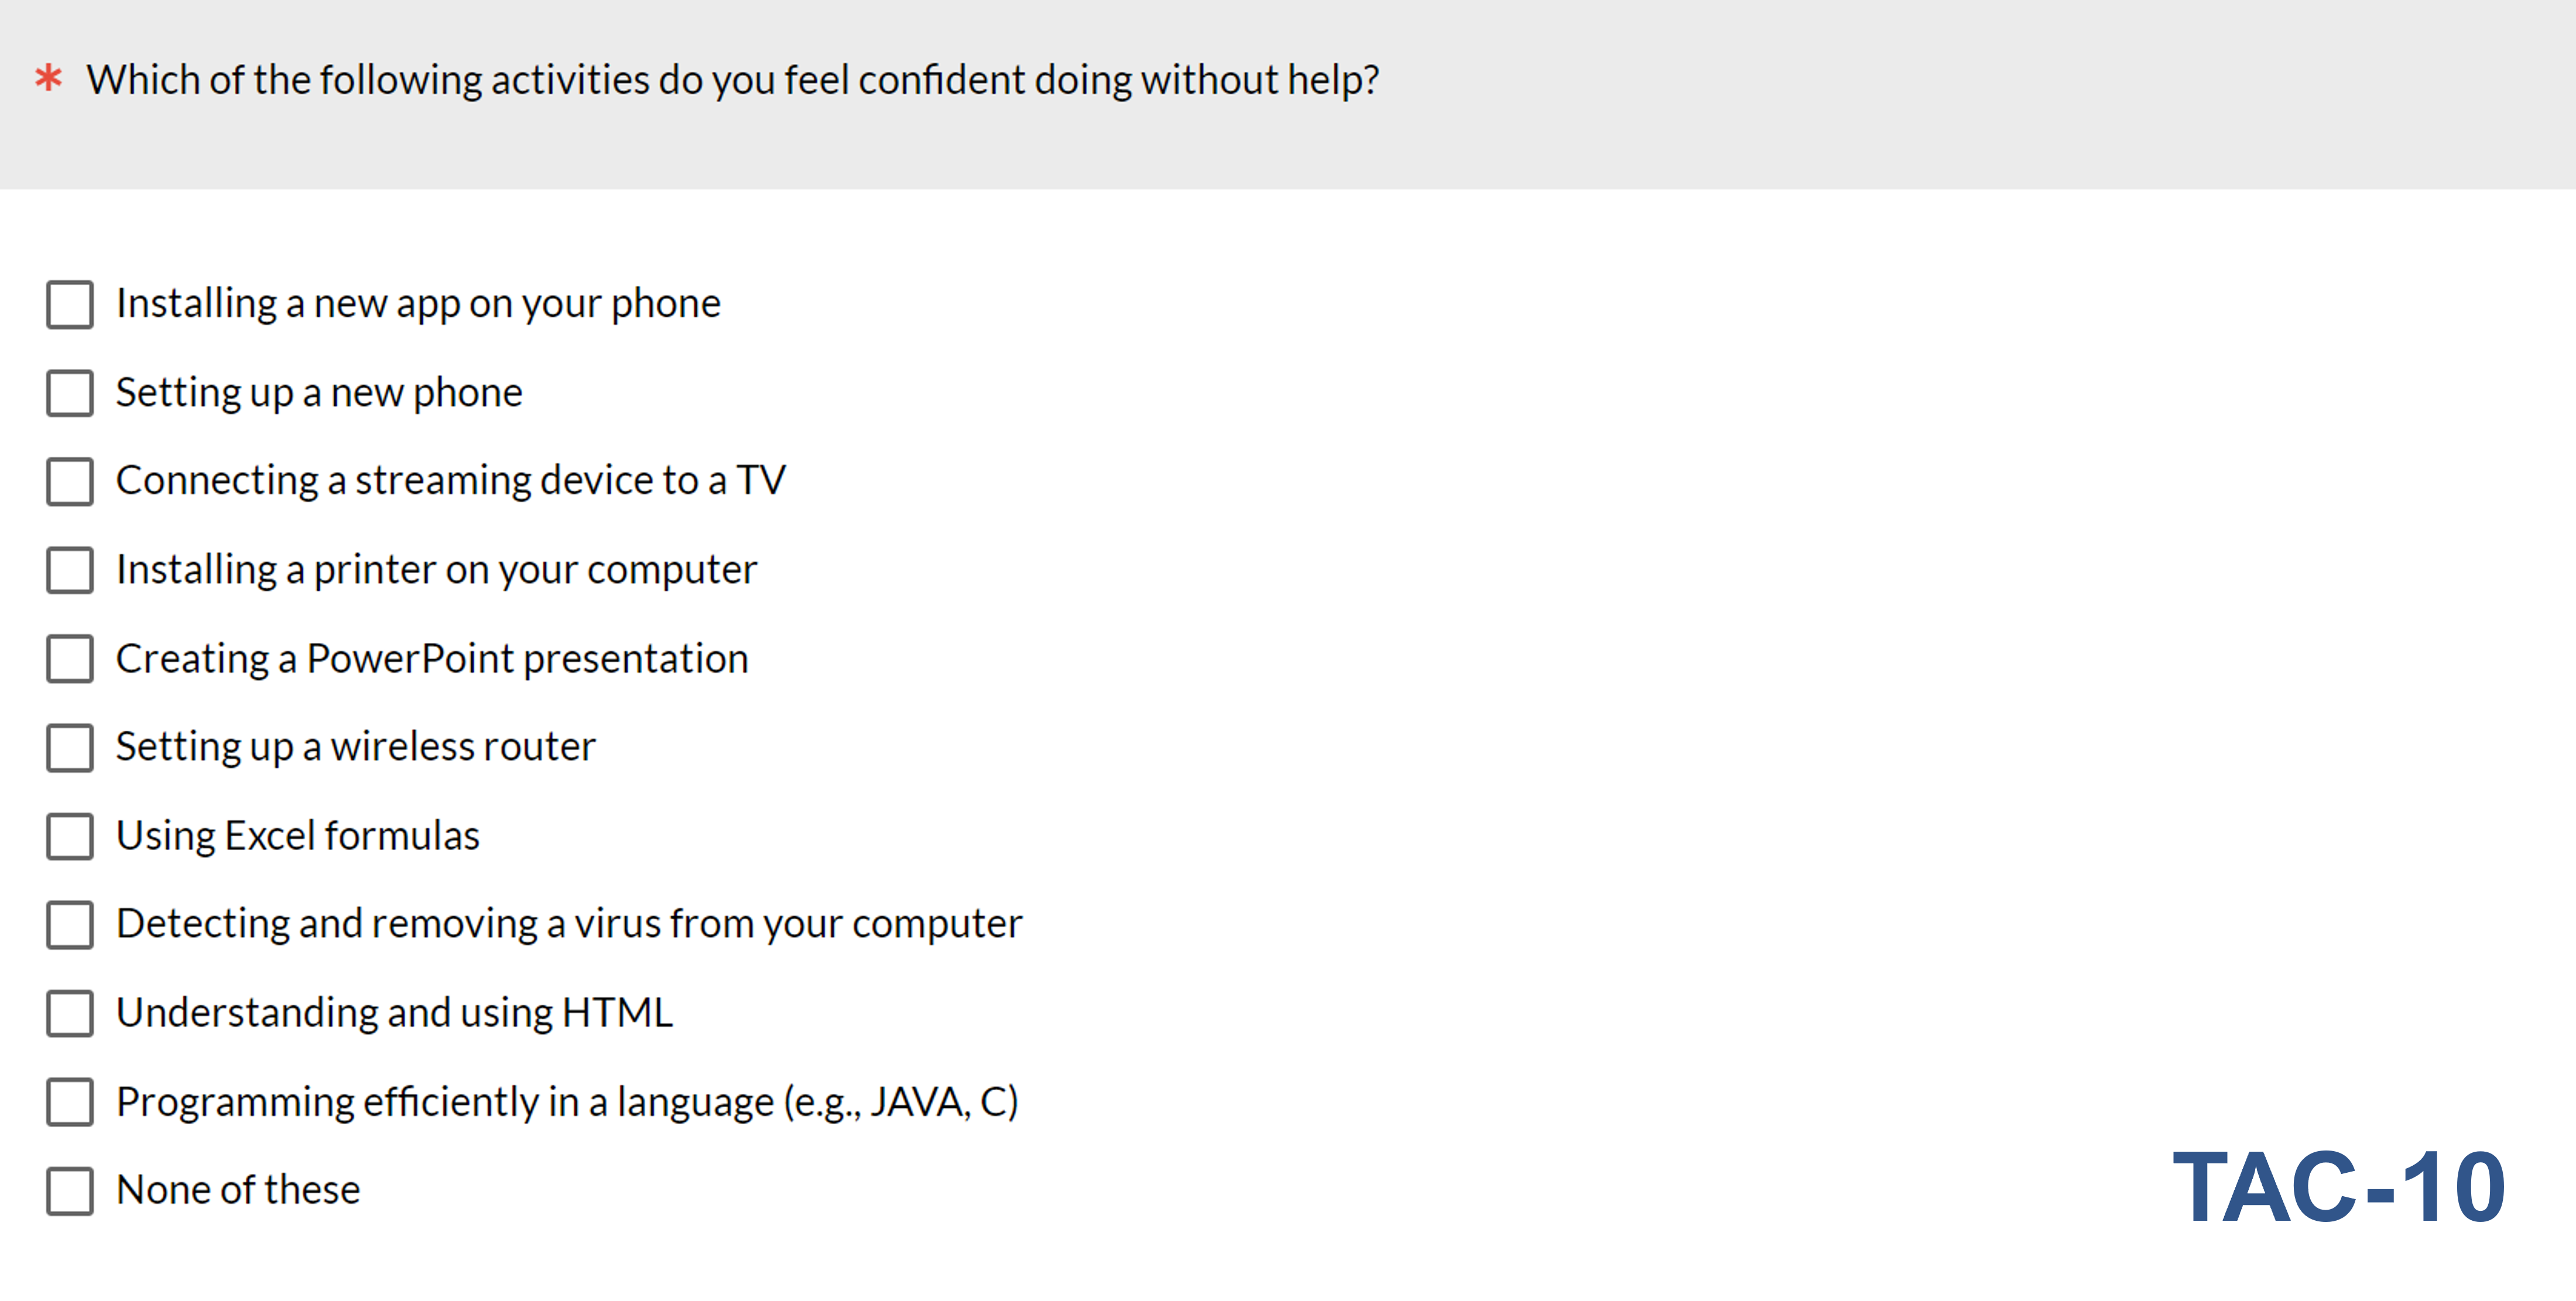
To get a sense of whether the TAC would benefit from restoring “Understanding and using HTML” (thus making the new TAC-10 version), we used the data from the screening survey to model the nine activities in TAC-9 plus the HTML activity. Inspection of the TAC-10 Wright map in Figure 3 indicates that the HTML activity would help to fill the gap. Figure 4 shows the TAC-10 version of the checklist.

Discussion and Summary
In this article, we’ve described the use of Rasch analysis to produce Wright maps for analysis of the measurement properties of three versions of a technical activity checklist used to measure individual tech savviness. The key takeaways are
The TAC-16 is comprehensive but inefficient. An important part of unidimensional scale standardization is to ask as many questions as you need to get a good measurement, but no more than that. The selection frequencies and Wright map of the TAC-16 showed numerous opportunities to remove activities from that checklist without affecting the breadth of the scale, which covers about 87% of the possible range of the scale as long as it includes the easiest and hardest items (respectively, installing a new app on your phone and programming efficiently in a language such as Java or C).
The TAC-9 is concise but has a completeness issue. The TAC-9 does a good job of measuring a wide range of tech savviness with less redundancy than the TAC-16. As shown on the Wright map for the TAC-9, however, there is a large gap on the logit scale between detecting/removing a computer virus and programming efficiently.
The TAC-10 has the best balance between conciseness and completeness. The Wright map for the TAC-10 shows that including the activity “Understanding and using HTML” should work well to fill the gap in the TAC-9 between detecting/removing a computer virus and programming efficiently, making it our currently preferred version of the TAC for practical use.
TACs could be used to identify some types of careless or dishonest respondents. Response patterns on a TAC generally start with the easiest activity and stop somewhere before the hardest one, except in those relatively rare cases where someone selects all the activities. Other types of response patterns can be indicative of response carelessness or dishonesty. For example, respondents who indicate they are confident programming efficiently in Java but are not confident installing an app on their phone should raise a red flag.
Future research is planned. The most important next step in this research program is to validate the TAC by checking to see how strongly it is associated with actual performance of technical tasks. We have several sets of data from task-based usability studies in which participants completed the TAC-9, and in two of those, participants completed the TAC-16, so we will be able to also validate the TAC-10 (because it’s a subset of the TAC-16) to see whether it is any better than the TAC-9 in practice. Stay tuned.
