
To have loyal customers you need satisfied customers. But is satisfaction enough to gain loyalty?
Some argue that you need more than satisfaction. You need to consistently exceed expectations and delight your customers to generate loyalty.
However, others have argued that instead of worrying about delighting customers, minimizing the effort customers need to expend to do business with you will lead to loyalty.
And meeting expectations and reducing effort is the inspiration behind a measure called the Customer Effort Score (CES). Like the Microsoft NSAT score, it’s less well known and used than the ubiquitous Net Promoter Score, but it’s still used by a number of organizations, and you may encounter it in your UX work.
Here are ten things to know about the CES:
1. Stop trying to delight your customers. The CES was introduced as a single-item measure in 2010 in the Harvard Business Review (HBR) with the provocative headline “Stop Trying to Delight Your Customers.” Sound similar to another single-item measure? The general idea behind the CES is that people will continue to do business with a company not because of delightful experiences or having their expectations exceeded, but because companies deliver on what they said they would do: a better product or experience. The authors argue it’s the effort customers have to expend that matters when generating loyal customers.
2. It’s validated via customer support interactions. In the HBR article, the authors describe a validation study with data from 75,000 customers who had contacted (by phone or online) a number of B2B and B2C companies. They reported that 84% of customers’ expectations had not been exceeded during their most recent interactions. Furthermore, they reported that 20% of the “satisfied” customers said they intended to leave the company in question, and 28% of the “dissatisfied” customers intended to stay. The authors use this as evidence that satisfaction isn’t a good predictor of loyalty. Importantly, the validation data was based only on customers who interacted with a company, making their findings mostly applicable to service companies or customer support departments, but likely less generalizable to all experiences (purchase and usage).
3. Is it a better predictor of loyalty? In the HBR article, the CES was reported as better than both satisfaction and the NPS at predicting measures of customer loyalty (e.g., intent to repurchase, increase spending). The authors report, “for the customers who reported low effort, 94% expressed an intention to repurchase, and 88% said they would increase their spending. Only 1% said they would speak negatively about the company. Conversely, 81% of the customers who had a hard time solving their problems reported an intention to spread negative word of mouth.” Unfortunately, the authors were short on details (a common issue with HBR articles) so it’s unclear what the corresponding values were for satisfaction and the Net Promoter Score to gauge the CES’s superiority.
4. It’s originally based on a single five-point item. Like the NPS and Microsoft NSAT, the CES was originally based on responses to a single item: “How much effort did you personally have to put forth to handle your request?” where 1 was very low effort and 5 was very high effort (see figure below). A score was the average from all respondents; lower scores were better (less perceived effort).
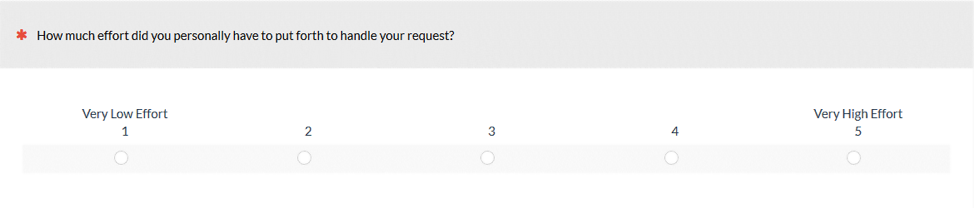
In general, when using only a single item, having more points of discrimination will improve the reliability, and to some extent, the validity (usually predictive ability). So having only five points offered minimal, although likely adequate, discriminating power.
5. The scale and scoring changed to a seven-point item. The company that funded the original research was purchased by the Gartner Group. Since its original publication, the CES scale has transformed into a seven-point agreement/disagreement scale and scored differently. Interestingly, the item wording itself has also changed and no longer even includes the word “effort.” Below is the “new and improved scale” and the new way to score it.
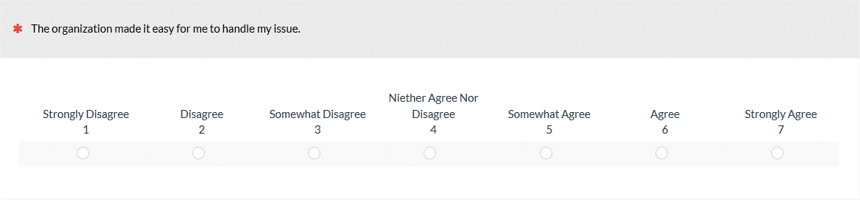
Gartner advises to add all those who agree (5, 6, and 7) and divide by the total number of respondents. In short, it’s a top-three-box score. However, others still report the mean score and apparently others use different numbers of points and questions, making comparability murkier for the CES.
6. There’s little corroborating data CES is better than the NPS or satisfaction at predicting retention. The authors made some bold claims that the CES was better than the NPS and satisfaction at predicting loyalty measures but provided little supporting data. In an independent study, de Haan et al. (2015) compared the Net Promoter Score, the CES (original five-point version), and a satisfaction item to see which predicted two-year retention better. They analyzed data from 6,649 Dutch respondents on 93 Dutch firms across 18 industries. They found top-two-box satisfaction had the highest correlation with two-year retention (r = .184), which was very similar to the NPS (r = .170). However, they found the CES was a terrible predictor and actually had a negative correlation (r = -.073) with two-year retention. It’s one study, but not an encouraging result for corroborating the predictive validity of the CES.
7. Applicability is more limited. The original HBR article is full of examples where reducing customers’ effort improved business metrics, such as number of calls to support. But by its very definition the CES focuses on an interaction, usually a support interaction with a company. And the authors note “our research focused exclusively on contact-center interactions.” A lot of customers never interact with a brand beyond purchasing, and maybe even not then. Many customers often purchase through third parties (such as when you purchase a Lenovo laptop on Amazon). In the de Haan et al. study, they found that only 21% of their respondents had contacted the firm over a two-year window, suggesting most customers won’t be able to meaningfully respond to the CES (however it is phrased).
8. Few benchmarks are available. In the original article, the authors mention one benchmark based on the original five-point scale. It was for a lighting company that had moved its score from 2.8 to 2.2, which moved the score to 18.5% below the average for B2B companies (lower is better). The study by de Haan and colleagues also list mean scores for 19 Dutch industries, with scores ranging from low effort 1 (drug stores) to high effort 3.3 (telecom). However, with the change in the scale from five to seven points (and reversal of the item and question wording), these benchmarks become difficult to interpret unless you’re using the original five-point scale. Another report from a survey company called Nicereply, which appears to be using the new scale, reports the average CES is 5.5. As expected, 5.5 is similar to the historical average we see across many seven-point multipoint scales.
9. Reducing effort and ease seems a worthwhile cause. The HBR article offers some good examples of where reducing effort improved business outcomes (even if some of the companies are now defunct). For example, Travelocity improved customer effort by improving the help section of its website (eliminating jargon and improving layout and readability), which reduced calls by 5%. EarthLink initiated a chat with website visitors who spent more than 90 seconds on their help pages and reduced calls by 8%. In fact, with the new wording of the CES item that asks about the ease of the experience, the CES can be seen as a special instance of the Single Ease Question or the System Usability Scale when applied to touchpoints with a company.
10. Effort and ease are another (not sole) loyalty predictor. When applicable to customer service interactions, it’s likely that customer effort (and ease of interaction) is an important contributor to both satisfaction and loyalty and may be good to measure. This is especially the case with the new version of the scale that focuses on ease of interaction. But instead of effort/ease competing for sole predictor of loyalty metrics such as retention, it may be helpful to see it as a contributing factor. It’s likely customer effort/ease is one of a number of important attitudes (key drivers) that correlate with each other (as we found with CSAT and NPS). It’s also likely that effort/ease works in a causal chain to affect loyalty (see also: attitude affects behavior). That is, low effort/high ease leads to higher satisfaction, which affects intention to repurchase and recommend, which in turn affects actual repurchasing and recommending behavior.