 Card sorting is a popular UX method. Developers often use card sorting to restructure the navigation (Information Architecture) of a website or a software’s menu structure.
But sorting cards isn’t necessarily the most intuitive exercise. It takes concentration and time to think about where to place cards and what to call the groups (for open card sorts). The task of sorting dozens of concrete objects into groupings (for example, types of fruit or cars) is challenging enough, but it is especially so for technical and abstract concepts (for example, corporate governance, pension funds, or APIs).
There have been efforts to understand and improve the ease of card sorting by including drag-and-drop functionality and the ability to see all cards and categories easily.
To continue the effort of making sorting easier, we wondered whether adding images to cards along with (or instead of) text would help or hinder the experience. We know the benefits of visualizations on memory and wanted to understand whether they also positively impacted card sorting.
Card Sorting Experiment
To assess the impacts of images on card-sorting behavior, we wanted to create a typical card-sorting scenario that participants (and researchers) are likely to encounter. The first step was to decide what to sort. We wanted a group of items that were realistic and offered enough variety, but we also didn’t want to arbitrarily assemble a group of products that a website wouldn’t realistically offer.
We settled on using a selection of products from the Best Buy website, as it seemed to offer a good variety of products in one broad category (electronic products) without being too overwhelming (like trying to sort products on Amazon, Target, or Walmart).
In January 2022 (with some additional data collected in December 2022), we recruited participants in two waves from a U.S.-based panel to complete a card-sorting exercise using the MUIQ® card sorting feature. We presented participants with 40 product cards pulled from the Best Buy website. The products crossed departments and included items such as toasters, fans, speakers, drones, and dishwashers. Participants were randomly assigned to one of three conditions:
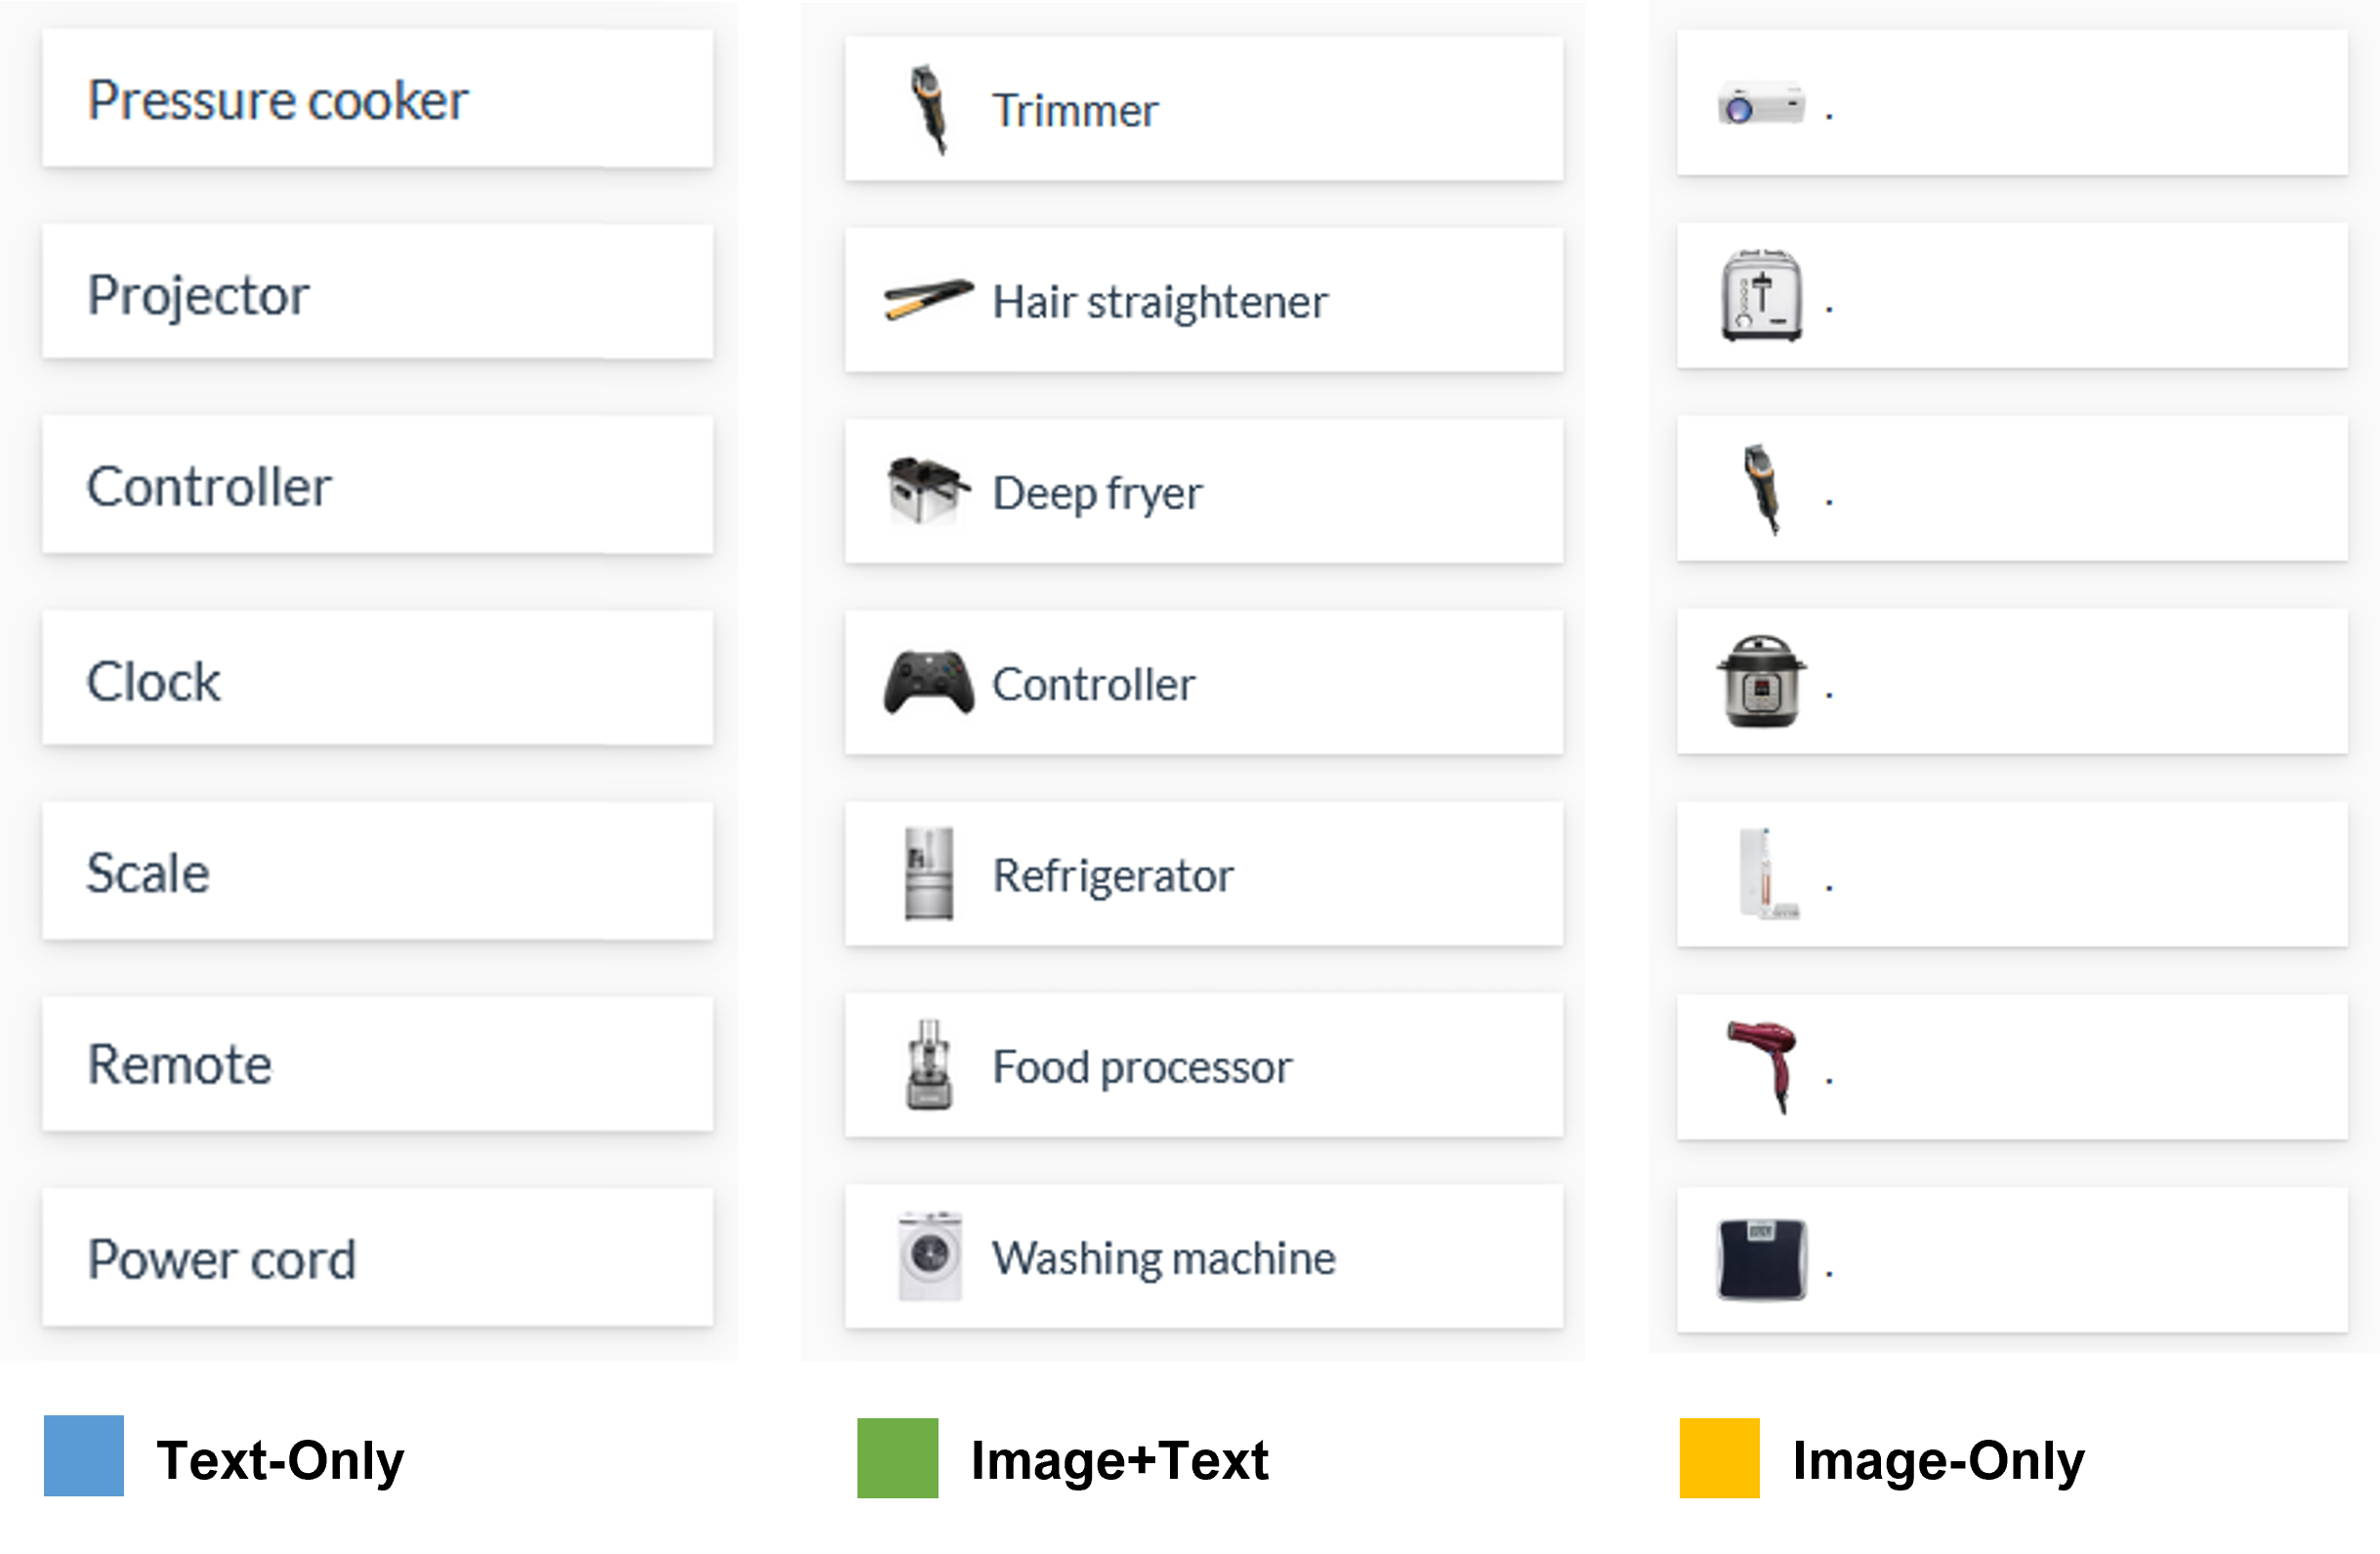
- Text-Only: Cards were presented using only text for the product description.
- Image-Only: Cards were presented using only the product picture.
- Image+Text: Cards were presented with both the text description and the picture.
Examples of the three conditions are shown in Figure 1.
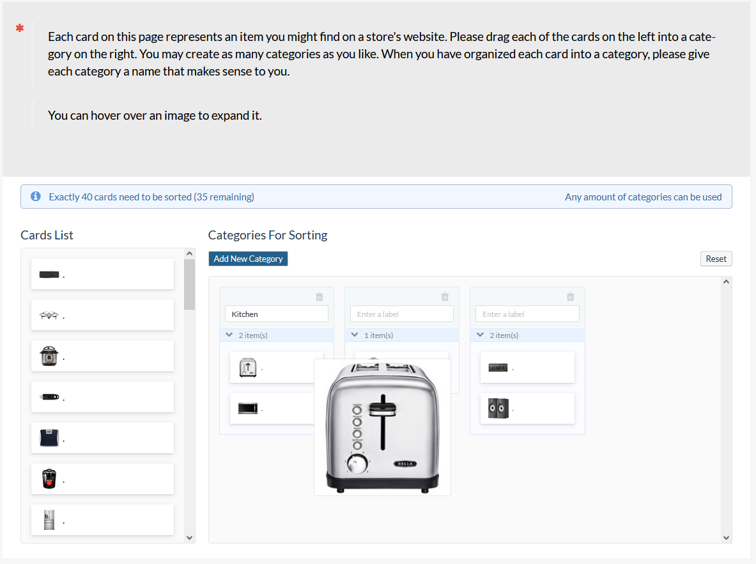
The first challenge in building a card sort with images is working in the digital space constraints. Participants need to be able to see the cards, create and name categories, and sort the cards into those categories all on the same page. Images may take up more screen real estate than text alone, which may add complexity to the sorting experience and potentially remove any benefits images may offer. Making images too small may remove any benefits, as thumbnails may become unrecognizable. One way to balance the need to view images in enough detail within the constraints of a page is to display the images as small thumbnails that enlarge when hovered over, as shown in Figure 2.
Study Results
We collected data from 623 participants covering a range of ages, genders, and incomes. We looked at several variables to assess differences in sorting behavior, starting with the study dropout rates, time to complete the study, and perceptions of how difficult the sort was for participants in each condition.
Dropout Rates
Table 1 shows that there wasn’t an even distribution of dropout rates across conditions. Participants in the Image-Only condition were twice as likely to drop out as those in Text-Only or Image+Text (p = .017). This suggests those assigned to the Image-Only condition struggled more, which led to increased dropout.
| Condition | Dropouts | % Having Done Sorting Study |
|---|---|---|
| Image+Text | 6% | 33% |
| Image-Only | 13% | 27% |
| Text-Only | 6% | 35% |
Table 1: The percentage of participants who started but didn’t complete the study (Dropouts) and the percentage who completed the study and reported having done a sorting study before.
Prior to the card sorting exercise, we asked participants whether they had ever participated in a study “where you sort various topics or concepts into categories.” Table 1 shows that around a third of Image+Text participants had previously completed a sorting study. The percentage of participants in the Image-Only condition who had previously completed a sorting study was slightly but significantly smaller (p = .069) than the Text-Only participants.
We didn’t require participants to leave any comments, but a few participants used an optional text field to write some general comments about the card sorting activity. For example,
“Some of the categories were hard to pin down. I didn’t want to micromanage the items, but I didn’t want to be nitpicky.”
“There were 2 or 3 items that I didn’t think fully fit in the categories that I made, but I didn’t want to put an item in a category by itself.”
“Some items could fit in multiple categories, i.e., a laptop could go under tech, office supplies, or entertainment depending on intended use. Fun study.”
“Interesting sorting exercise. Some items were hard to categorize without further description.”
Time to Complete
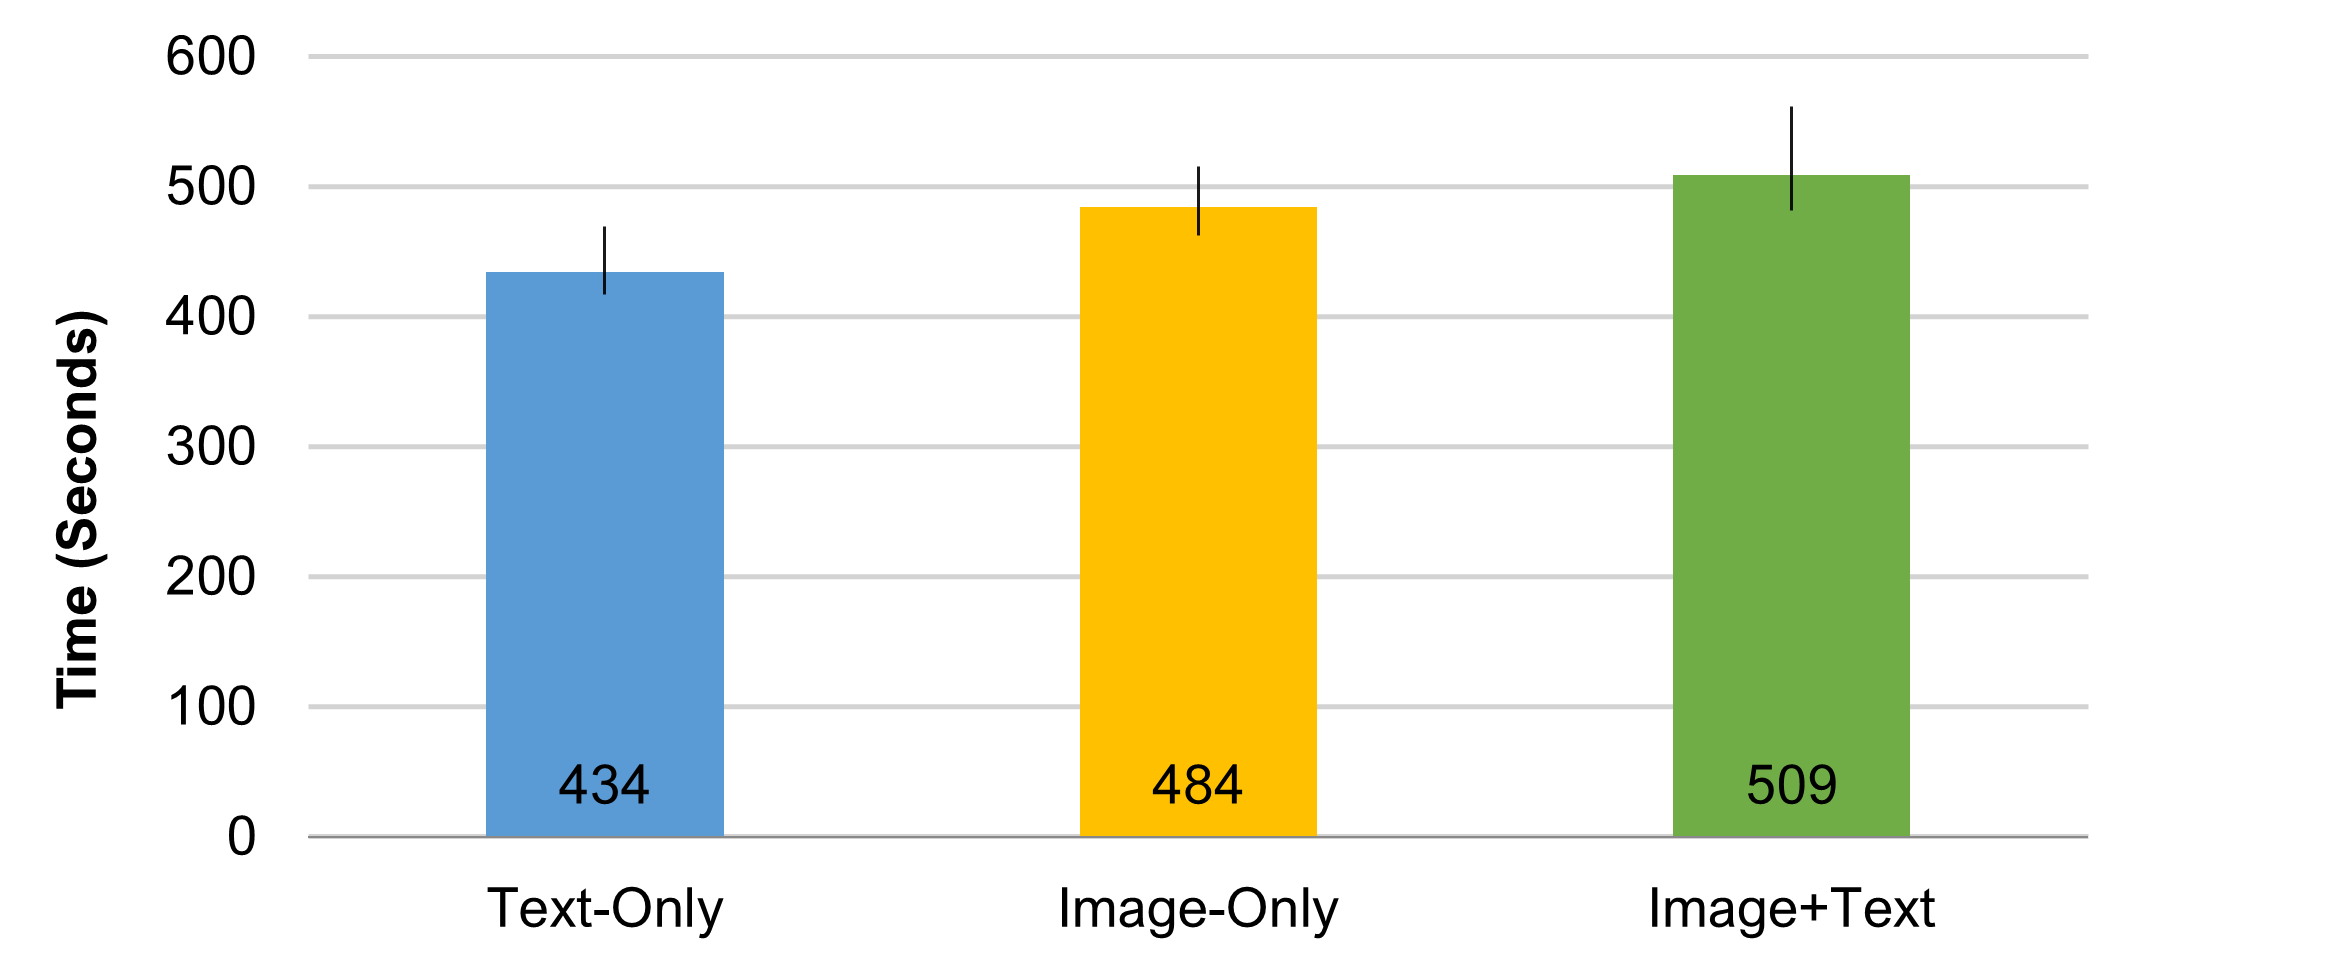
The time required for participants who completed the study was approximately eight minutes. Figure 3 shows the differences in median study completion times. An ANOVA conducted on the log-transformed times revealed a statistically significant difference between conditions (F(2, 620 = 7.23, p = .001). The Text-Only condition took the least amount of time (about 7.2 minutes), and the Image+Text condition took the longest (8.5 minutes), about 17% longer than Text-Only and 5% longer than Image-Only.
It’s likely that some of the additional time is from participants hovering over the images for enlarged views. A benefit of this experimental design is we can see that that hover-time alone doesn’t explain all the additional time, because the Image-Only group took a little less time than Image+Text.
This pattern of completion times is consistent with the cumulative demands of interpreting text and images, with Text-Only being significantly faster to interpret than Image-Only. In the Image+Text condition, participants need to interpret both. Because text is faster to process than thumbnail images, the addition of text with images takes just a bit longer.
Perception of the Task
We asked two questions about the difficulty of the sorting exercise, one using the seven-point SEQ® and another using a nine-point mental effort question. Figure 4 shows that participants rated Image-Only and Image+Text conditions significantly easier than Text-Only on the SEQ (5 versus 4.7, F(2, 620) = 2.82, p = .06).

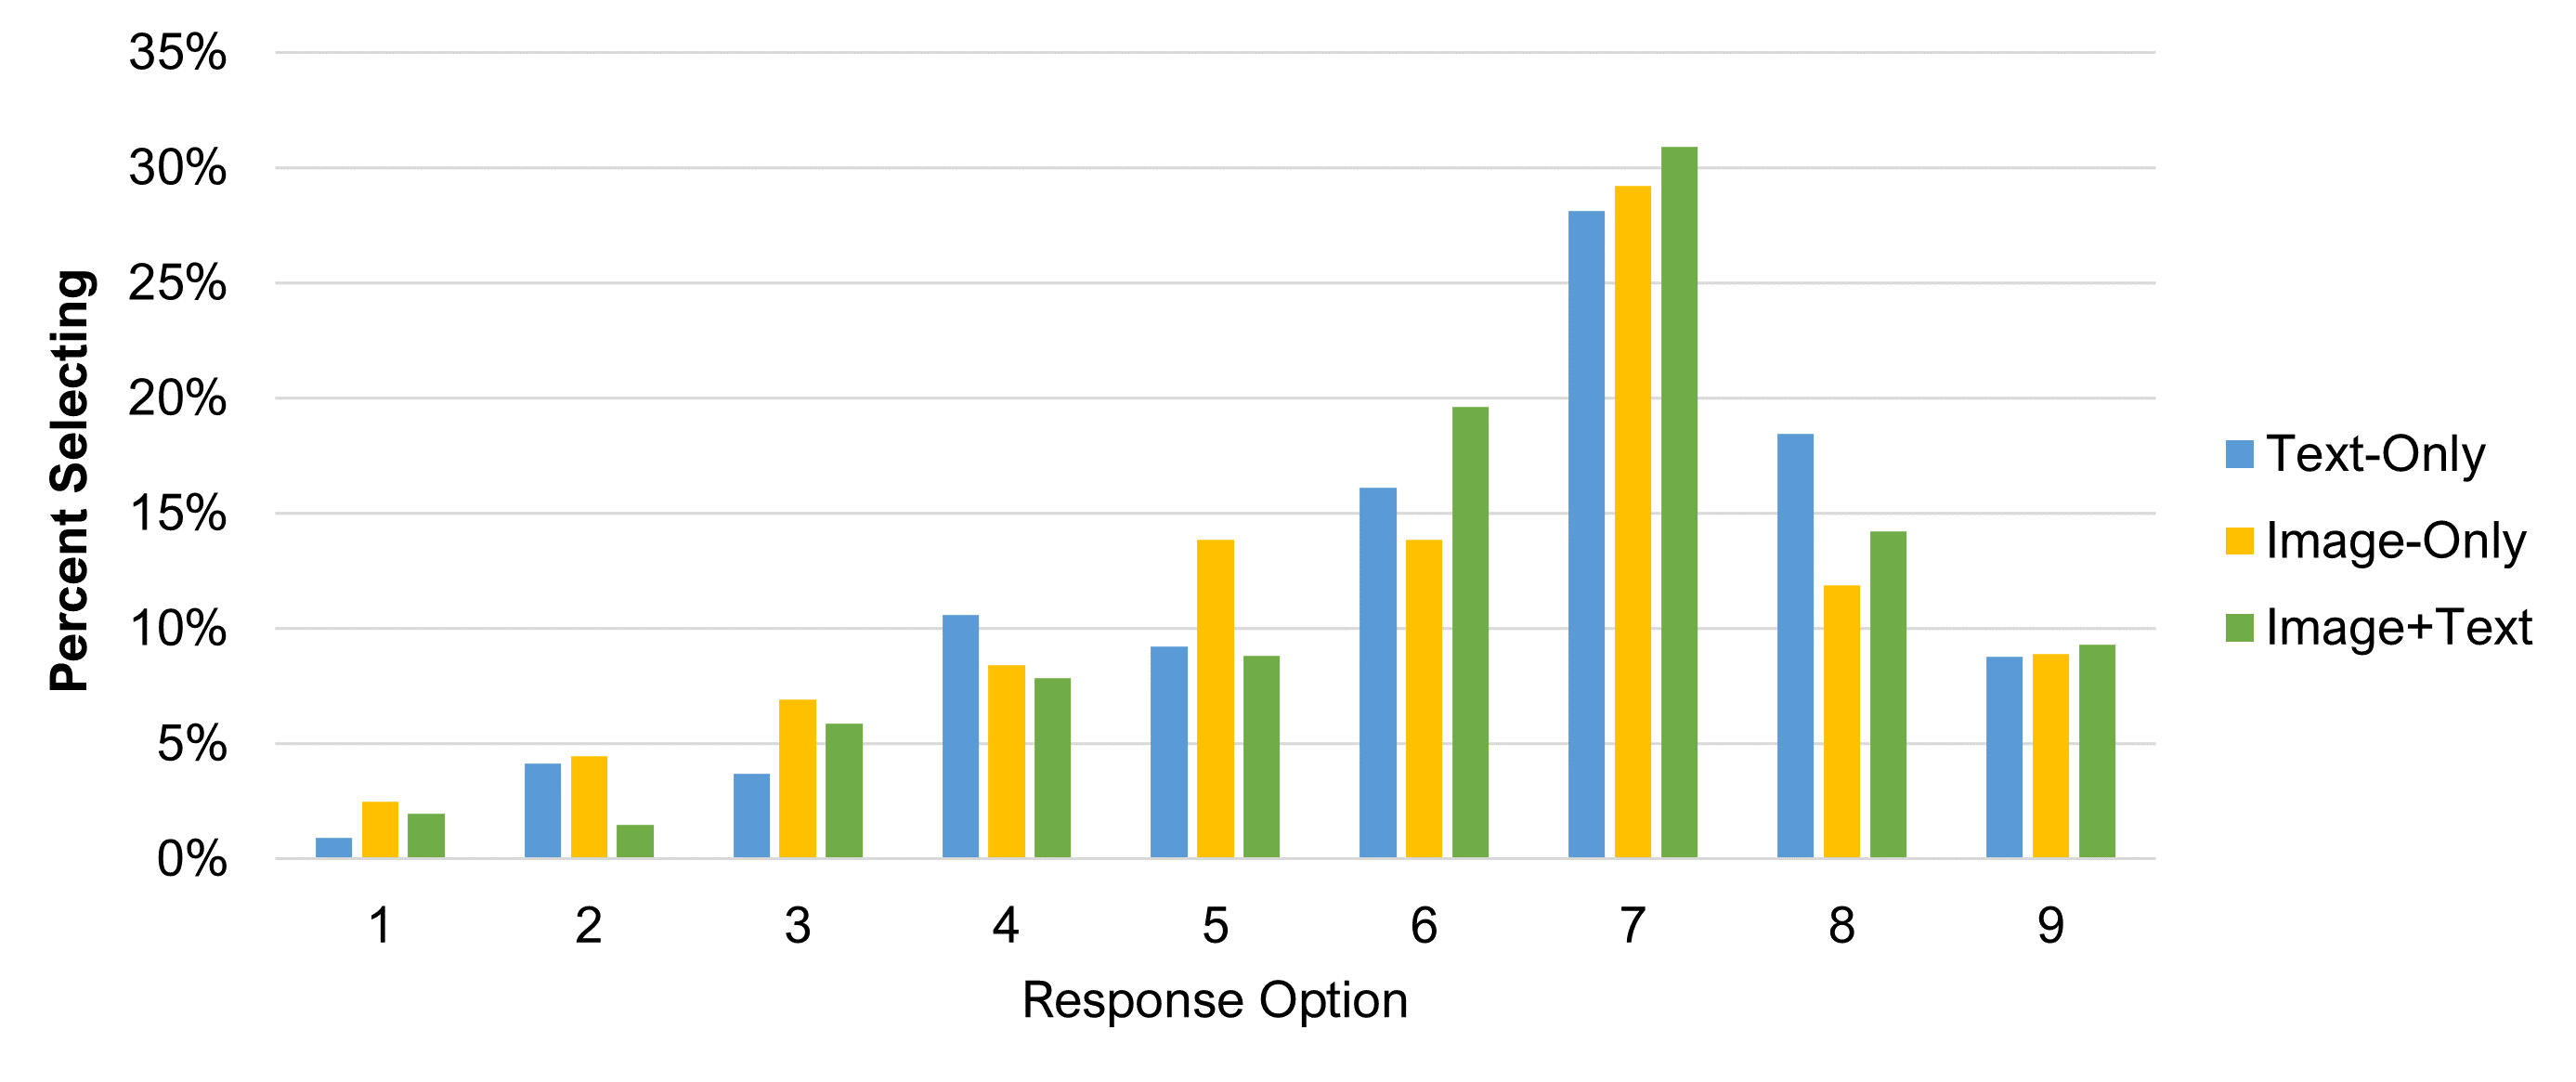
Figure 5 shows the frequency distribution of SEQ scores by condition. The Text-Only condition had fewer top box scores (10%) compared to the two image conditions (15%), but the difference wasn’t statistically significant (p = .14).

We also asked participants to answer a nine-point mental effort scale: “How much mental effort did you spend on the task you just completed?” Figure 6 shows the mean mental effort (lower scores = less mental effort). The Image-Only condition had nominally lower scores than the Text-Only and Image+Text conditions, but the differences were not statistically significant (F(2, 620) = 1.82, p = .16).

Figure 7 shows the frequency distribution for responses. Similar to the SEQ, there were no differences in top-box scores, and a visual inspection reveals relatively similar frequencies across the conditions.
Summary and Discussion
A study with 623 participants assigned to one of three card sorting conditions (Text-Only, Image-Only, Image+Text) found that
Image-Only led to twice the dropout rate. A clear finding from analyzing the percentage of participants who started but didn’t complete the card sort was that those in the Image-Only condition were twice as likely to drop out as those in the Image+Text and Text-Only conditions (13% vs. 6%). We recommend not conducting Image-Only card sorts unless it isn’t possible to provide concise text labels for the images (e.g., studies of icons or gifs), there is a concern that labels might unduly bias participants, or it conflicts with a research goal (e.g., images don’t appear with labels in a product).
Adding images increases sorting time. Participants who completed the study took roughly 17% longer in the Image+Text condition compared to the Text-Only condition, and 5% longer compared to Image-Only. It’s unclear how much of this time was from participants mentally processing the images versus the time needed to hover over an image to view it in more detail. It is, however, clear that Text-Only was faster to sort than either image condition, and Image+Text was slowest, presumably due to the time spent interpreting the combination of text and images.
Images make sorting seem easier. Despite the increased time from adding images, images were rated as significantly easier to sort than Text-Only (SEQ, Image-Only: 5.0, Image+Text: 5.0, Text-Only: 4.7). This suggests that in the tradeoff between sorting time and the information present in the images, participants felt that information extracted from the images made the task easier.
Card sorting isn’t easy for participants. Despite the increase in SEQ scores for image conditions, the mean SEQ ratings (4.7 to 5.0) of the ease of this eight-minute card sorting task were below the historical mean of 5.5, suggesting that the activity was somewhat difficult for participants in all three experimental conditions. Researchers should keep this (along with the dropout rate) in mind and try to minimize the burden on participants by not having too many cards or complicated categories (a topic for future research).
There was no significant difference in mental effort. We found no statistical differences in our single-item measure of mental effort. It could be that there is no difference in mental effort or that participants don’t interpret the question well, as it is an untested item that uses a reversed scale where higher scores are less favorable.
Do images make card sorting easier? Yes, but for study planning purposes, it’s important to know that Image-Only doubles dropout rates and that Image+Text takes about 17% longer than Text-Only. We suspect that the combination of Image+Text is best because two sources of information about the items can resolve ambiguities that might be present in Text-Only and Image-Only conditions.