 The quality of the electronic transmission of the human voice has come a long way since Bell summoned Watson.
But even with all the advancement in technology, “Can you hear me now?” is still part of our modern lexicon.
Voice—both human and digital—plays an increasingly important role in interactions with our devices. But before you can interpret what is being said you need to be able to understand what is being said, and the experience is better when the voice sounds natural.
Conversational applications that use speech recognition and synthetic speech are getting better all the time, especially with the proliferation of new technologies using deep neural networks (DNN [PDF]).
How do we measure the quality of that speech?
For any speech application, a key component of the user experience is the quality of the synthetic speech. Problems in the production of synthetic speech, as in natural speech with disfluencies, can automatically and unconsciously trigger negative impressions of the speaker’s personality. Furthermore, listeners appear to make these judgments very quickly, within the first few seconds of hearing speech.
Consequently, an important tool in the development and assessment of conversational applications is the Mean Opinion Scale. The MOS was developed to subjectively assess speech quality over noisy (or otherwise degraded) voice channels (e.g., early cell phone quality) and then adopted and adapted for evaluating the quality of synthetic speech.
We recently summarized some of the basic information about this standardized questionnaire. In this article, the first of a two-part series, we provide more detail about the MOS transitioning from a version with some psychometric weaknesses into a psychometrically stronger questionnaire.
The MOS was developed in the early 1990s
Shown in Figure 1, the MOS was developed in 1993 as a seven-item questionnaire with five fully labeled response options for each item (Salza et al., 1996). While many questionnaire names are somewhat descriptive of what they do (the PSSUQ, SUS, SUPR-Q), the MOS wins no awards for creativity or descriptiveness.
The “Mean” in its name comes from how it’s scored, which is by calculating the arithmetic mean of all the item ratings—something that’s done in many questionnaires. The “Opinion” in the name refers to its composition of subjective rating scales.

Figure 1: The original Mean Opinion Scale (MOS), with two factors: Intelligibility (items 2–5) and Naturalness (items 1 and 7).
The original MOS enjoyed reasonable success as a measure of the quality of synthetic speech concerning concurrent validity (with paired comparisons and intelligibility scores) and sensitivity to manipulation (audio distortion).
The MOS measures two key factors—Intelligibility and Naturalness—but has some issues
This original version, however, had some issues, including how Item 6 is scored and the factor structure of the questionnaire. The format of Item 6 doesn’t lend itself to a straightforward 1–5-point scale, which makes it problematic for computing an overall mean score and for fitting into a factor analysis. Sonntag et al. (1999) found that items all aligned with a single factor, but Kraft and Portele (1995) reported two factors, Intelligibility and Naturalness, neither of which included Item 6.
Lewis (2001) analyzed data from six studies in which participants rated synthetic voices with the MOS (n = 73). Factor analysis replicated the findings of Kraft and Portele (1995), with Items 2–5 aligning with an Intelligibility factor, Items 1 and 7 with a Naturalness factor, and Item 6 failing to align with either of the factors.
The MOS is reliable and sensitive
Despite these issues, the overall reliability (coefficient alpha) was .89, with .88 for Intelligibility and .81 for Naturalness, all exceeding the standard criterion of .70 for research metrics (Nunnally, 1978). Across the six studies reported in Lewis (2001), the MOS was sensitive as indicated by significant main effects of the factors, voice, and their interaction.
Listeners make stable MOS judgments in just a few seconds
Wang and Lewis (2001) used the MOS in a study of three synthetic voices benchmarked against a human voice for assessments of perceived intelligibility and naturalness and for evaluation of transcription accuracy. Participants (n = 16) heard segments from all four voices in a within-subjects design, counterbalanced using multiple Latin squares to control the order of presentation of voices, domains (currency, dates, numbers, proper names), and segment length (two to fourteen syllables). In separate sessions, participants (1) transcribed the segment they heard and (2) rated voice quality using the MOS.
The key findings were that
- The human voice was the most intelligible (highest transcription scores) and best rated (no surprise).
- Participants had the most difficulty transcribing proper names.
- MOS ratings were stable over a wide variety of phrase lengths (i.e., quality judgments were made quickly).
- Transcription accuracy correlated highly with perceived intelligibility.
MOS ratings of Intelligibility and Naturalness worked well, but as indicated above, the speaking rate item was not consistent with other items and not helpful in determining which voice had the best quality.
The MOS-Revised (MOS-R) was developed to have better psychometric properties than the MOS
To address the weaknesses of the MOS, Lewis (2001) designed a revised version, the MOS-R (Figure 2). It retained the Intelligibility items from the MOS, added two new Naturalness items (6 and 8), and revised the original Item 6 into a new Item 9 that has two parts. To improve reliability, in addition to adding the two items for the Naturalness factor, the number of response options was increased from five to seven.
The first part of Item 9 assessed the appropriateness of the speaking rate, and the second part captured whether the speaking rate was appropriate, too fast, or too slow. The second part was not intended to be included in an overall metric. The reason for the redesign of Item 9 (formerly Item 6) was to make it possible to determine if Speaking Rate is truly independent of the other two factors without losing the practical information regarding whether a listener finds the speaking rate too slow or fast.
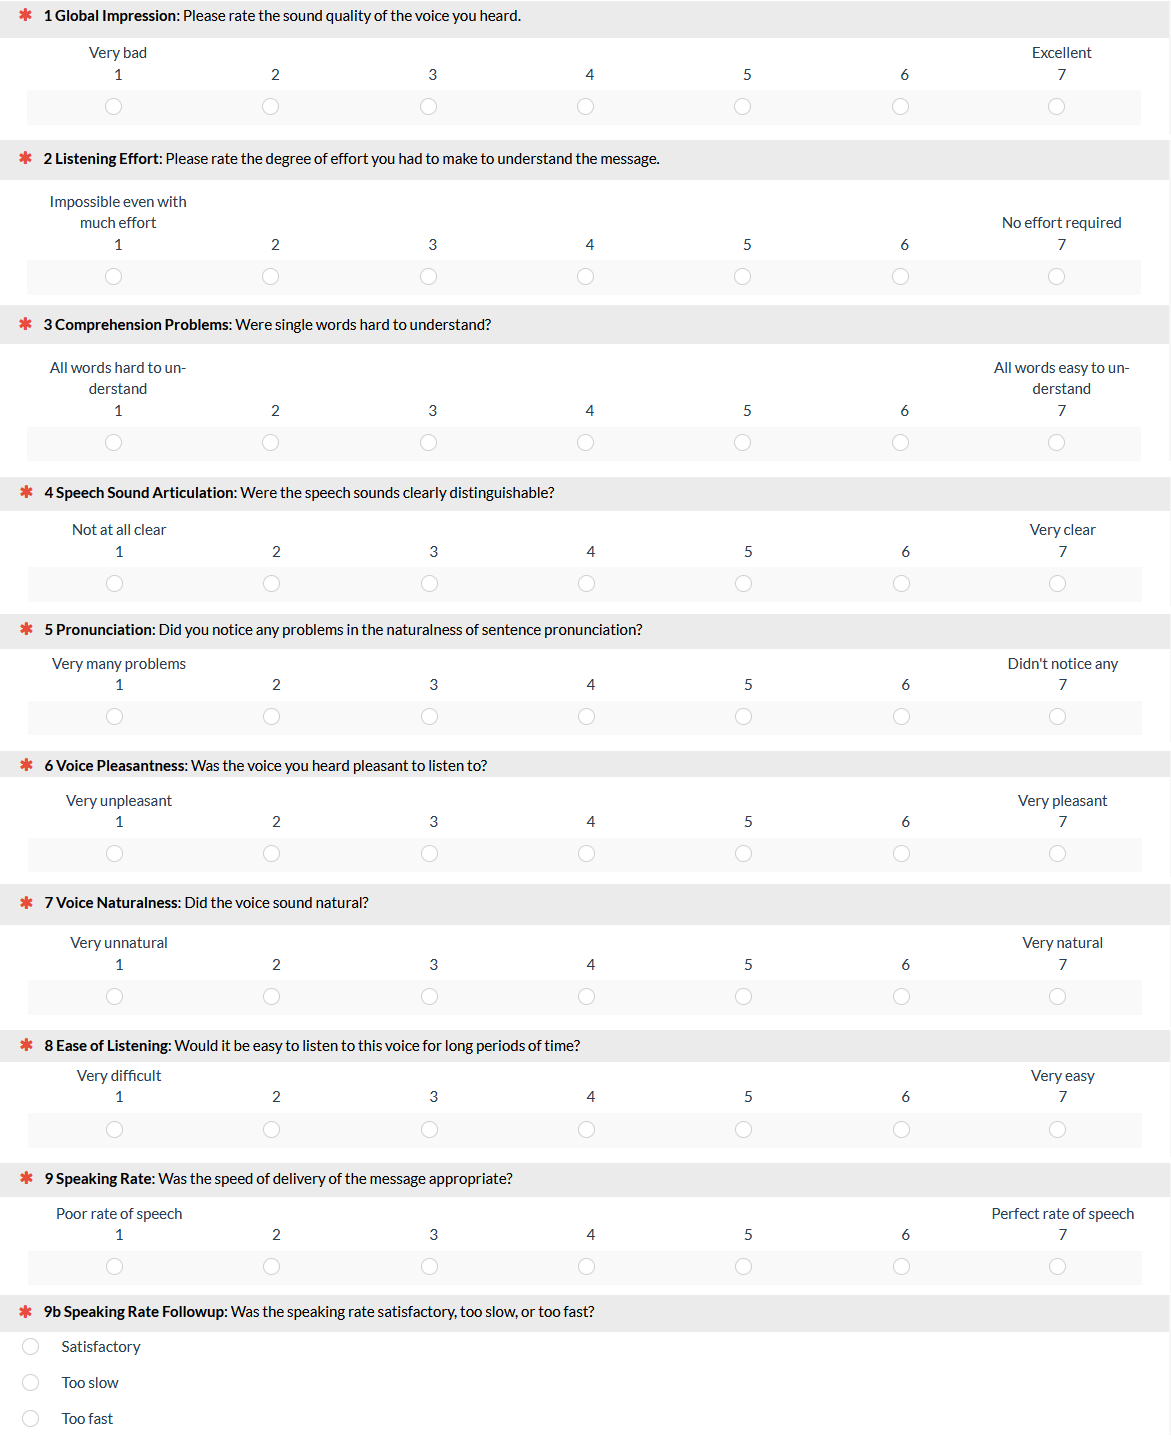
Figure 2: The Mean Opinion Scale Revised (MOS-R) with two factors: Intelligibility (Items 2–5 and 9) and Naturalness (Items 6–8).
The MOS-R successfully addressed the major psychometric weaknesses of the MOS but has its own shortcomings
As expected, an analysis of MOS-R data from a variety of studies of synthetic voices found higher reliability (coefficient alpha), with .93 for Overall, .89 for Intelligibility, and .95 for Naturalness—all improved from the original MOS. Item 9 (revised version of Speaking Rate) aligned on Intelligibility. Item 1 (Global Impression) aligned on both Intelligibility and Naturalness, so it was not assigned to either factor.
The transition from MOS to MOS-R in 2001 was successful in producing a questionnaire with stronger psychometric qualities, but with the increasing production of conversational speech applications, it was becoming important to measure more than just the basics of intelligibility and naturalness. Stay tuned for Part 2 of the story—the evolution from MOS-R to the MOS-X (2003) and MOS-X2 (2018).
Summary and Takeaways
Researchers interested in the assessment of the quality of synthetic speech initially adopted the Mean Opinion Scale (MOS), originally developed for the assessment of the quality of natural speech transmitted through phones using landlines and cellular networks.
Psychometric analysis of the MOS showed that it had reasonably good psychometric properties, but also that there was room for improvement.
The limitations and psychometric weaknesses of the original MOS led researchers to adapt it into the MOS-R (Revised) by increasing the number of response options in the scales from five to seven and increasing the number of items from seven to nine (with some modification) to strengthen its psychometric properties.
Evaluation of data collected using the MOS-R confirmed its advantages over the original MOS, especially regarding scale reliability.
Which of these would we recommend for use in modern UX evaluation of conversational applications? Actually, neither of them. For recommendations, stay tuned for Part 2 of this series, where we will describe the expansion of the MOS-R into the MOS-X and MOS-X2.

