 Satisfaction is different than ease of use. But they are both attitudes.
We provided the conceptual foundation for what satisfaction is, how it differs from perceived ease of use, and how both can be collected at the overall product level (also called the study level) or at the task level. So, while we know they are conceptually distinct but related, as attitudes toward a product often are, how closely related are they?
To understand the relationship between satisfaction and ease, we reviewed data collected from several studies conducted between 2020 and 2025. We reviewed our retrospective and task-based studies at both the study level (for multiple products) and the task level for measures of satisfaction and ease.
Although satisfaction ratings aren’t collected as often as ease ratings in UX studies, we identified 16 datasets that contained task- and/or study-level data with both satisfaction and ease (see Table 1). These datasets gave us the ability to examine correlations for 83 tasks and 42 products with data from 1,768 and 6,593 participants, respectively.
| Results of Study Reviews | Task Level | Study Level |
|---|---|---|
| Number of Studies/Datasets | 6 | 10 |
| Number of Unique Products | 21 | 42 |
| Total Correlations | 83 | 42 |
| Total Participants | 1,768 | 6,593 |
Table 1: Description of datasets found with measures of both satisfaction and ease at the task and/or study level.
The datasets measured websites, mobile apps, and software products in the IT, travel, fintech, and retail spaces. All participants were recruited using opt-in panels where participants were compensated for their time. Most (90%+) of the data came from U.S.-based participants, and the remaining 10% came from the UK, France, and Germany.
Task-Based Metrics
The six task-based studies contained one to nine tasks. After each attempted task, participants were asked to complete both the seven-point Single Ease Question (SEQ®, measuring perceived ease) and a seven-point measure of satisfaction with the website (Figure 1).
| SEQ
|
| Satisfaction
|
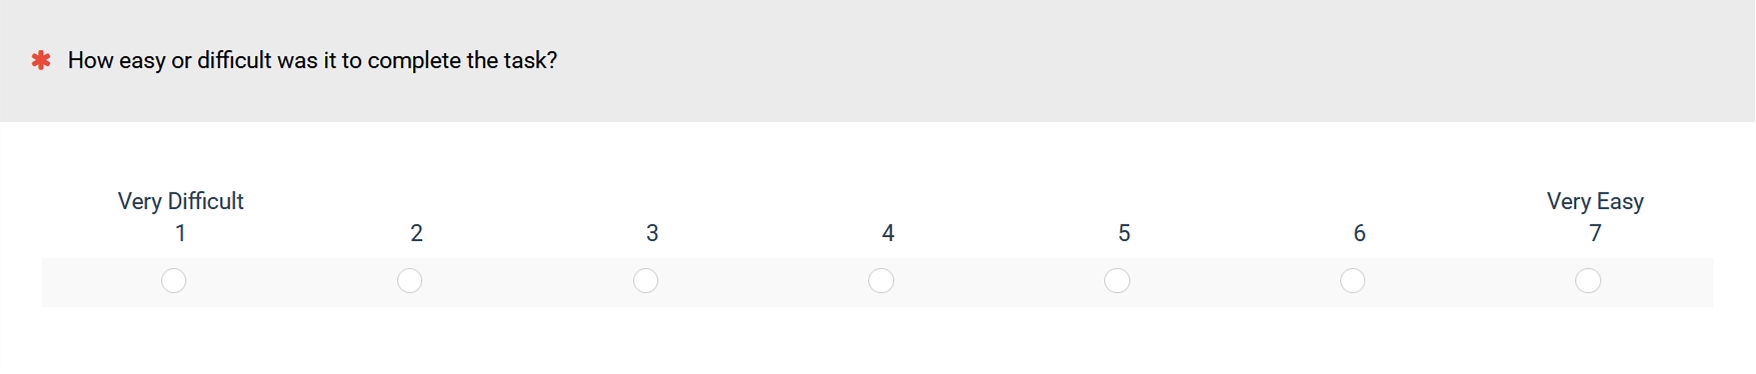
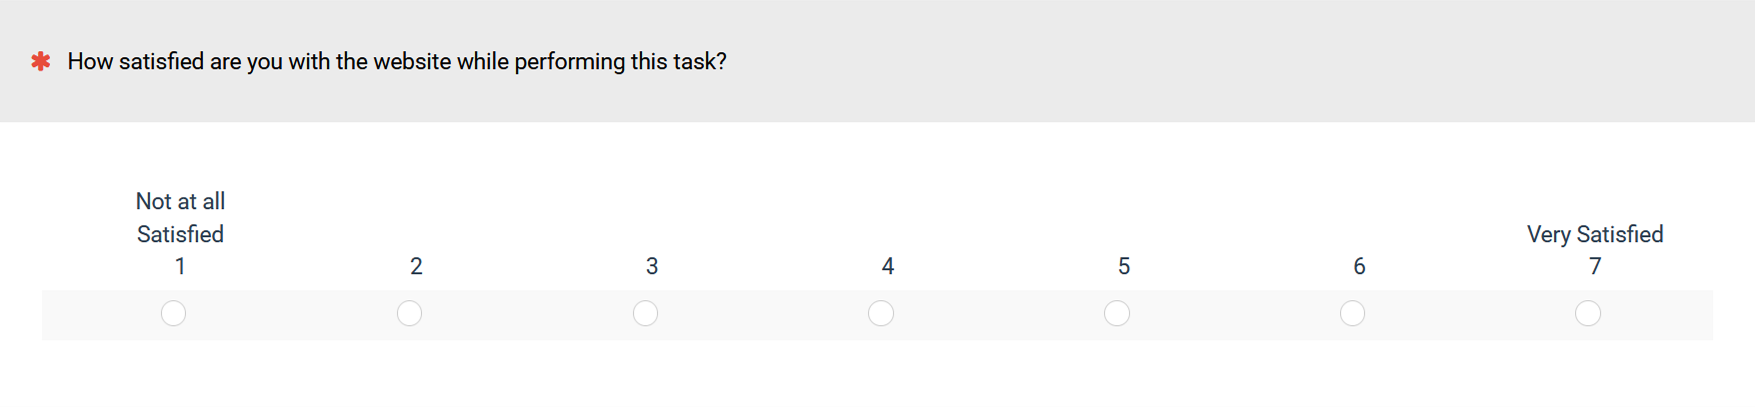
Figure 1: SEQ and task-level satisfaction scales (created with the MUiQ® platform).
Product-Level Metrics
Product-level satisfaction and ease scores were more varied. For ease, most used a five- or seven-point version from the UX-Lite™ or its predecessor, the UMUX-LITE. For satisfaction, the scales were either seven or ten points. We converted all satisfaction and ease metrics to 0–100-point scales before analyzing correlations and mean differences at the product level.
Correlations at Different Levels of Granularity
As discussed in our 2009 CHI paper on relationships among prototypical usability metrics, correlations collected in these types of studies can be analyzed at different levels: individual (lowest level), task (intermediate level), and product (highest level). At the lowest level, individual participants’ responses on the scales are correlated. Between participants, variability is highest, and correlations are expected to be lowest (from both real differences and random noise in responding). In UX research, we rarely scrutinize individual performance. Instead, we are interested in aggregating scores to understand performance at the task and product levels. Nonetheless, understanding how much the strength of the correlations changes at each level can be interesting.
Strong Correlations at the Participant Level
To compute the average correlation, we first correlated the individual participants’ responses for each task and product (Figure 2). To average the correlations across the 83 tasks and 42 products, we then converted the raw correlations using the Fisher r-to-Z procedure, which corrects the positive skew of simply averaging correlations. The average correlations at this level were both strong and slightly higher at the task level (r = .79) than the study level (r = .71). When correlations are this high, the metrics have over 50% shared variance.
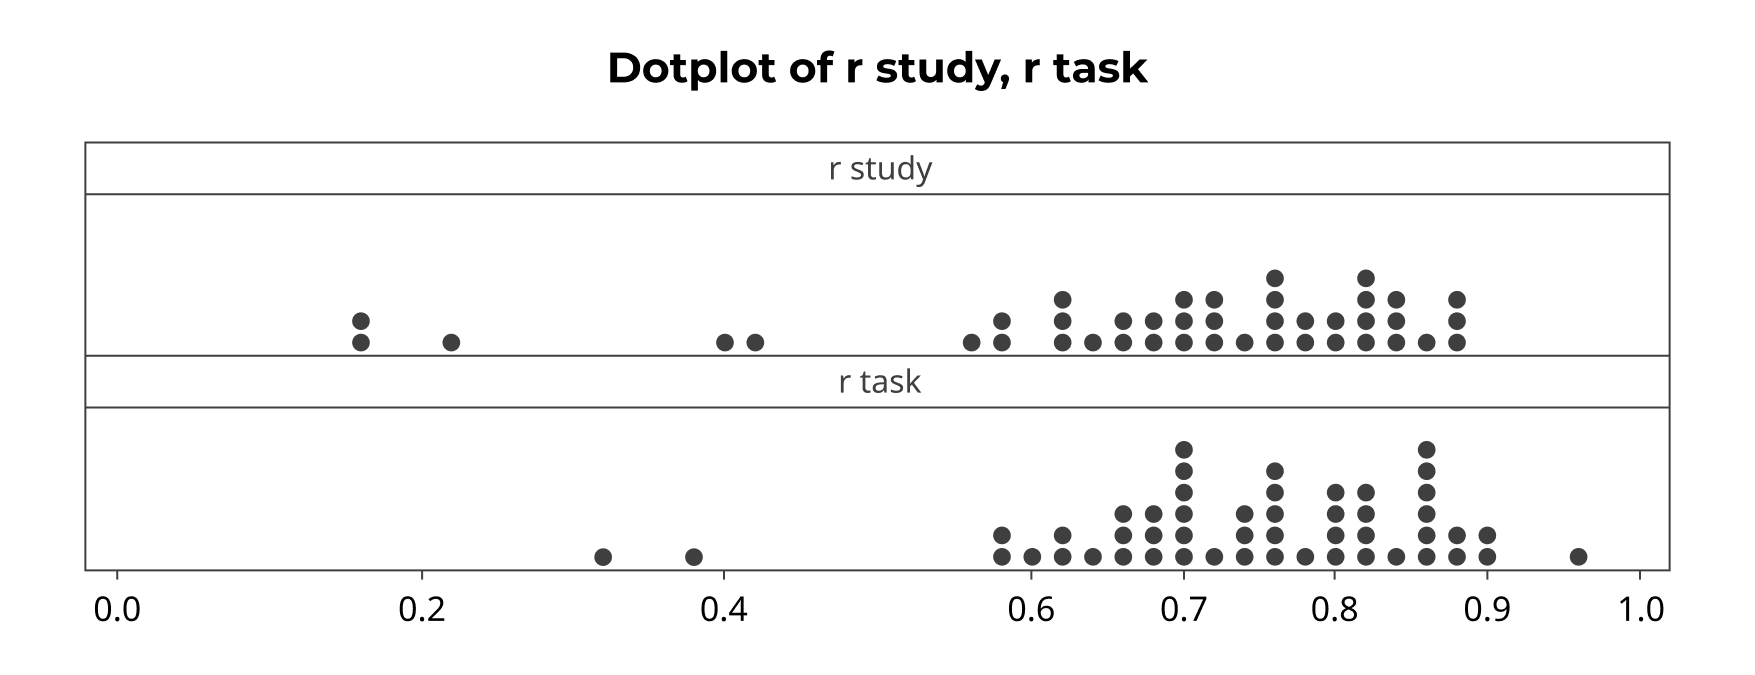
Figure 2: Correlations of satisfaction and perceived ease at study and task levels.
Very Strong Correlations at the Task and Product Levels
Figure 3 shows the correlations of satisfaction and perceived ease for the 83 tasks and the 42 products.
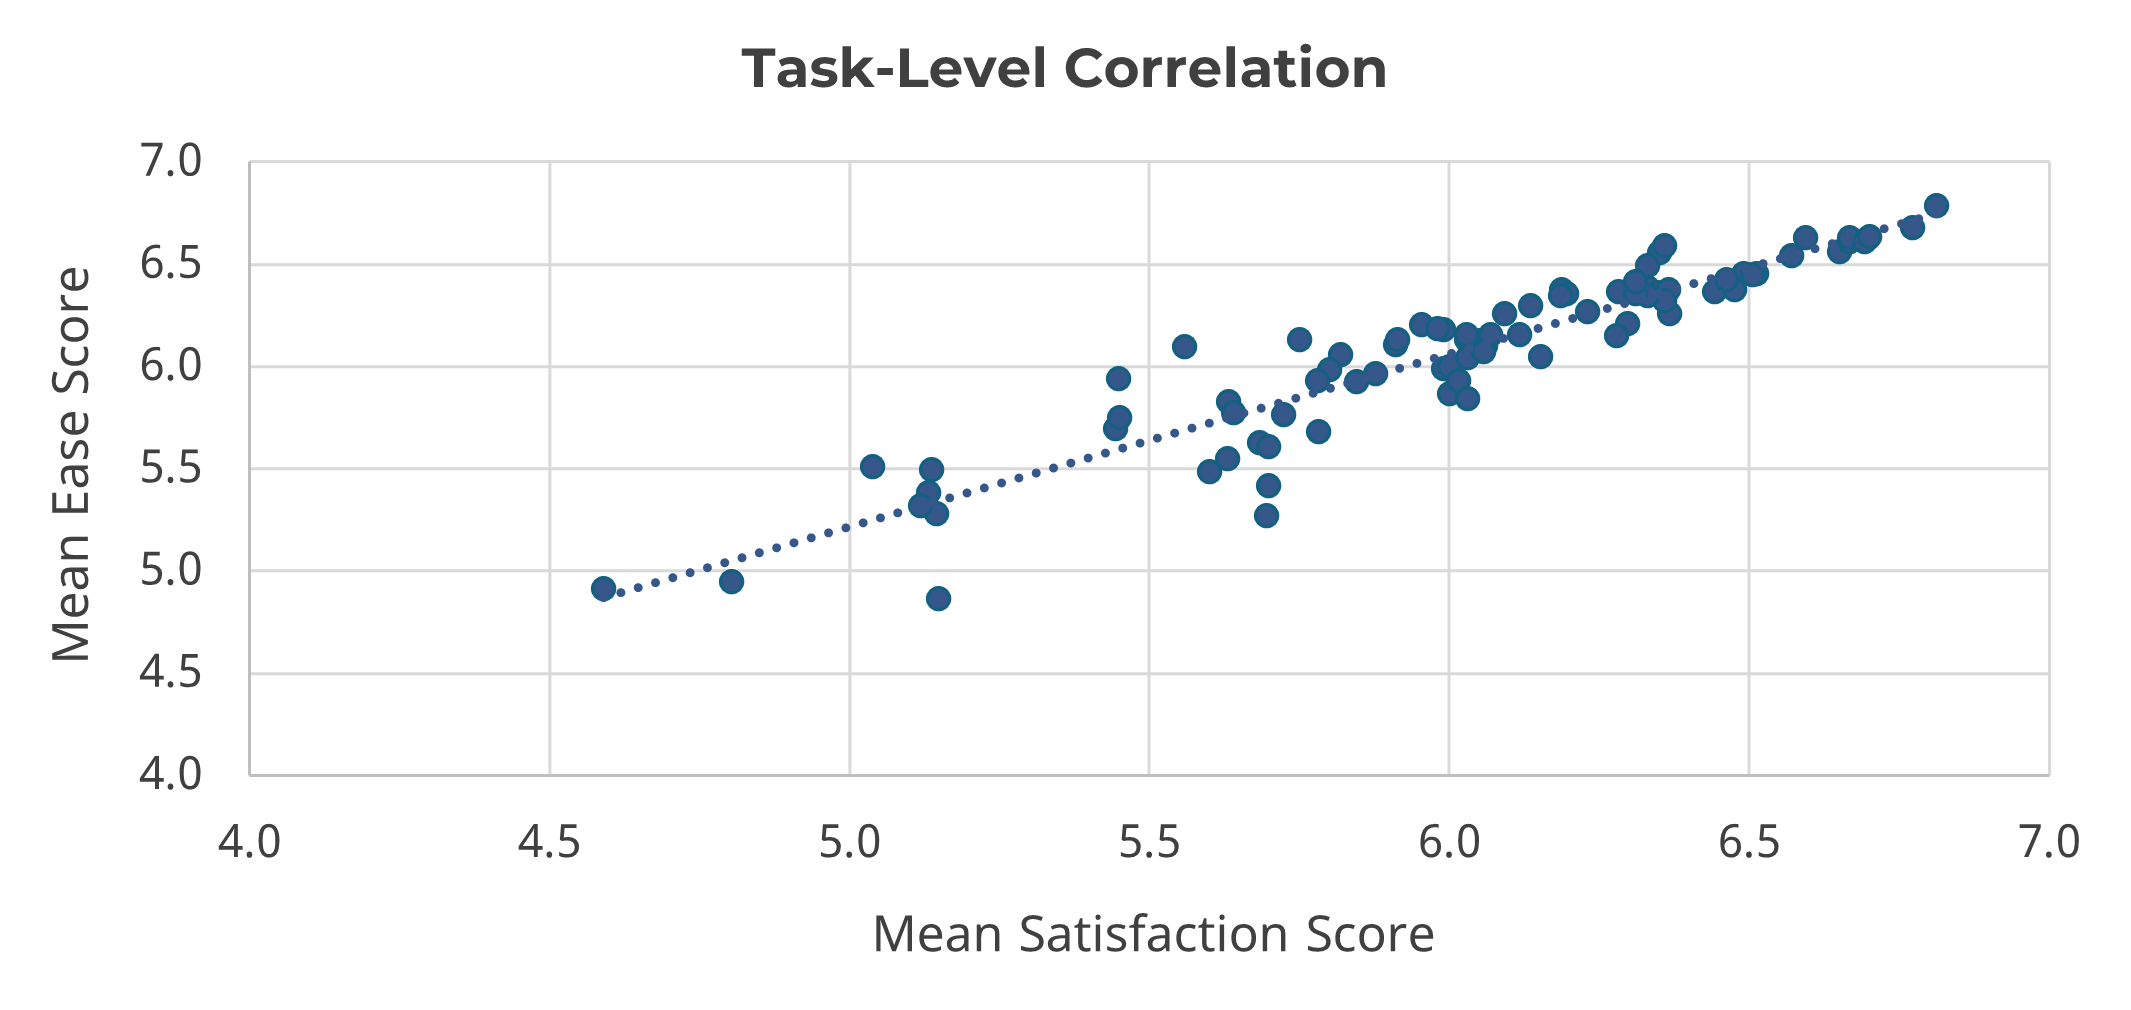 |
 |
Figure 3: Scatterplot between ease and satisfaction scores at the task and study/product level.
As expected, these correlations were stronger than those at the participant level because individual variations were smoothed out, with r = .93 at the task level and r = .92 at the study level. When correlations are this high, the metrics have about 85% shared variance.
These analyses are consistent with our findings that satisfaction at the task level is highly correlated with task ease.
Average Differences Are Small Between Satisfaction and Ease Ratings
Correlation shows the strength of the relationship but doesn’t speak to the size of the differences in scores (their correspondence). With all ease and satisfaction scores normalized on the same scale, we also looked at the average difference between mean ease and mean satisfaction scores. Surprisingly, the differences were rather small, only about 1% on average. The average difference was only .06 points on the seven-point scale (0.99% of the range) and 1.03 points on the 0–100-point scale (1.03% of the range). The differences are plotted in Figure 4 and summarized, along with the correlations, in Table 2.

Figure 4: Absolute difference as a percentage of the scale between task- and product-level ratings of satisfaction and ease.
| Correlation/Correspondence | Task Level | Product Level |
|---|---|---|
| At Person Level r | 0.79 | 0.71 |
| Task/Product Level r | 0.93 | 0.91 |
| Raw Mean Difference | 0.06 | 1.03 |
| % of Scale Difference | 0.99% | 1.03% |
Table 2: Correlation and correspondence between satisfaction and ease ratings at the person, task, and product levels.
Summary and Discussion
Our analysis of data from 125 correlations between satisfaction and ease ratings from 8,361 participants across 63 products from 16 different sets of data revealed:
Ease correlated strongly with satisfaction. Correlations at the participant level were high for task-level correlations (r = .79) and slightly lower for product-level correlations (r = .71). When correlated at the task and product levels, the correlations were even higher, approaching perfect correlation (r = .93 at the task level and r = .92 at the product level).
Differences between satisfaction and ease ratings were surprisingly small. On average, the differences between the means of satisfaction and ease ratings were only about 1% at both the task and product levels. This is a very high level of correspondence.
Despite their conceptual difference, measurements of satisfaction and ease ratings are almost the same. When two metrics have a very strong correlation and very high correspondence, from a metrics perspective, they are essentially equivalent despite any conceptual differences.
There doesn’t seem to be much point in collecting both ease and satisfaction ratings at the task level. Our analysis showed a strong correlation and correspondence between ratings of task ease and satisfaction. One of the goals in research is to ask only the questions that need to be asked—anything else is inefficient. Unless there is a compelling reason to collect ease and satisfaction ratings at the task level, we recommend only measuring perceived ease with the SEQ. If you need to assess other aspects of the task, such as the time it takes or something specific about its functionality, you should feel comfortable measuring those because they are more likely to provide nonredundant information than satisfaction at the task level.
Product-level satisfaction strongly connects with other business metrics. Even though respondent behavior is almost the same when rating perceived ease and satisfaction at the product level, there is a strategic reason to collect both. UX research tends to focus on the precursors to satisfaction because these precursors are closely related to the specific designs of products or services. Business research tends to focus on satisfaction as a driver of important business metrics (e.g., behavioral intentions such as likelihood to repurchase, actual repurchasing behavior, profit). We recommend including the measurement of satisfaction at the product level in UX research because it enables the quantification of the extent to which perceived ease of use (and other UX metrics such as perceived usefulness, appearance, and trust) act as drivers of satisfaction to bridge the gap between UX and business metrics.
Limitations: While we used both large and varied datasets in this analysis, all came from studies that had ease of use as a core component of interest, suggesting it was already considered impactful. It’s certainly possible that measures of satisfaction and ease won’t always correlate when using other datasets. However, we suspect a low to no correlation is much less likely at the task level (where the focus of action is on completing a task). We also suspect that at the product level, the correlation between satisfaction and ease could be modest to low in contexts where ease of use plays a negligible role in driving satisfaction. But, for most activities involving UX research, we suspect typical correlations between ratings of ease and satisfaction won’t deviate substantially from what we’ve reported in this article.