 For the past few years, we’ve written extensively about our research and usage of the UMUX-Lite. That research has followed the increase in popularity of this compact questionnaire.
From its initial publication in 2013, the UMUX-Lite (Usability Metric for User Experience—Lite Version) has become an increasingly popular measure of perceived usability.
Figure 1 shows the standard version of the original UMUX-Lite, made up of two seven-point agreement items: one is for the construct of perceived ease-of-use (Ease), and one is for the construct of perceived usefulness (Usefulness).
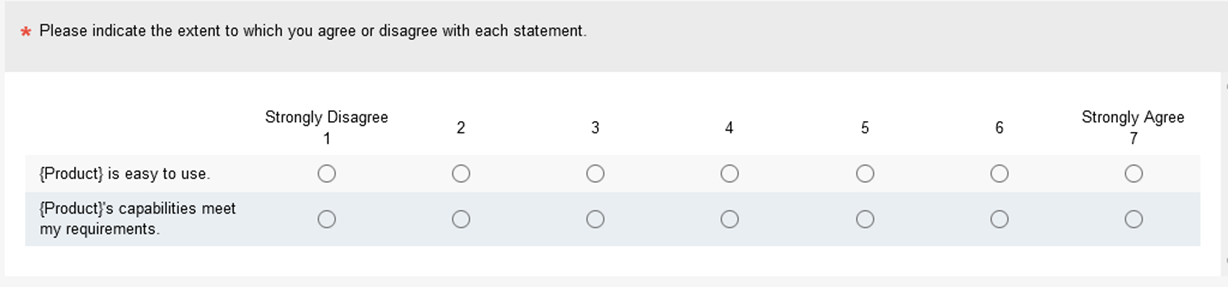
Figure 1: Standard version of the UMUX-Lite questionnaire.
Historically, the UMUX-Lite was derived from the UMUX, which was inspired by the System Usability Scale (SUS) and the ISO 9241 Part 11 international usability standard. Research has shown significant structural relationships among the UMUX-Lite, ratings of overall experience, the likelihood-to-recommend (LTR) item that is used to compute the Net Promoter Score (NPS), and the Technology Acceptance Model (TAM).
Like the SUS, UMUX-Lite scores are converted to a 0–100-point scale using a simple linear transformation. Early UMUX-Lite research indicated some value in using a regression formula to improve the correspondence with concurrently collected SUS scores, but later research determined that simple linear interpolation is better, especially when scoring products with above-average levels of perceived usability.
Researchers at MeasuringU® began using the UMUX-Lite a few years after its publication. We were attracted by its conciseness (just two items) and the preliminary research that showed a close correspondence between UMUX-Lite and SUS scores. Along the way, we’ve made enough modifications and additions that the questionnaire we use, although closely related to the original UMUX-Lite, is different enough for us to distinguish it from the original. Consequently, we think it needs a new name. We call it the UX-Lite™ (User Experience—Lite Questionnaire).
In this article, we discuss the characteristics that distinguish the UX-Lite from the UMUX-Lite and describe our new UX-Lite calculator.
Key Differences between the UMUX-Lite and UX-Lite
There are three key differences between the UMUX-Lite and UX-Lite:
- Number of response options
- Flexible alternatives for the Usefulness item
- Availability of norms for interpreting scores
Number of Response Options
The standard version of the UMUX-Lite uses seven-point agreement scales. Because a considerable body of research shows little difference in the measurement properties (such as central tendency and reliability) of UX scales using five to eleven response options, the practice at MeasuringU has been to use five-point agreement items instead.
The primary reason for using five-point scales is a practical rather than a statistical consideration: it’s a lot easier to integrate the UX-Lite with other commonly used UX questionnaires that use five-point scales (such as the SUS and SUPR-Q®). This integration has two benefits.
First, it saves space. Many standardized UX questionnaires contain items that closely match the UX-Lite Ease item (SUS: “I thought {product} was easy to use”; SUPR-Q: “This website is easy to use”). To get a UX-Lite measurement, all you need to do is add the Usefulness item to the five-point scale matrix you already have. Second, the integration allows us to test concurrent validity and makes it easy to create measurement equivalence with the SUS and SUPR-Q.
A recent paper published in Human Factors (Lewis, 2019) specifically compared UMUX-Lite ratings of experiences with auto insurance websites that were collected using three-, five-, seven-, and eleven-point agreement items. Focusing on the results for the five-point versions (n = 64), the researchers found
- High reliability (coefficient alpha = .89)
- Highly significant correlation with the SUS (r = .87)
- Highly significant correlation with ratings of overall experience (r = .83)
- Highly significant correlations with ratings of likelihood-to-recommend (r = .81)
- No significant or practical difference in correspondence with SUS means (d = .31, a third of a percent on the UX-Lite’s 0–100-point scale)
- No significant or practical difference in correspondence with SUS grade point averages (d = .09, about 2% on the 0–4-point standard GPA scale)
These findings strongly support the use of five-point scales in the UX-Lite. This doesn’t mean there aren’t advantages to using seven-point scales over five-point scales (as we found with our SEQ validation). But differences aren’t always large enough to overcome other practical advantages (such as using existing five-point grids).
Alternatives for the Usefulness Item
Since we began using the UMUX-Lite in our practice, several of our clients expressed a negative reaction to the vocabulary level of its standard Usefulness item (“{Product}’s capabilities meet my requirements”). Over the past year, we’ve conducted numerous studies to create a set of alternate versions with very similar measurement properties (both central tendency and response option distribution) to the original version. The set of alternates (including the original) that we currently endorse for use in the UX-Lite are
- {Product}’s capabilities meet my requirements.
- {Product}’s functionality meets my needs.
- {Product}’s features meet my needs.
- {Product}’s functions meet my needs.
- {Product} does what I need it to do.
For comparison with Figure 1, Figure 2 shows an example of a validated UX-Lite questionnaire (five-point scales, Usefulness item with simple vocabulary).
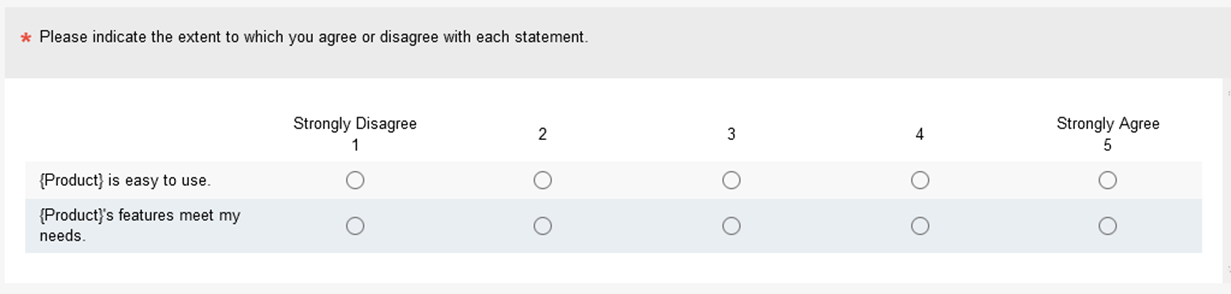
Figure 2: One of several validated versions of the UX-Lite questionnaire.
Norms for Interpreting UX-Lite Scores
One of the strengths of the UMUX-Lite, which became apparent after several years of research, was the correspondence between the means of concurrently collected UMUX-Lite and SUS scores at the study level. This correspondence enables the interpretation of UMUX-Lite means with the Sauro-Lewis curved grading scale for the SUS. That is still the case with the UX-Lite.
It can also be advantageous when developing a standardized UX questionnaire to collect normative data for assigning percentile scores to raw scores, as we have done for the SUPR-Q. Using data collected over the past five years in our internal research, we can now compare UX-Lite means with norms for business software, consumer software, major websites, and overall (combined) to produce percentile scores. As we do for the SUPR-Q, we plan to refresh those normative databases regularly.
The UX-Lite Calculator
With this move from the UMUX-Lite to the UX-Lite, we have developed an Excel calculator to make it easy to conduct UX-Lite analyses and produce various useful graphs. The calculator has functions for
- Scoring and Benchmarks
- UX-Lite scoring and reliability (one product)
- Converting UX-Lite scores to percentiles
- Scatterplots and S plots (multiple summary data)
- Confidence Intervals
- Produced from raw UX-Lite responses
- Produced from summary UX-Lite scores
- Dashboard for tracking changes in confidence intervals over time
- Comparison
- Comparison of UX-Lite scores to a benchmark
- Within-subjects comparison of two UX-Lite scores (using raw data)
- Between-subjects comparison of two UX-Lite scores (using raw data)
- Between-subjects comparison of two UX-Lite scores (using summary data)
- Sample Size Estimation
- For comparison with a benchmark
- For comparison of two groups (between-subjects)
- For comparison of two groups (within-subjects)
- For a confidence interval’s margin of error
Many of these pages are standard in our Excel calculators because they apply to any quantitative metric (e.g., confidence intervals, statistical comparisons, and sample size estimation). Some of the analyses and graphs that are specific to the UX-Lite include scatterplots with coordinates based on Ease and Usefulness means (Figure 3), Ease and Usefulness percentiles (Figure 4), and S plots (Figure 5) using our current overall normative database.
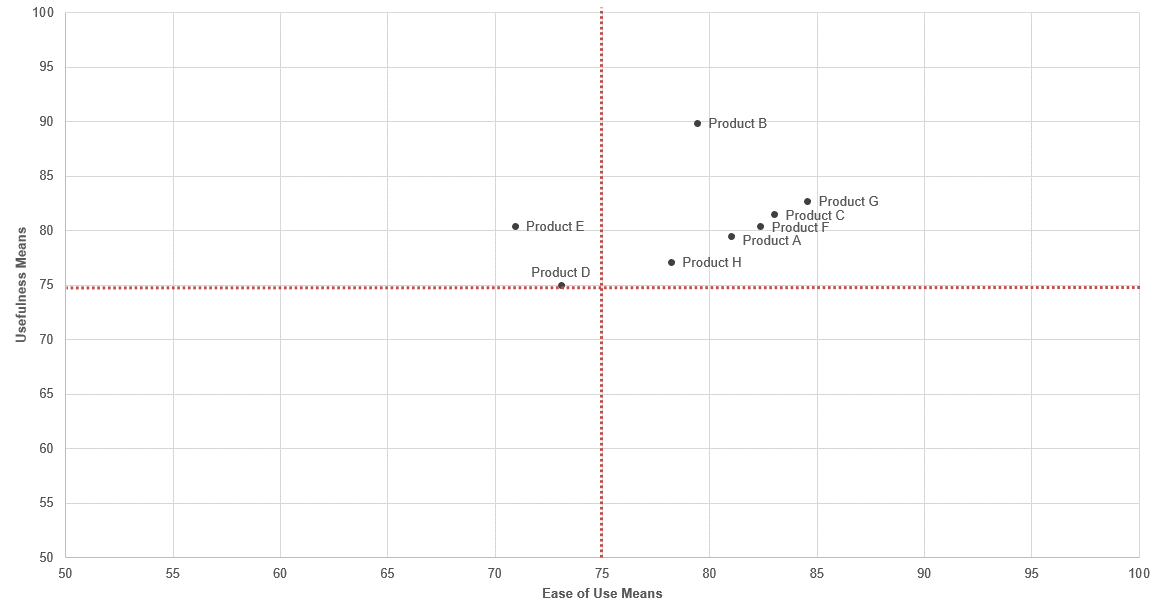
Figure 3: Example of Ease/Usefulness means scatterplot.
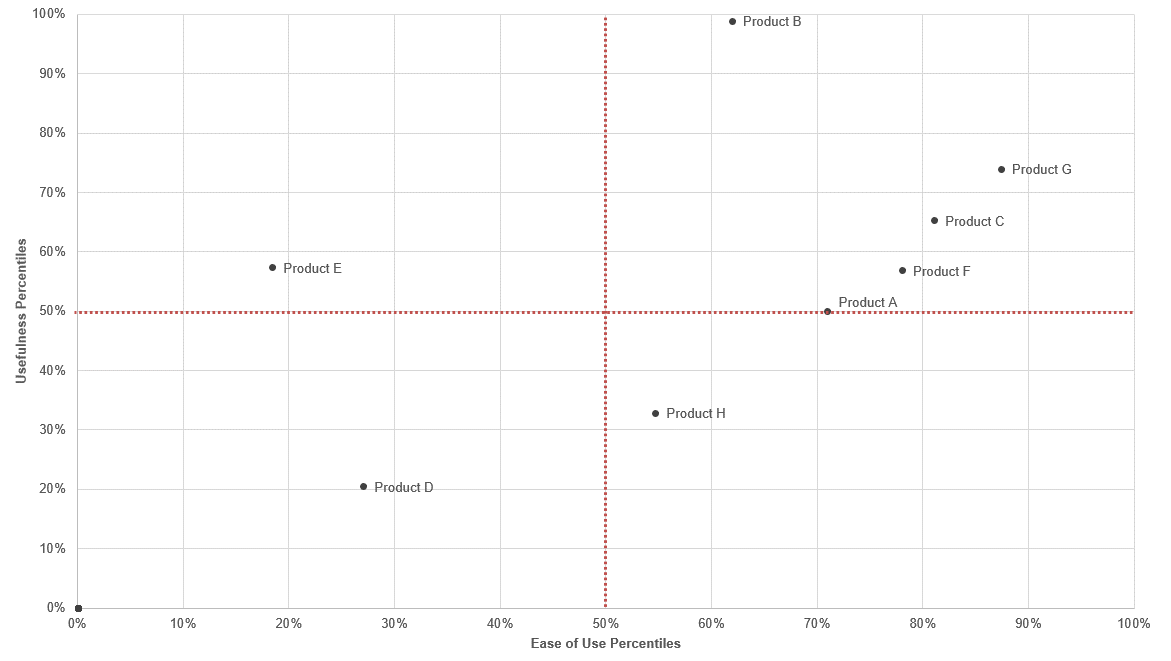
Figure 4: Example of Ease/Usefulness percentiles scatterplot.
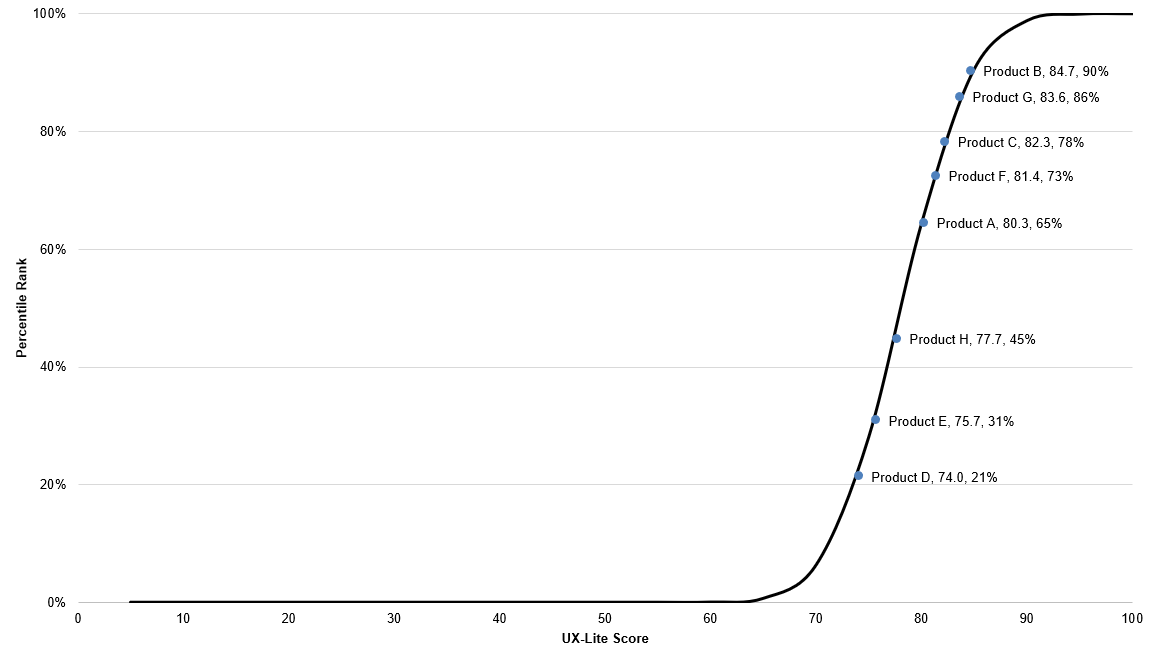
Figure 5: Example of UX-Lite percentiles S plot.
Key Takeaways
Since we began collecting data in 2017, our version of the UMUX-Lite has evolved into the UX-Lite.
The UX-Lite differs from the UMUX-Lite in
- The standard number of response options (five-point rather than seven-point)
- Options for simpler wording of the UMUX-Lite’s Usefulness item
- The development of normative databases for converting raw UX-Lite study means to percentiles
Based on our recent research into alternatives for the Usefulness item and five years of data collection for our normative databases, we have developed a new UX-Lite calculator to make it easier to analyze and graph UX-Lite data.