 There’s a lot to do outside.
Biking, hiking, fishing, hunting, boating, and driving an RV all fall under the umbrella of the outdoor recreation industry.
Depending on how broadly it’s defined, it can be anywhere from a $10 billion to $800 billion industry.
And all the gear needed for these outdoor activities can be bought in brick-and-mortar and online stores.
For now, Amazon has yet to completely upend the industry, but it’s certainly making inroads.
To compete online, outdoor retail websites need to offer a good experience, as we’ve found that substandard experiences tend to precede a drop in future business.
To better understand the outdoor website user experiences, we conducted two studies. The first was a retrospective benchmark on five popular outdoor websites:
The second was a remote think-aloud study with five participants on a subset of the websites (Backcountry, REI, and Bass Pro) using our MUIQ platform.
Study and Participant Details
In June of 2019 we asked 256 participants who had visited or made a purchase on one of the five outdoor store websites in the past year to reflect on their most recent experience. We then asked five participants who reported recently purchasing on an outdoor website to look for products in a three-site within-subjects study in October 2019.
Participants in the study answered questions about their prior experience. Desktop users answered the eight-item SUPR-Q, and we calculated Net Promoter Scores for those users. In particular, we were interested in visitors’ attitudes toward the site, problems they had with the site, and reasons they used the website.
Full details are available in the downloadable report for purchase. Here are the key takeaways.
Measuring the Outdoor Website UX: SUPR-Q
The SUPR-Q is a standardized measure of the quality of a website’s user experience and is a good way to gauge users’ attitudes. It’s based on a rolling database of around 150 websites across dozens of industries.
Scores are percentile ranks and tell you how a website experience ranks relative to the other websites. The SUPR-Q provides an overall score as well as detailed scores for subdimensions of trust, usability, appearance, and loyalty. Its ease item can also predict an accurate SUS equivalent score.
The scores for the five outdoor retail websites (desktop versions) in the perception study are above average at the 81st percentile (scoring better than 81% of the websites in the database). SUPR-Q scores for this group ranged from the 78th percentile (Bass Pro Shops) to the 83rd percentile (Backcountry).
Brand Loyalty and Appearance
Net Promotor Scores for outdoor retail websites had an average of 9%. Participants were least likely to recommend Dick’s Sporting Goods (-10%) and most likely to recommend Backcountry (25%).
Bass Pro Shops’ top improvement area was Appearance. While it was still above average, it scored the lowest relative to its peers. Participants who used Bass Pro Shops felt the website design looked cluttered and chaotic (see Figure 1).
“The website is not attractive.” — Bass Pro Shops user
“It has a cluttered appearance and doesn’t always have up to date inventory.” — Bass Pro Shops user
“The front page has a ton of information that could be overwhelming.” — Bass Pro Shops user
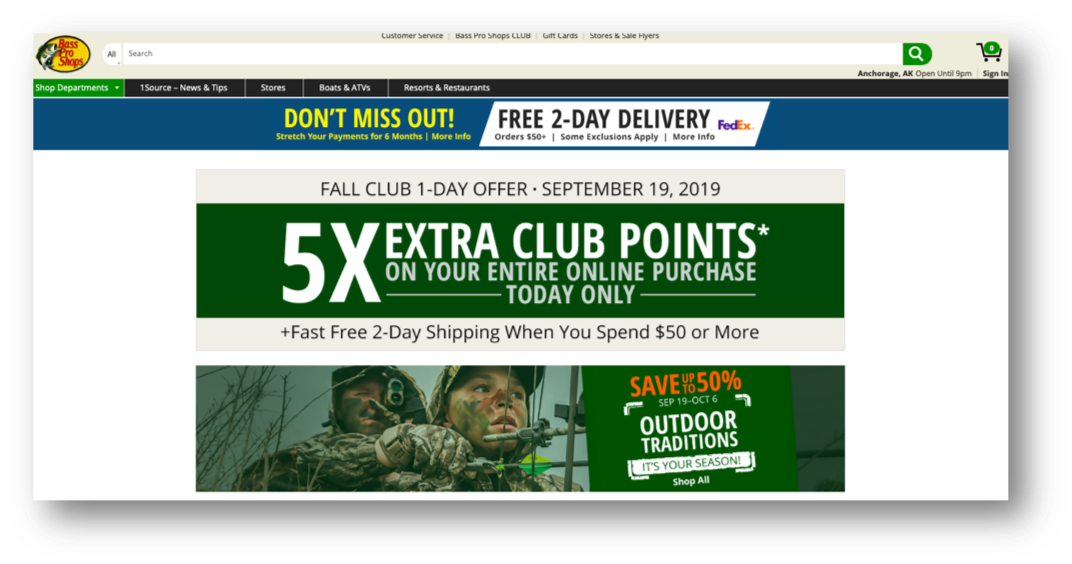
Figure 1: The home page of the Bass Pro Shops website is filled with promotions and was rated by users as less attractive compared to the other websites.
In-Store Availability and Pick Up a Challenge
Linking the online browsing to in-store pickup provides value and differentiation to users (something Amazon doesn’t have the capability to do yet). Sierra Trading Post was the worst relative performer, with 60% of customers not agreeing that they can easily pick up items in-store, followed by Bass Pro Shops, where 38% didn’t think the process was necessarily as easy as it could be. One Bass Pro shopper commented:
“I do wish you were able to easily see what products are in stock at your local store. Maybe an option to filter only products that are in stock locally.” — Bass Pro Shops user
Key Drivers: Sizing and Selection of Top Brands
We conducted a key drivers analysis to understand what aspects have the biggest impact on the perception of the website user experience.
The most impactful key driver for the outdoor retail user experience was the clarity of product options such as size and color. This element explained 33% of the variance in SUPR-Q scores. The good news for outdoor retailers is that 95% of the participants in this study agreed that it was easy to distinguish the product options. However, Sierra Trading Post, REI, and Dick’s Sporting Goods users did mention issues with sizing on the websites.
“Sizing can be difficult to find.” — REI user
“Missing lots of sizes.” — Sierra Trading Post user
“Not many reviews, limited sizing on items.” — Sierra Trading Post user
Making sizing options more transparent would improve the user experience on these sites.
The ability to find all top brands of interest explained 9% of the variance in SUPR-Q scores. Across all sites, 70% of participants agreed with the statement “the site has all the brands I’m interested in.” Only 56% of REI users agreed with this statement, while 84% of Backcountry users thought so.
“It does not always have what I am looking for.” — REI user
“I don’t like the selection of women’s footwear as much.” — Sierra Trading Post user
“The lack of variety in some sports such as Ultimate [Frisbee]” — Dick’s Sporting Goods user
The key drivers of the outdoor retail website experience are shown in Figure 2 and include clearly distinguished product options (33%), ease of finding products for all activities (9%), selection of all brands of interest (9%), and brand attitude (6%). Taken together, these elements explain ~58% of the user experience on these sites.
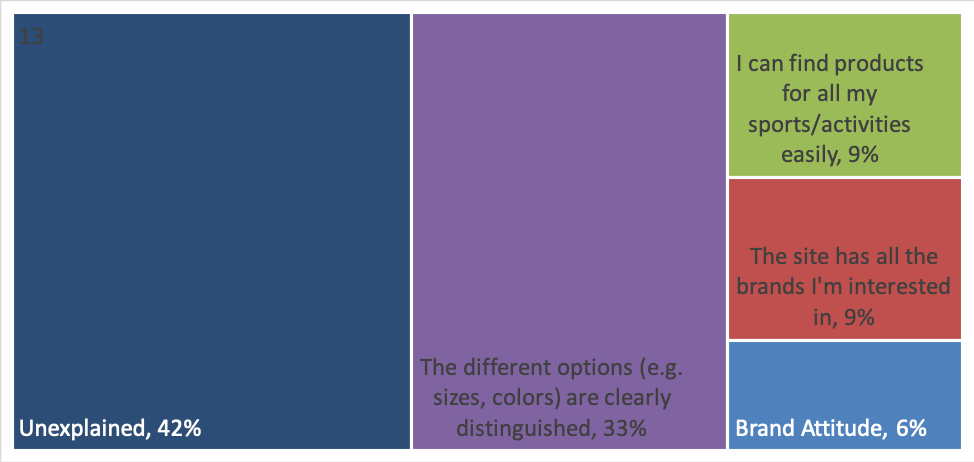
Figure 2: Key drivers of the outdoor retail website user experience (R-Sq = 58%).
Ratings (or Lack Thereof) Affect Online Purchase Decisions
Product reviews are one of the most influential aspects of the online purchase process. In our qualitative follow-up study using MUIQ, we observed all five of our participants relied heavily on reviews (or the lack thereof) when narrowing their selection.
Video 1: Participant from our qualitative follow-up in MUIQ commenting about the lack of reviews on the Bass Pro Shops website: “Reviews… there’s only one. That could be written by anybody.” Note: The participant explicitly gave us permission to share his video experience online.
While participants didn’t specifically call out lack of reviews in our retrospective benchmark (we also didn’t ask them to rate it), this finding from our MUIQ study reveals the importance of reviews and reinforces the value of a mixed-methods research services (quant + qual).
Video 2: Participant from our qualitative follow-up in MUIQ commenting about how the number of ratings and reviews helped him decide which tent to purchase: “This looks pretty spiffy to me. Thirty-seven 5-star reviews. I’m going to trust that! In real life if I was looking for a backpacking tent, I think I would be going with this.” Note: The participant explicitly gave us permission to share his video experience online.
Platform Access and Visit Intent
Most browsing happens on the desktop, but a substantial 70% reported accessing the website on their mobile device. Much fewer (18%) accessed the retailer’s native app, likely for lack of function and differentiation from the mobile web experience:
“It is very similar to the mobile website. I don’t really need a separate app.”— Backcountry user
When people visit websites, popular reasons for browsing include finding specific gear they have in mind (18%), looking for deals (14%), and checking prices (13%).
Finding Specific Gear
“I am usually looking to see if a particular item I want is in stock. Usually it is fishing gear, but not always.” — Dick’s Sporting Goods user
Seeking Deals
“I usually look for activewear or shoe prices to compare them to other retailers. This way, I can look for the best products and the best deals on those products.” — Dick’s Sporting Goods user
“I like that they have frequent sales and have good deals on the products.” — Sierra Trading Post user
Checking Prices
“I do a price comparison with Steep and Cheap to see if it’s cheaper on Backcountry, since Backcountry has free shipping on orders over $50 and Steep and Cheap doesn’t.” — Backcountry user
Summary
An analysis of the user experience of five outdoor retail websites found:
-
- Backcountry leads and Bass Pro Shops lags, but not by much. Recent users of five outdoor retail websites reported an above average experience (SUPR-Q scores falling at the 81st percentile). The outdoor retail websites were relatively close, scoring within five points of each other for overall SUPR-Q. Backcountry had the highest relative scores at the 83rd percentile, with Bass Pro Shops scoring the lowest at the 78th. Backcountry also had the highest NPS (25%) while Dick’s Sporting Goods had the lowest (-10%).
- Web to store experience is a differentiator (if done well). Browsing online and checking in-store availability for pickup differentiates these websites experiences from Amazon. Some websites did this better than others, with Sierra Trading Post having the most reported trouble followed by Bass Pro Shops.
- Reviews differentiate. In our qualitative follow-up study all five of our users relied on reviews to narrow their product decisions. The lack of reviews on some sites may inhibit purchases and potentially send online shoppers to seek reviews (likely on Amazon).
- Sizing options can be a pain, but overall, outdoor retailers do a good job. The most impactful key driver for the outdoor retail user experience was the clarity of product options such as size and color. This element explained 33% of the variance in SUPR-Q scores. The good news for outdoor retailers is that 95% of the participants in this study agreed that it was easy to distinguish the product options. However, there were still complaints from users on Dick’s Sporting Goods, Sierra Trading Post, and REI about limited sizing options and difficulty finding sizing information.
- Having all the top brands is important. The ability to find all top brands of interest explained 9% of the variance in SUPR-Q scores and across the sites and 70% of participants agreed with the statement “the site has all the brands I’m interested in.” Only 56% of REI users agreed with this statement, while 84% of Backcountry users thought so.
- Value is a main driver. Most (74%) of outdoor retail website users look for deals and discounts on these sites. There is variation in how well each website delivers with almost all (92%) of Sierra users agreeing the website offers good deals compared to 59% for Dick’s Sporting Goods.