 Drugstores seem to be on every city corner. They are a blend of convenience store, retailer, and pharmacy.
Drugstores are a type of mass merchant enterprise, but they fit in a smaller box than their big-box counterparts. According to Kentley Insights, the total 2020 drugstore revenue in the United States was $312.1 billion. Additionally, e-commerce drugstore sales grew 244.2% last year. The increase in online sales is at least partially due to changes in consumer behaviors during the COVID-19 pandemic.
The distinguishing characteristic of a drugstore compared to other mass merchant enterprises is the focus on the pharmacy as the primary service and source of revenue. Other mass merchants such as Target or Walmart may include pharmaceutical services as a peripheral rather than a primary service.
The local relationship people have with their drugstore often continues online. To understand the online user experience of drugstores, we benchmarked three major U.S. chains (as part of our larger mass merchant analysis):
We collected SUPR-Q® and Net Promoter data, investigated reasons for using the websites, measured users’ attitudes regarding their experiences, assessed components of UX, and analyzed reported usability problems.
Benchmark Study Details
In April and May 2021, 462 respondents from the U.S. participated in a retrospective study in people who had used at least one mass merchant website in the past year reflected on their experiences. Of these, 151 rated their use of the CVS, Rite Aid, and Walgreens websites.
Participants completed the eight-item SUPR-Q (which includes the Net Promoter Score) and the UMUX-Lite standardized questionnaire and answered questions about brand attitudes, usage, and their prior experiences.
Quality of the Drugstore Website User Experience: SUPR-Q
The SUPR-Q is a standardized measure of the quality of a website’s user experience, and it is a good way of gauging users’ attitudes. It’s based on a rolling database of around 200 websites across dozens of industries, including drugstores.
SUPR-Q scores are percentile ranks that tell you how a website experience ranks relative to the other websites (so the 50th percentile is average). The SUPR-Q provides an overall score and detailed scores for subdimensions of usability, trust, appearance, and loyalty.
The three drugstore websites averaged at the 77th percentile, above the overall SUPR-Q average but five percentile points below the mean for the other mass-market websites in the larger study. Of the three drugstores, CVS had the lowest SUPR-Q (64th percentile) and Walgreens had the highest (91st percentile).
We analyzed SUPR-Q scores separately for drugstores and the other mass-market merchants. Figure 1 shows the mean scores for the SUPR-Q subscales of Usability, Credibility, Loyalty, and Appearance. There was no difference in the overall SUPR-Q ratings (F(1, 460) = .77, p = .38) between mass merchants and drugstores, but the interaction between sector and subscale was highly significant (F(3, 460) = 7.03, p < .0001).
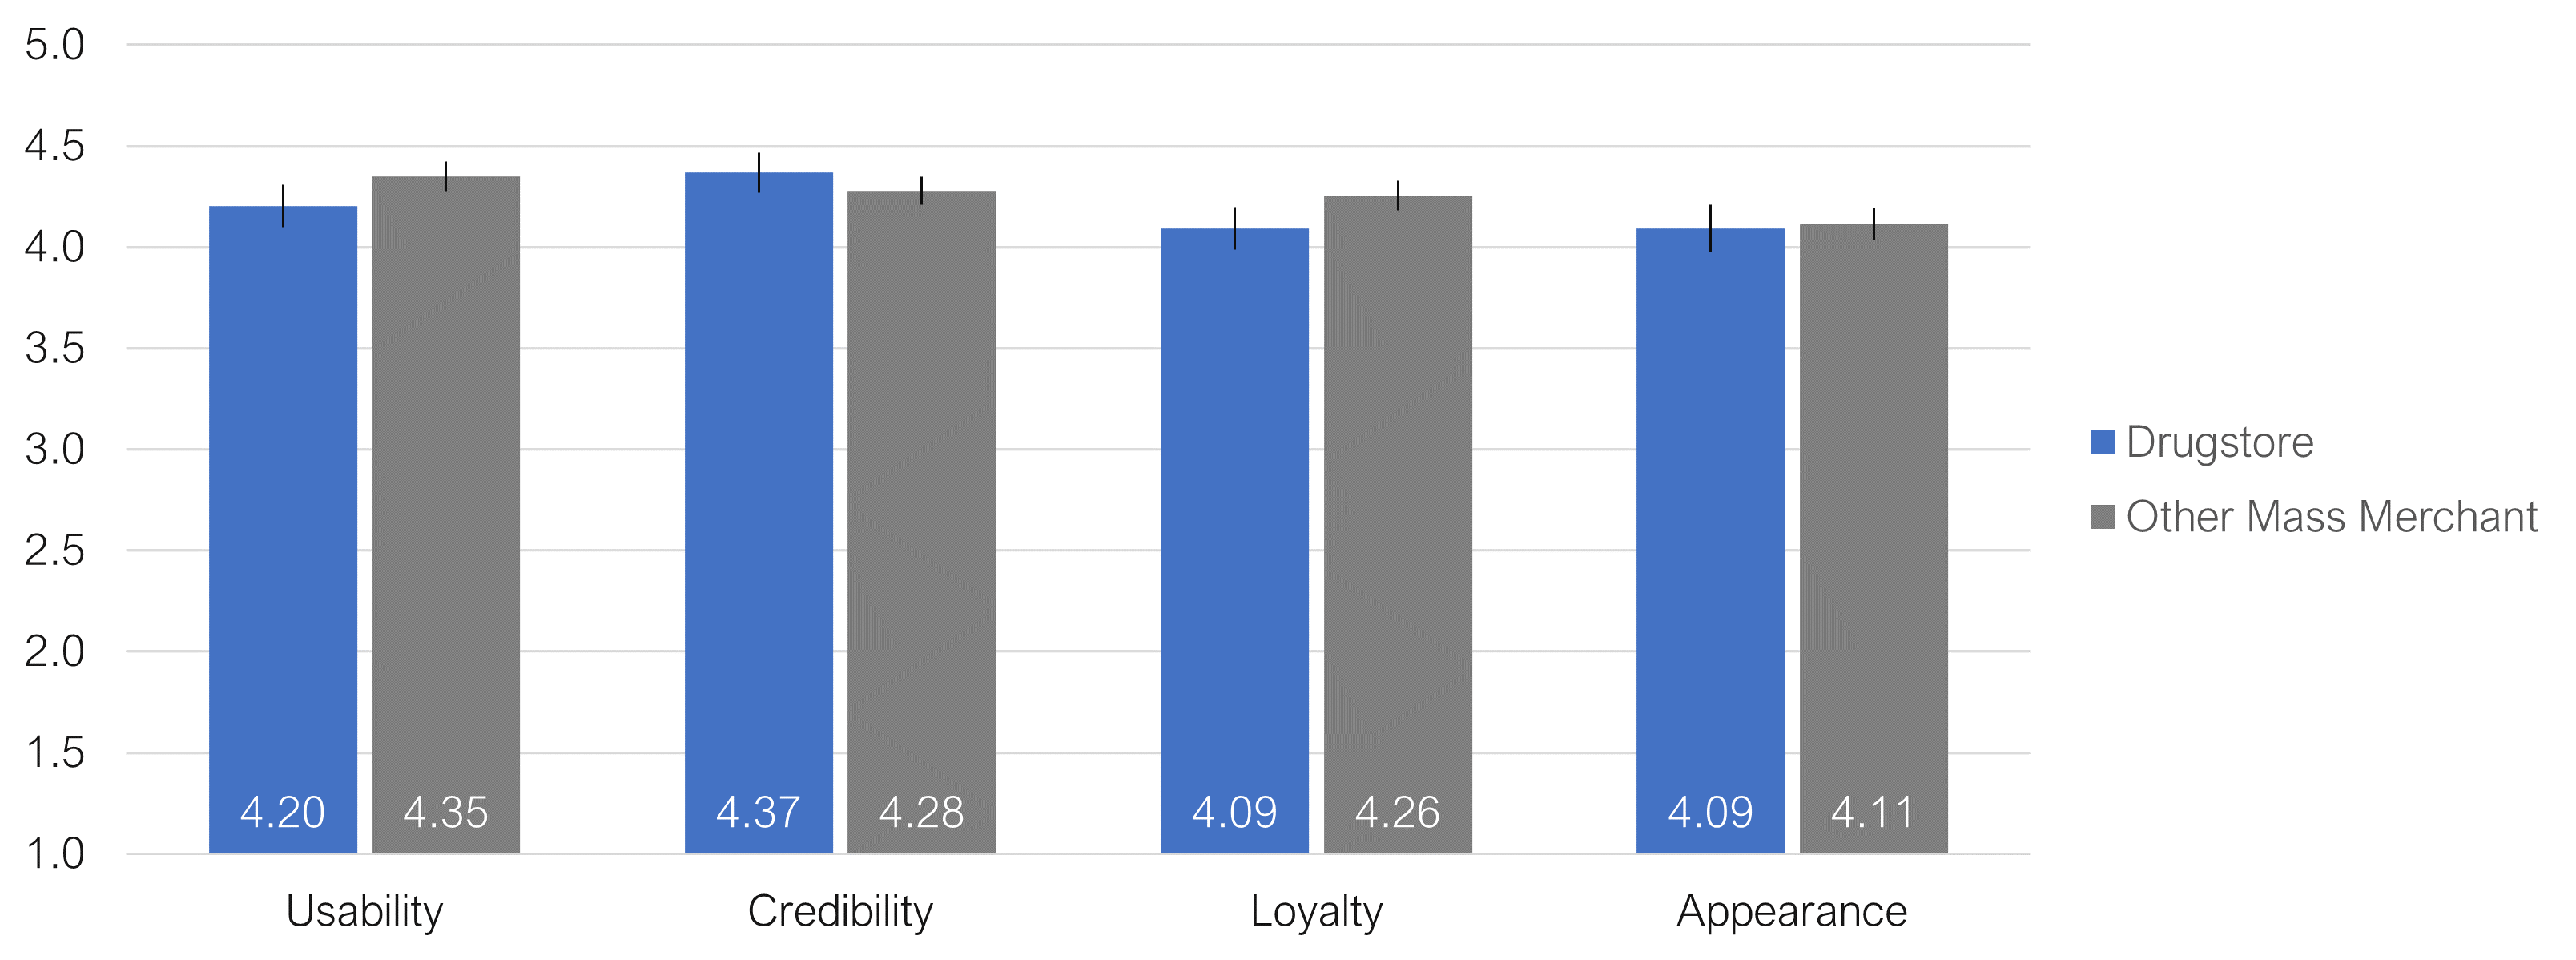
Figure 1: Comparison of SUPR-Q subscale ratings for drugstore and other mass merchant websites with 90% confidence intervals.
The patterns of the confidence intervals show no difference in ratings of appearance, but there were significant differences for the other subscales. Drugstore websites were rated lower for usability and loyalty, but higher for credibility.
Usability Scores and Trust
We asked participants to reflect on how easy they thought it was to use and navigate the websites. Walgreens had the highest drugstore score (86th percentile), and CVS had the lowest (48th percentile). Comments about the usability of the CVS website included
“If I am looking for something other than prescriptions it isn’t quite as friendly.”
“Hard to find certain products.”
Trust in the drugstores was reasonably high, with Walgreens at the 91st percentile, Rite Aid at the 84th, and CVS at the 79th.
Loyalty/Net Promoter Scores
The nine mass merchant websites in the larger study all had positive NPS (more promoters than detractors) with an average NPS of 25%. The mean NPS for the subset of the three drugstores was 14%, still positive but significantly lower than the other mass merchant websites (Z = 2.0, p = .046, using the adjusted-Wald test for comparing NPS). In general, a better user experience is a good predictor of higher loyalty.
Use of Drugstore Sites and Mobile Apps
As a part of this benchmark, we asked participants how they accessed online mass merchant services. All participants reported using their desktop/laptop computers (this was a requirement for participation in the survey). For the drugstores, 57% reported using mobile websites, and 34% reported using mobile apps, close to the percentages reported for all mass merchant websites in the study.
The typical frequency of use was a few times a month to a few times a year for drugstore websites and never for mobile apps. The most frequently used drugstore mobile app was CVS, with 20% reporting weekly usage.
Components of the Drugstore Website Experience
Across the websites, using a series of five-point agreement scales, we computed the top-two-box percentages of items that rate components of the mass merchant website experience. Focusing on the drugstores, the three highest-rated components were
- Product images are clear (89%)
- Product descriptions are clear (85%)
- It’s easy to navigate (82%)
The three lowest-rated components were
- It’s faster than going to a brick-and-mortar store (60%)
- My shopping experience was personalized (57%)
- The sponsored ads are relevant (50%)
What to Improve
Key areas of improvement cited by respondents for each drugstore website were
- CVS:
- Price (e.g., “Prices aren’t the same online and in-store.”)
- Cluttered site (e.g., “It can be a little too cluttered.”)
- Not user friendly (e.g., “It’s a little hard to figure out the pharmacy part of the website.”)
- Rite Aid:
- Item availability (e.g., “Doesn’t have everything I always look for.”)
- Price (e.g., “The prices seem inflated.”)
- Refresh site (e.g., “I find it to be clunky as the pictures and graphics are too large.”)
- Walgreens:
- Slow site (e.g., “I dislike how clunky and slow the website is in general.”)
- Having to sign in multiple times (e.g., “I dislike that my having logged into my account isn’t always recognized throughout my visit to the website.”)
- Ads (e.g., “Too many distracting side ads.”)
Although not necessarily the most frequent issue for all websites, numerous comments were related to finding items (e.g., availability, navigation, search, filtering).
For example, Video 1, captured with our MUIQ® platform in an unmoderated picture-in-picture think-aloud session, shows the participant having trouble finding a product on the CVS website.

Video 1: Participant searching for 6 oz. jar of VapoRub on the CVS website.
Summary and Takeaways
An analysis of the user experience of three drugstore websites found several primary considerations.
- Drugstore scores were above average. The drugstore websites had SUPR-Q scores ranging from the 64th to the 91st percentiles (the mean was at the 77th percentile. The 50th percentile is the average for all websites in our current normative database). The average NPS across the drugstore websites was 14% (more promoters than detractors, but significantly lower NPS than the other websites we studied from the mass market sector).
- Product images help; non-relevant ads hurt. Respondents agreed that the drugstore websites were easy to navigate, and the product images and descriptions were clear. The lowest-rated item in the survey concerned the relevance of sponsored ads.
- Drugstores differed from other mass merchant websites in ratings of usability, loyalty, and credibility. A SUPR-Q comparison of drugstores with other mass merchant websites found no difference in ratings of appearance. But ratings of credibility significantly favored drugstores, and ratings of usability and loyalty favored the other mass merchants.
- Availability, performance, and clutter were pain points. An analysis of verbatim comments revealed different pain points for the three websites. For CVS, the key areas of improvement were price, cluttered site, and not being user-friendly. For Rite Aid, respondents took issue with item availability, price, and the site design. Most comments about Walgreens had to do with the site being slow, having to sign in multiple times in a session, and the pervasive ads.
Full details are available in the downloadable report.