 Our attitudes both reflect and affect our actions.
What we think affects what we do and what we do affects what we think.
It’s not a perfect relationship of course. What people say or think doesn’t always directly correspond to actions in easily predictable ways.
Understanding and measuring user attitudes early and often can provide a good indication of likely future behaviors. Attitudes can be measured using short (ideally standardized) questionnaires (e.g. SUS and SUPR-Q), which can be administered after a study or experience or immediately after a task experience in a usability test (e.g. the SEQ).
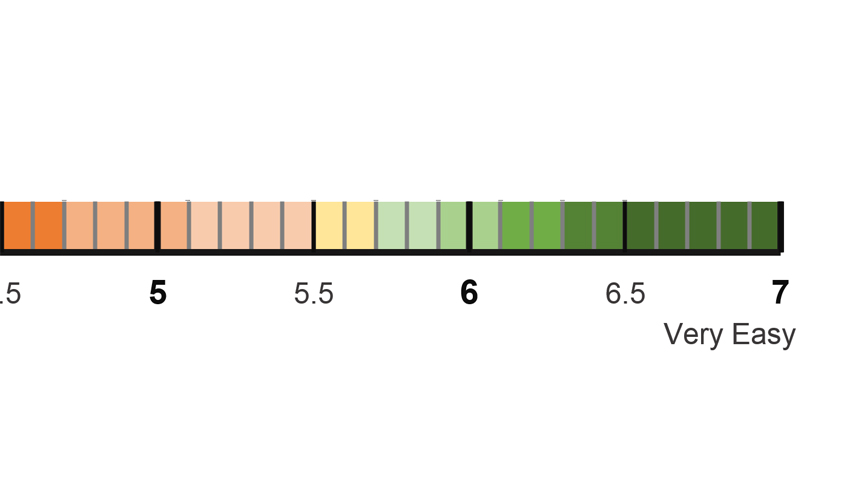
One of the more popular post-task questionnaires is the Single Ease Question (SEQ). It’s a single item that assesses how easy or difficult participants think a task is (Figure 1).

Figure 1: The Single Ease Question (SEQ).
We found this simple 7-point item performed as well or better than other short questionnaires [PDF]. We’ve presented the item labeled as both “Overall, this task was” or “How easy or difficult was this task?” and found the results indistinguishable.
Correlating Attitudes with Behavior
A fundamental issue in measurement is validation. We want our measures to be tied to reality. This is especially important when measuring attitudes, which can be fickle and hard to quantify. Validating attitudinal data like the SEQ involves showing how the numbers we assign to attitudes (things we can’t observe directly) correspond to actions (things we can observe directly).
In earlier published research we found that UX metrics have a medium to strong correlation with each other (between r = .4 and .6). The strength of this correlation changes depending on how the data is correlated and the context in which it’s collected.
One of the benefits of questionnaires is that they can be easily administered with an interface with any level of fidelity. Encouraging research has shown that ease of use questionnaires similar to the SEQ are reliable across prototype fidelity levels (from low to high).
There are times when collecting completion rate and task time data is challenging. This is especially the case when you can’t easily verify the results (in remote unmoderated studies) or because the prototype fidelity makes the task time seem too dependent on the fidelity (no load times, for example).
But how well do questionnaires like the SEQ correlate with (predict) task behavior as measured by completion rates and time?
SEQ and Completion Rates
To understand the relationship between the SEQ and concurrently collected completion rates, we aggregated mean SEQ scores and average completion rates across 286 tasks from data we’ve collected over the past few years in moderated and unmoderated studies. Each task had a sample size between 8 to 601 participants.
The SEQ and completion rates have a strong correlation (r = .66). This means that perception of ease (SEQ scores) can explain about 44% of task completion rates. This strong relationship shows that what participants think about what happened in a task generally corresponds to what actually happened (but not perfectly). This is similar to what we found with SUS scores.
To visualize this relationship, I converted raw SEQ scores into percentile ranks and then bucketed the scores into deciles (10 groups) along with completion rates as shown in Figure 2.
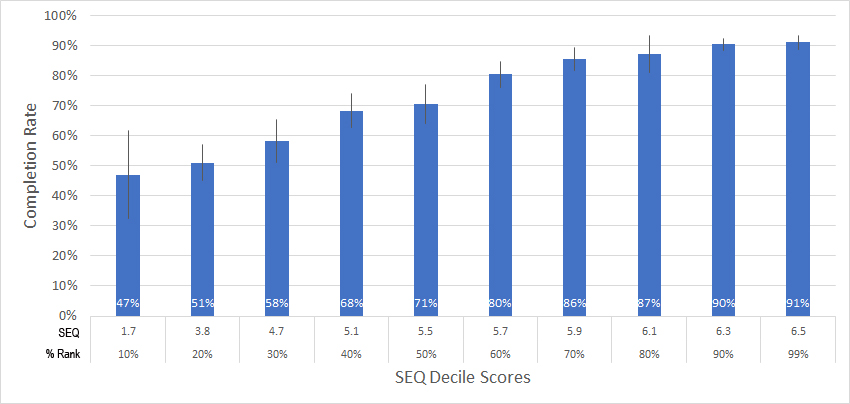
Figure 2: Relationship between SEQ scores (converted into deciles) and completion rates for 286 tasks.
For example, a raw SEQ score of 5.1 will correspond to a completion rate of about 68% (with a margin of error of around +/- 6%). A raw SEQ score of 6.3 will correspond to a completion rate of 90% (with a tighter margin of error of +/- 2%).
You can see the linear relationship is strongest in the middle (between the 30% and 70% SEQ deciles). After SEQ scores are above the 70th percentile (about a 5.9) the completion rates asymptote and level off at 90%. Conversely, after SEQ scores dip below the 30th percentile (a raw score below 4.7), the completion rate levels off at around 50%.
What’s also interesting is that not only does the completion rate go up as the SEQ goes up, but the margin of error also goes down (from about a width of +/- 6% at an SEQ of 4.7 to +/- 2% at an SEQ of 6.5), even with the same or smaller sample sizes at those higher levels (n= 40 and 28 respectively). In other words, the task completion experience becomes more stable and predictable at very high ease levels.
This finding is also consistent with our earlier research that showed that users were four times as likely to complete a task when they rate it at the maximum satisfaction versus the minimum satisfaction score.
SEQ & Task Times
I repeated this same services in looking at the relationship between SEQ and concurrently collected task times from 270 tasks (samples sizes between 8 and 601). The task times were for all participants, whether or not the task was completed successfully. We also found a strong correlation (r = .-53) between SEQ and the logarithm of task times (as tasks take longer, people’s perception of ease goes down). This means that perception of ease (SEQ scores) can explain about 29% of task times. Figure 3 shows this relationship.
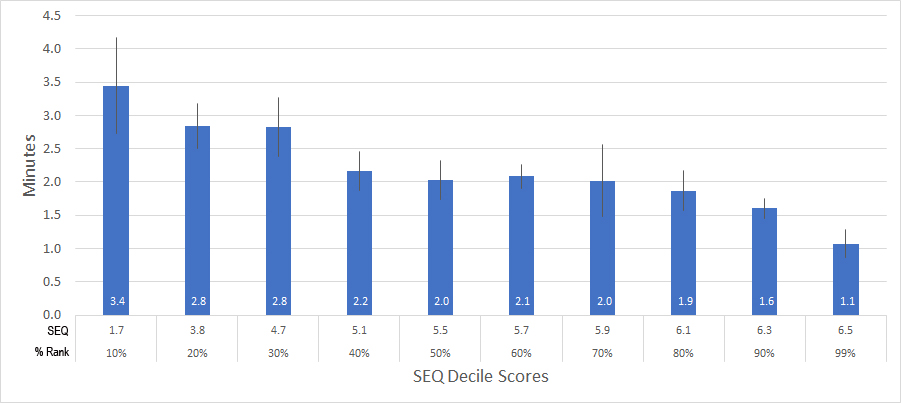
Figure 3: Relationship between SEQ scores (converted into deciles) and task times rates for 270 tasks.
While this confirms the relationship we observed almost 10 years ago with a more diverse aggregation of questionnaires, I was still surprised to see the strong pattern with task times.
That is, in theory, how long a task takes should be a function of the context. For example, if it takes two minutes to file your taxes online, that’s fast and should elicit higher SEQ scores. If it takes you 1 minute to log in, that’s excruciatingly slow and should elicit lower SEQ scores (even though it’s half the time of the other task). And maybe that is adding some noise to the data, which is why the correlation is lower than task completion (a good topic for future research). Nevertheless, there’s a solid relationship despite different task contexts.
I suspect the confined nature of usability testing (where the data came from in this analysis) may partially explain this correlation. In a typical usability test, multiple tasks need to be attempted in one sitting (both collected in moderated and unmoderated studies). With most usability tests lasting between 20 and 60 minutes, any given task can’t take too long and usually lasts under 5 minutes. In fact, in this data set, participants took on average 3.5 minutes to complete a task and the longest task average time was 10 minutes. Keep this in mind as you compare your times to ours, especially if the typical task duration differs from your testing setups.
Estimating with the SEQ
We can use the strong relationships to predict completion rates and task times from SEQ scores. Figure 4 shows the corresponding completion rate and task time for each SEQ decile and raw score.
You can use the data in Figure 4 to estimate completion rates and times, even if you collected the data and have only SEQ data. Or if you have collected the data (even from a small sample size), you can see how well it corresponds with our dataset.
For example, a raw SEQ score of 4.7 will correspond to a completion rate of 58% and task time of 2.8 minutes. A raw SEQ score of 5.9 will correspond to a completion rate of 86% and task time of about 2 minutes. The yellow bars show average SEQ performance, green above average, and red shows below average scores (which start around scores of 5).
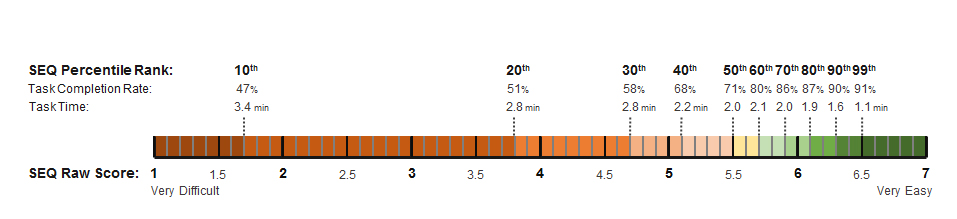
Figure 4: Relationship between SEQ scores, completion rates, and task times.
Summary
The simple one-item Single Ease Question (SEQ) is administered immediately after a task to gauge a participant’s attitude toward the just attempted task experience. Across over 250 task experiences, the SEQ tends to predict concurrently collected task completion rates and task time relatively well. Participants’ attitude about the ease of a task predicts about 44% of completion rates and 28% of task times.
Asking the SEQ after a task alone can provide some idea about the potential task completion rate and task time, even if these metrics aren’t collected on both prototypes and fully working websites and products.