 The Net Promoter Score (NPS) is widely used. But it’s not necessarily widely loved.
Some people are quite critical of the Net Promoter Score. Jared Spool wrote a strong critique of the NPS and Gerry McGovern largely agreed.
When I followed up with Jared about his thoughts, he felt that “UX researchers should not use the NPS or, if that’s not an option, ignore it.”
His sentiment taps into a lot of resentment some researchers have about feeling obligated to use the NPS.
But I think many of the concerns about the Net Promoter Score are less because of its inherent measurement flaws, but because it’s misused or used in the wrong context. Sort of like using a screwdriver to hammer a nail into the wall. It might get the job done, but there’s a better tool for the job. If the job is to uncover usability problems in a mobile app, or know what features to add to software, there are better tools for the job.
But the criticism should be less on the screwdriver and more on the decision to use (or on the decision for a company to require everyone to use) it.
The best time and usage for the NPS is the subject of another article. In my experience, it’s hard for a UX researcher to ignore the NPS when an organization uses it as a key metric. Instead, I’d like to help inform UX researchers by examining several criticisms and concerns so they’re better equipped to deal with the inevitable discussions.
Here is a summary of six common questions and concerns and the research I’ve found. I’ll also be discussing these points in Santa Clara, CA on Sept 26th 2018.
1. Does the NPS predict the future (of business metrics)?
If the NPS could have a headline in the New York Post, it would be: NPS PREDICTS THE FUTURE. That was one of the most compelling claims of the NPS and likely one of the main reasons so many organizations adopted it. It is at the heart of its validity—if it’s true. The NPS is intended to be a proxy for future company growth. But is it? After reviewing the published literature and our own data, I found the following:
- Some evidence shows the NPS predicts future company revenue growth and retention. I was able to uncover a relationship between the 2013 NPS and 2014–2016 revenue growth in the U.S. airline industry (after removing one large outlier). There was also only one published study I found that established a statistically significant relationship between the NPS and future business metrics (two-year customer retention). In the remaining published studies, including Fred Reichheld’s original article on the NPS, historical or very near-term revenue and metrics (not future revenue) was used.
- Strong evidence shows that the NPS correlates with historical and concurrent measures of business outcomes. Several studies, including Reichheld’s, have established a reasonably strong correlation with business metrics, such as revenue growth. This does provide strong evidence of concurrent validity, although it doesn’t support making claims about future company growth.
Takeaway:
Be cautious about making causal statements about the NPS and future or current revenue growth. The NPS seems to be a reasonable proxy for historical or current revenue in some industries and potentially for future revenue and likely self-reported customer retention. The causal relationship between the NPS and growth is unclear. Net Promoter Scores could be a consequence and not a cause of company growth or related to growth through another variable entirely (e.g. customer satisfaction). That is, more successful companies tend to have customers that are willing to recommend and hence generate higher Net Promoter Scores. Future research is needed to establish a causal link and such research needs to better manage the temporal precedence to establish causation: higher Net Promoter Scores need to precede higher revenue.
2. Is the Net Promoter Score better than satisfaction?
Satisfaction, like your father’s Oldsmobile, has been around for a while. But has it outlived its usefulness? The most important word in marketing is “New” and the NPS was presented as a new and better way of measuring customer attitudes (it’s not your father’s Oldsmobile). But is it any better than the old stand-by measure of satisfaction?
I reviewed several published studies comparing the NPS and satisfaction and examined the U.S. airline industry growth rates and found actually that the NPS performed the same or worse than satisfaction in predicting future business metrics.
While I was able to show the NPS could predict future growth rates in the airline industry, two other measures of satisfaction (JD Power and Consumer Reports) actually did a slightly better job.
Takeaway:
The NPS may be a better measure than customer satisfaction for other reasons (such as simplicity, executive understanding, or availability of external benchmarks) but there’s little evidence to suggest the NPS is universally (or ever) better than customer satisfaction measures for predicting revenue growth.
3. Should there really be 11 points in the scale?
The item that is used to create the NPS is a single question: How likely are you to recommend the {product/brand/website} to a friend or colleague? The response option is an 11-point scale anchored with not-at-all likely to extremely likely (Figure 1).
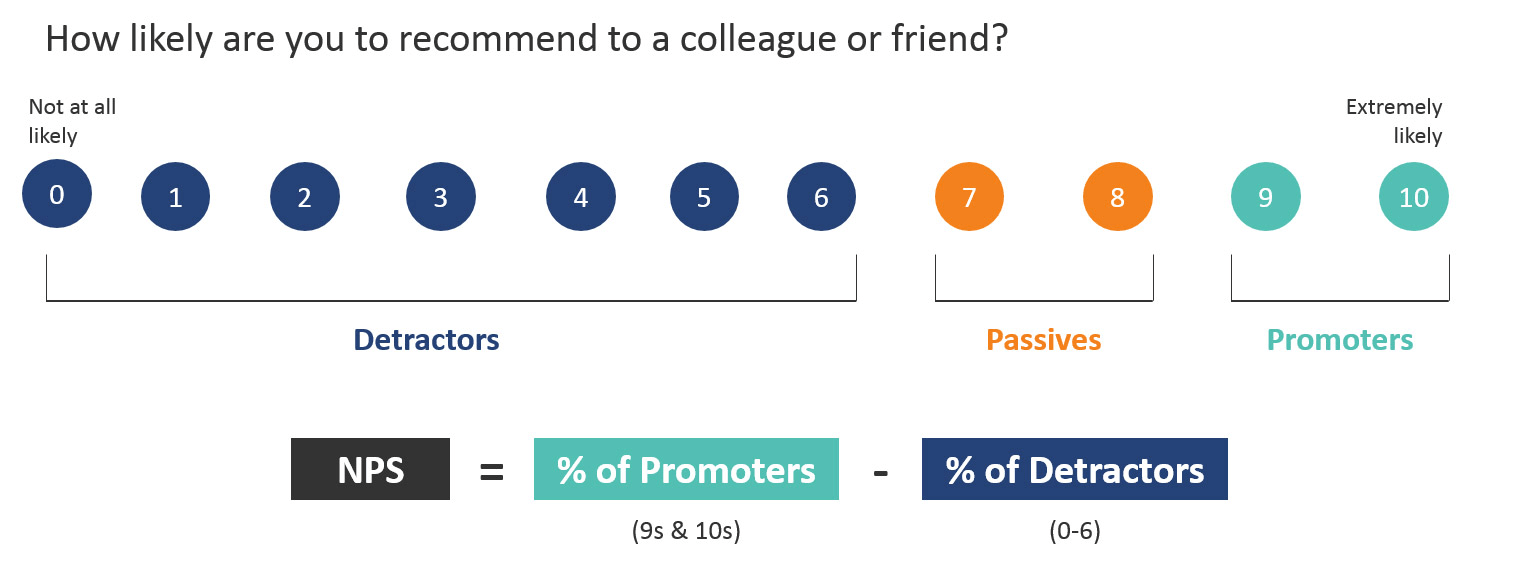
How critical are the 11 points? Would 7, 5, or even 3 be better? In general, when you have fewer items in a questionnaire, having more response options (11 vs 5 or 3) will improve the reliability, to a point. But what if you change the scale to 10 or 5 points instead? Are these superior?
To help understand the effect of the number of response options, I had 520 U.S.-based participants respond to three variations of the NPS in randomized order (5, 10, and 11-point versions). I found that changing the NPS scale affects the scores (a little)—an average absolute difference of 4 percentage points and as high as 14 points for one brand.
My analysis suggests that most differences in changing scales are small (and often influenced more by sampling error). But regardless of the scale used, Net Promoter Scores stayed within a range. For example, Netflix consistently had a high score (in the 60s), Facebook an average score (20s to 30s), and Comcast a very low score (-50s to -60s), regardless of the scale used.
Takeaway:
Keep consistent and don’t obsess over the number of scale points. If you have historical data using a 10 or 5-point version, stick with what you’re using. There’s little benefit in changing to an 11-point version if you have historical data but keep in mind your NPS will have some comparison error (this analysis suggests around +/- 4%) and will differ from external benchmarks. And there’s even less benefit from changing from an 11 point to a 10, 5, or 3-point scale.
4. Is a single item sufficient to measure a construct?
Customer loyalty and intention to recommend can be complicated to measure and certainly to predict behavior. Can a single 11-point item do the trick, or is a single item bound to fail?
I reviewed the history of multi-item scale recommendations and conducted our own study using the NPS. I found that despite being frowned upon in the published literature, single item measures are likely adequate for some constructs. For simple (one-dimensional) or concrete constructs that are well understood, a single item may suffice: customer satisfaction, job satisfaction, likelihood to recommend, advertisement favorability, brand favorability, and perceived ease of use. What little is gained in internal consistency reliability may be offset by the burden of additional items and possibly additional response error.
Multi-item measures are better for complex constructs. More items mean more coverage of content and higher content validity. For example, the SUPR-Q is a measure of website UX quality and taps into multiple constructs (trust, usability, appearance). It’s not possible to ask about all these concepts in a single item.
Takeaway:
Single items are probably adequate for simple constructs but using more response options (7 or more) for single items is recommended. Few points of discrimination mean you need large sample sizes to differentiate changes over time or between products. A justification for the NPS’s underlying 11-point scale, but not necessarily scoring system; see below.
5. Is the NPS reliable?
Reliability assesses how consistently people respond to the same items. A measure needs to be reliable to be valid—measuring what it intends to measure. That is, you can’t say you have a valid measure of satisfaction, ease of use, or loyalty if the measure isn’t AT LEAST consistent each time you use it.
By far the most common way to measure the reliability of questionnaires is using internal consistency reliability as measured by Cronbach’s alpha. It’s not because this is necessarily the best method. It’s quite simply because it’s the easiest to derive. But internal consistency reliability, by definition, needs more than one item to compute. This makes measures like the Net Promoter Score, the Single Ease Question, and other single item measures difficult to gauge reliability from a single sample. For this reason, there’s no published measure of reliability (from what I could find) of the Net Promoter Score.
The best way to measure its reliability is to correlate participant responses after some amount of time—something called test-retest reliability. We conducted a two-part study using 2,529 U.S.-based online participants to assess the test-retest reliability of the Likelihood to Recommend item for a subset of the top 50 U.S. brands measured about one month a part.
From the analysis we found that the Net Promoter Score’s test-retest reliability was relatively high (r=.75) and higher than single measures of satisfaction and brand attitude. While there is little consensus on what constitutes “adequate” or “good” reliability, a correlation of r=.75 certainly places it as high as many other measures in the literature.
In addition to correlation, the average difference in mean LTR scores differed by only 1.2% over the two time points. The difference was not statistically significant and actually lower than satisfaction with the brand and the same as brand attitude, which may be a function of them using fewer scale points (7 vs 11) and not the actual question.
Takeaway:
The single item used to compute the NPS exhibited sufficient reliability, at least as high or higher than other single item measures. This suggests the reliability of the NPS shouldn’t be a primary concern when deciding to use or ignore it.
6. Is the NPS scoring system “wacky”?
A popular technique used often by marketers to interpret rating scale data is the so-called “top box” and “top-two box” scoring approach. The major problem with these top box approaches is that you lose information in the transformation from rating scale to proportion. Should a person who responds with 1 on a 5-point scale be treated the same (computationally) as one who provides a neutral (3) response? The issues seem even more concerning on the 11-point LTR item. Are 0s and 1s really the same as 5s and 6s when determining detractors? Or is the NPS scoring system “wacky” as Spool suggests?
Fred Reichheld and others have argued that, in fact, it’s not the mean companies should be concerned with, but rather the extreme positive responders, which have a better association with repurchasing (company growth). In examining the published literature and some of our own data, we did find some support for the idea that extreme responders to rating scales (top box and bottom box scores) may predict behavior better, especially when it exhibits a non-linear pattern. In other words, there seems to be some justification for paying attention to the extreme responders.
Further, there is some evidence the bottom box might be as important: Extreme negative attitudes (e.g. losing what’s expected) predicts behavior better, especially in cases when customers expect an attribute in a product or service.
Takeaway:
Using top box scores loses information and increases uncertainty around the mean. However, some of the data might be worth shedding. Some published research and our own analysis have found that in some situations (when behavior is non-linear and asymmetrical), more extreme responses are a better predictor of behavior. Additional research is needed to understand the limitations and extent of this relationship. There’s little harm in tracking and aiming to improve both the mean and the extremes in customer loyalty.
Conclusion
How harmful is the Net Promoter Score? When used as intended, not too harmful. As a tool to measure customer attitudes (loyalty) and portend future growth, it’s adequate but not exceptional. Like any tool that’s used for the wrong reason, it can lead to less than optimal results.
The data so far suggests the NPS is a reliable measure and its single-item top-box scoring system correlates with current and historical revenue and may predict future growth in some circumstances and in some industries. But there’s little evidence the NPS is better than customer satisfaction.


