 How hard is it to figure out the total cost of a mobile phone service plan? Have you had trouble finding the customer support number for your cable provider?
How do you quantify these experiences? What words would you use to describe them?
While we have ways of measuring perceived ease using numeric scales, rating scale means can be harder to interpret—what does 5.3 mean?
It’s difficult and time-consuming to develop standardized UX items and questionnaires. We know—we’ve developed quite a few over the years.
After going through the process of crafting items, ensuring content validity, achieving adequate levels of reliability, and demonstrating concurrent validity, you’re still not done. You need to be able to interpret what the measurements mean.
For example, consider the System Usability Scale (SUS). Informally introduced to the usability engineering community in 1986, it wasn’t published until 1996, and it wasn’t until 2008—over 20 years after practitioners started using it—that a group of researchers (Bangor, Kortum, & Miller, 2008) published an initial set of data for interpreting SUS scores. Ten years after that, based on the published literature and our research, we published an article describing five ways to interpret a SUS score, including percentiles, a curved grading scale, acceptability rating scale, an NPS category scale, and an adjective scale.
Of these, one of the most popular methods is the adjective scale, developed by Bangor et al. (2009), which has six levels—Worst Imaginable, Poor, Fair, Good, Excellent, and Best Imaginable.
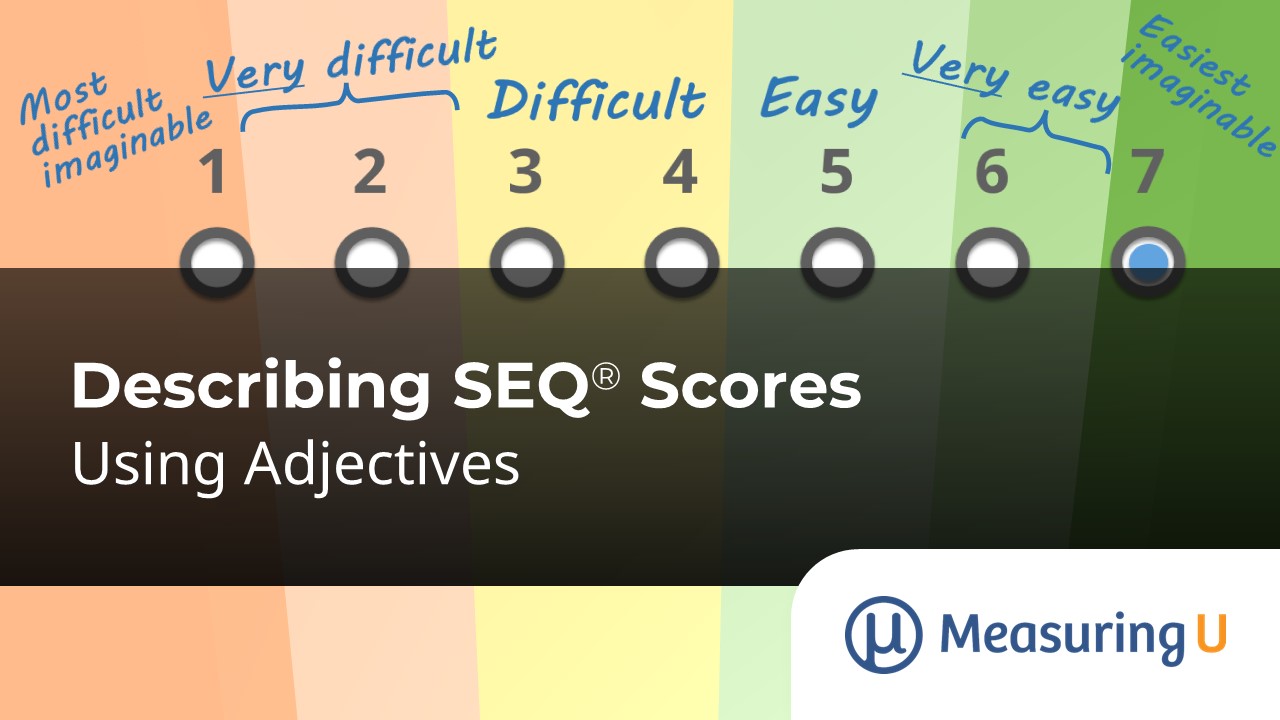
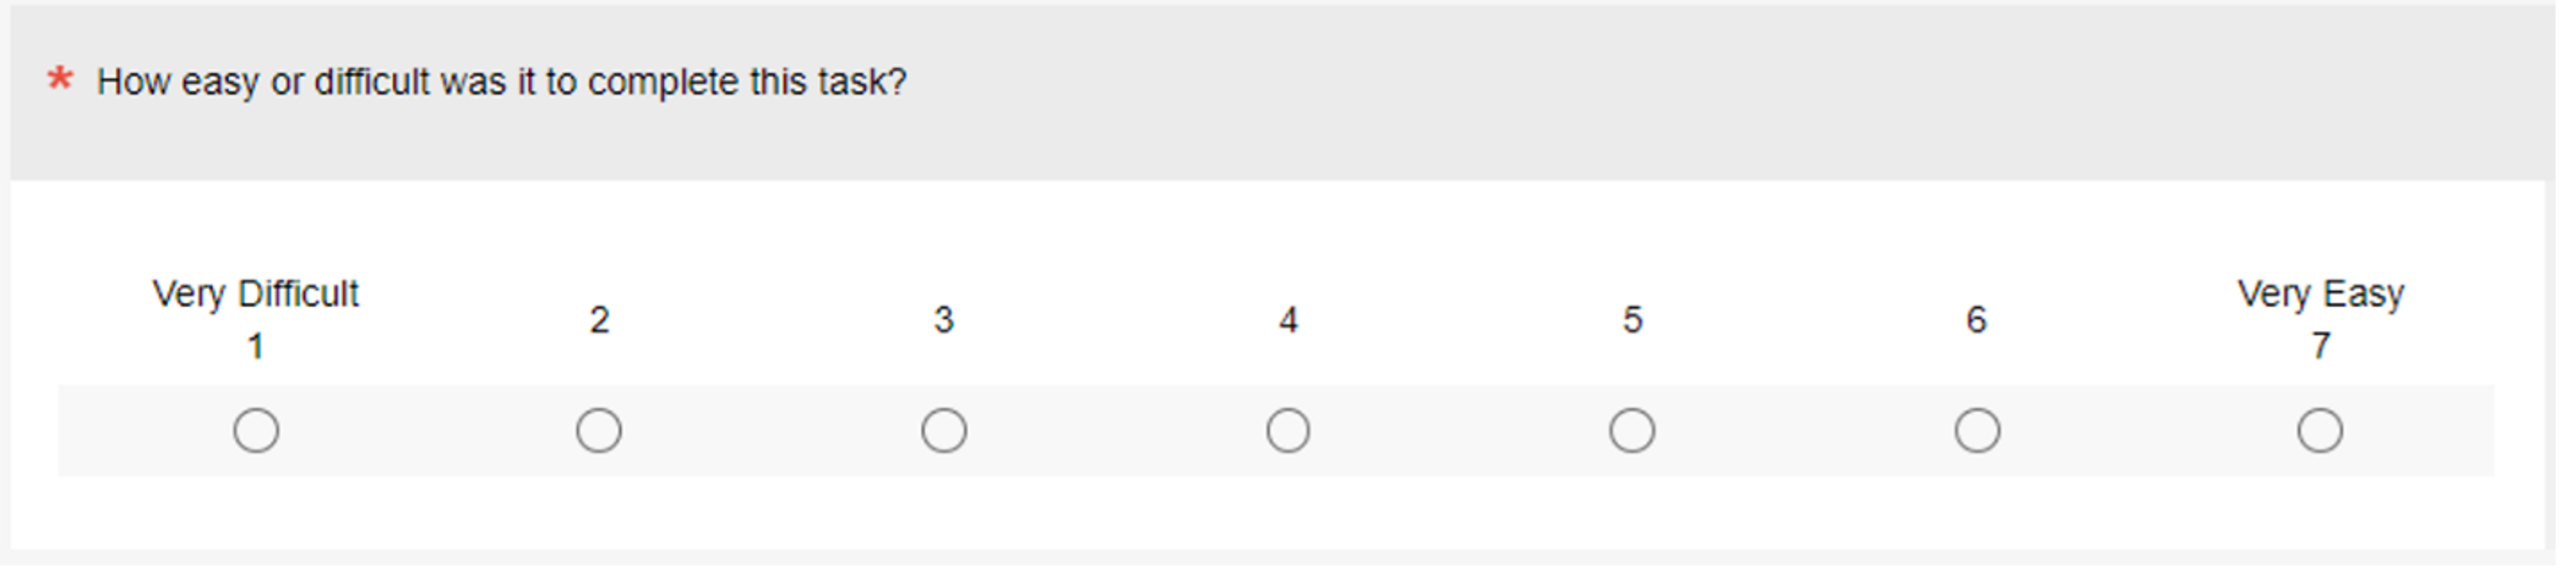
This brings us to the Single Ease Question (SEQ®), a widely used single item for measuring the perceived ease of task completion (Figure 1).
Since the initial publication of the SEQ in 2009 [PDF], we’ve published various ways to interpret its scores, including a percentile scale with connections to task-completion times and task-completion rates. This article adds to that literature by describing the development of an adjective scale for interpreting the SEQ.
Study Details
As part of a larger experiment we designed to compare different versions of standard rating scales, we used our MUIQ® platform to collect data from 211 participants (sampled from a U.S. panel provider in two unmoderated studies; 103 in February 2023 and 108 in March 2023). In a completely within-subjects experimental design, participants completed five exercises that were a mix of retrospective and task-based activities with varying difficulty, presented in random order (Table 1).
| Task Code | Type | Activity Description |
|---|---|---|
| XFI | Task-based | Imagine you are helping your friend troubleshoot a problem with their cable TV and internet service. Find the Xfinity customer service phone number to call for support. |
| ATT | Task-based | You will be asked to find the monthly cost of an iPhone 14 with a specific plan on the AT&T website. Copy or remember the monthly cost (including all fees). |
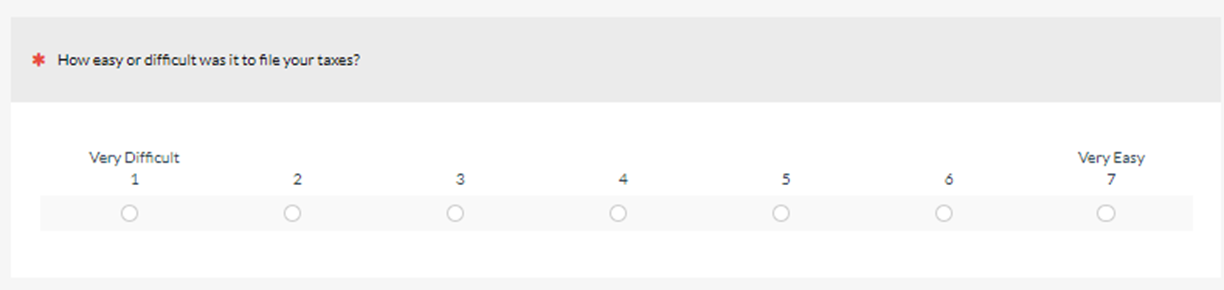
| TAX | Retrospective | Reflect on the last time you filed your taxes. |
| SHA | Task-based | One of the numbered figures in the drawing below is more different than the others. What is the number in that figure?" (Note: The fourth figure had six sides while all the others had four.) |
| AMA | Retrospective | Please reflect on your most recent purchase from Amazon.com. |
After each task, respondents provided three ratings of perceived ease: the SMEQ, the SEQ® (Figure 2), and a new adjective scale for task ease/difficulty (Figure 3), presented in random order on an exercise-by-exercise basis.
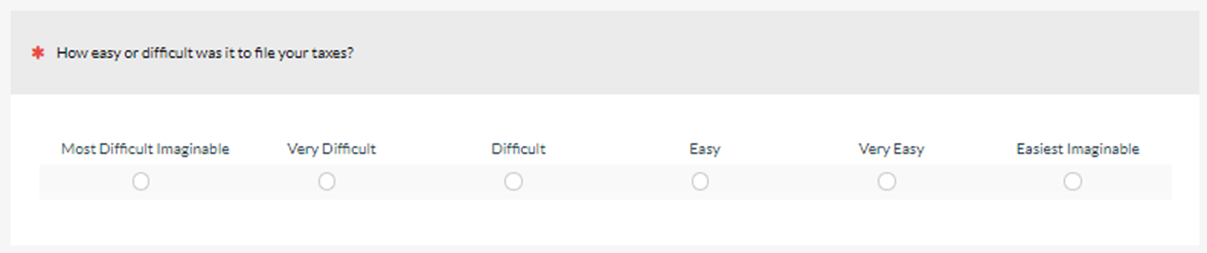
We collected data from different versions of the SMEQ in these two studies and will publish those findings in a future article, but this article focuses on the relationship between the SEQ and the ease/difficulty adjective scale. Specifically, how do SEQ scores correspond to the new adjective scale?
Study Results
For this article, we needed to establish two things. First, did the tasks cover a wide range of perceived ease, and second, what was the correspondence between SEQ and adjective scale ratings?
Range of Perceived Ease of the Five Tasks
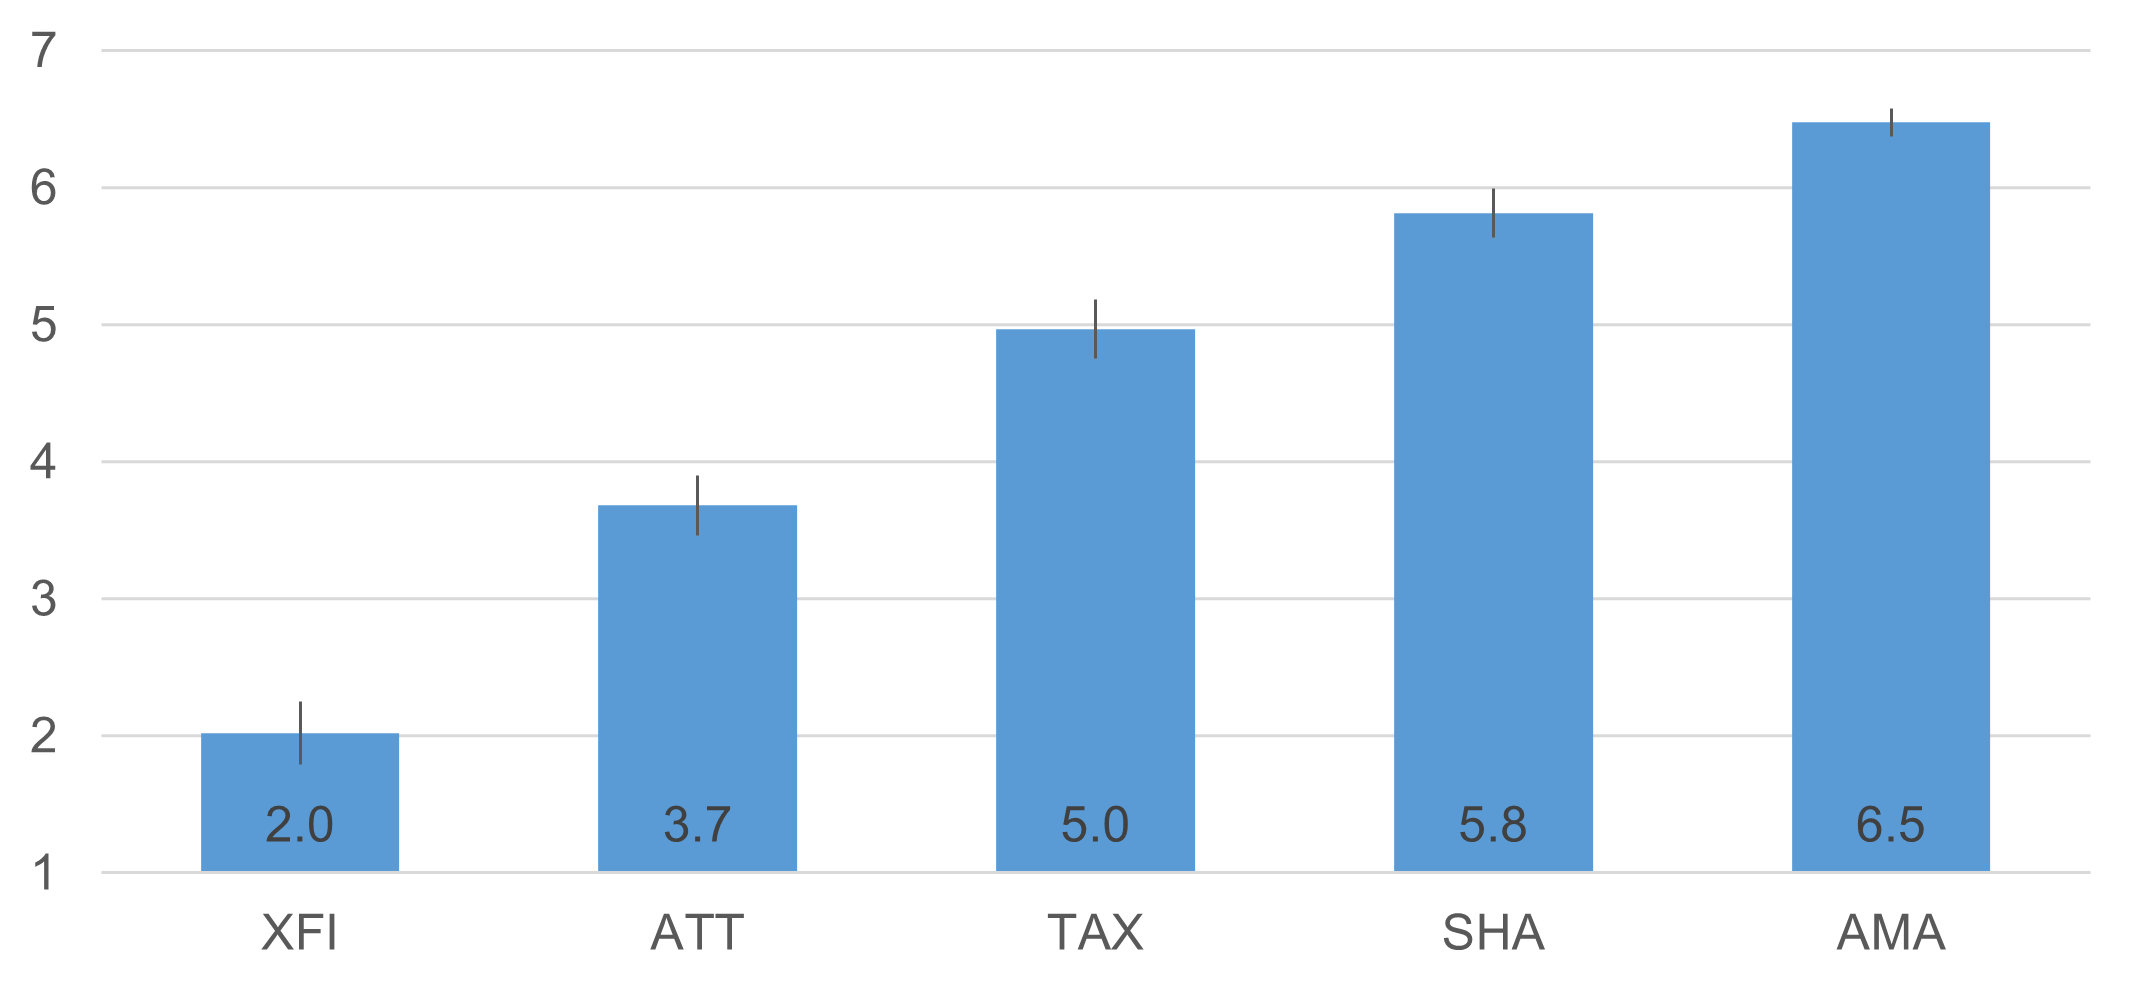
Although statistically significant, the difference between the study means was just 0.2 (3.4% of the range of the seven-point scale). In contrast, the difference between XFI and AMA means was 4.46 (74.3% of the range of the seven-point scale). Analysis of variance indicated significant main effects of study (F(1, 209) = 4.85, p = .03) and task (F(4, 836) = 331.4, p < .0001), but no interaction (F(4, 836) = 1.0, p = .41).
Figure 4 shows that the tasks covered a wide range of perceived ease, from 2.0 for the most difficult task to 6.5 for the easiest.
Correspondence Between SEQ and Adjective Scale Ratings
Figure 5 shows the mean SEQ ratings associated with each level of the adjective scale (averaged over tasks and surveys), and Table 2 shows the ranges for interpreting SEQ ratings with each adjective. The shape of the curve in Figure 5 is slightly nonlinear, but the magnitude of the mean of the correlations between the SEQ and adjective scale response options (after assigning the numbers 1 through 6 to the adjectives) is high (r = .83), indicating a strong linear component. To compute the ranges, we found the value midway between the mean SEQ for each response option in the adjective scale. For example, the mean SEQ for participants who selected “Most difficult imaginable” on the adjective scale was 1.00 and the mean SEQ for “Very difficult” was 1.93, so the midpoint rounds to 1.5.
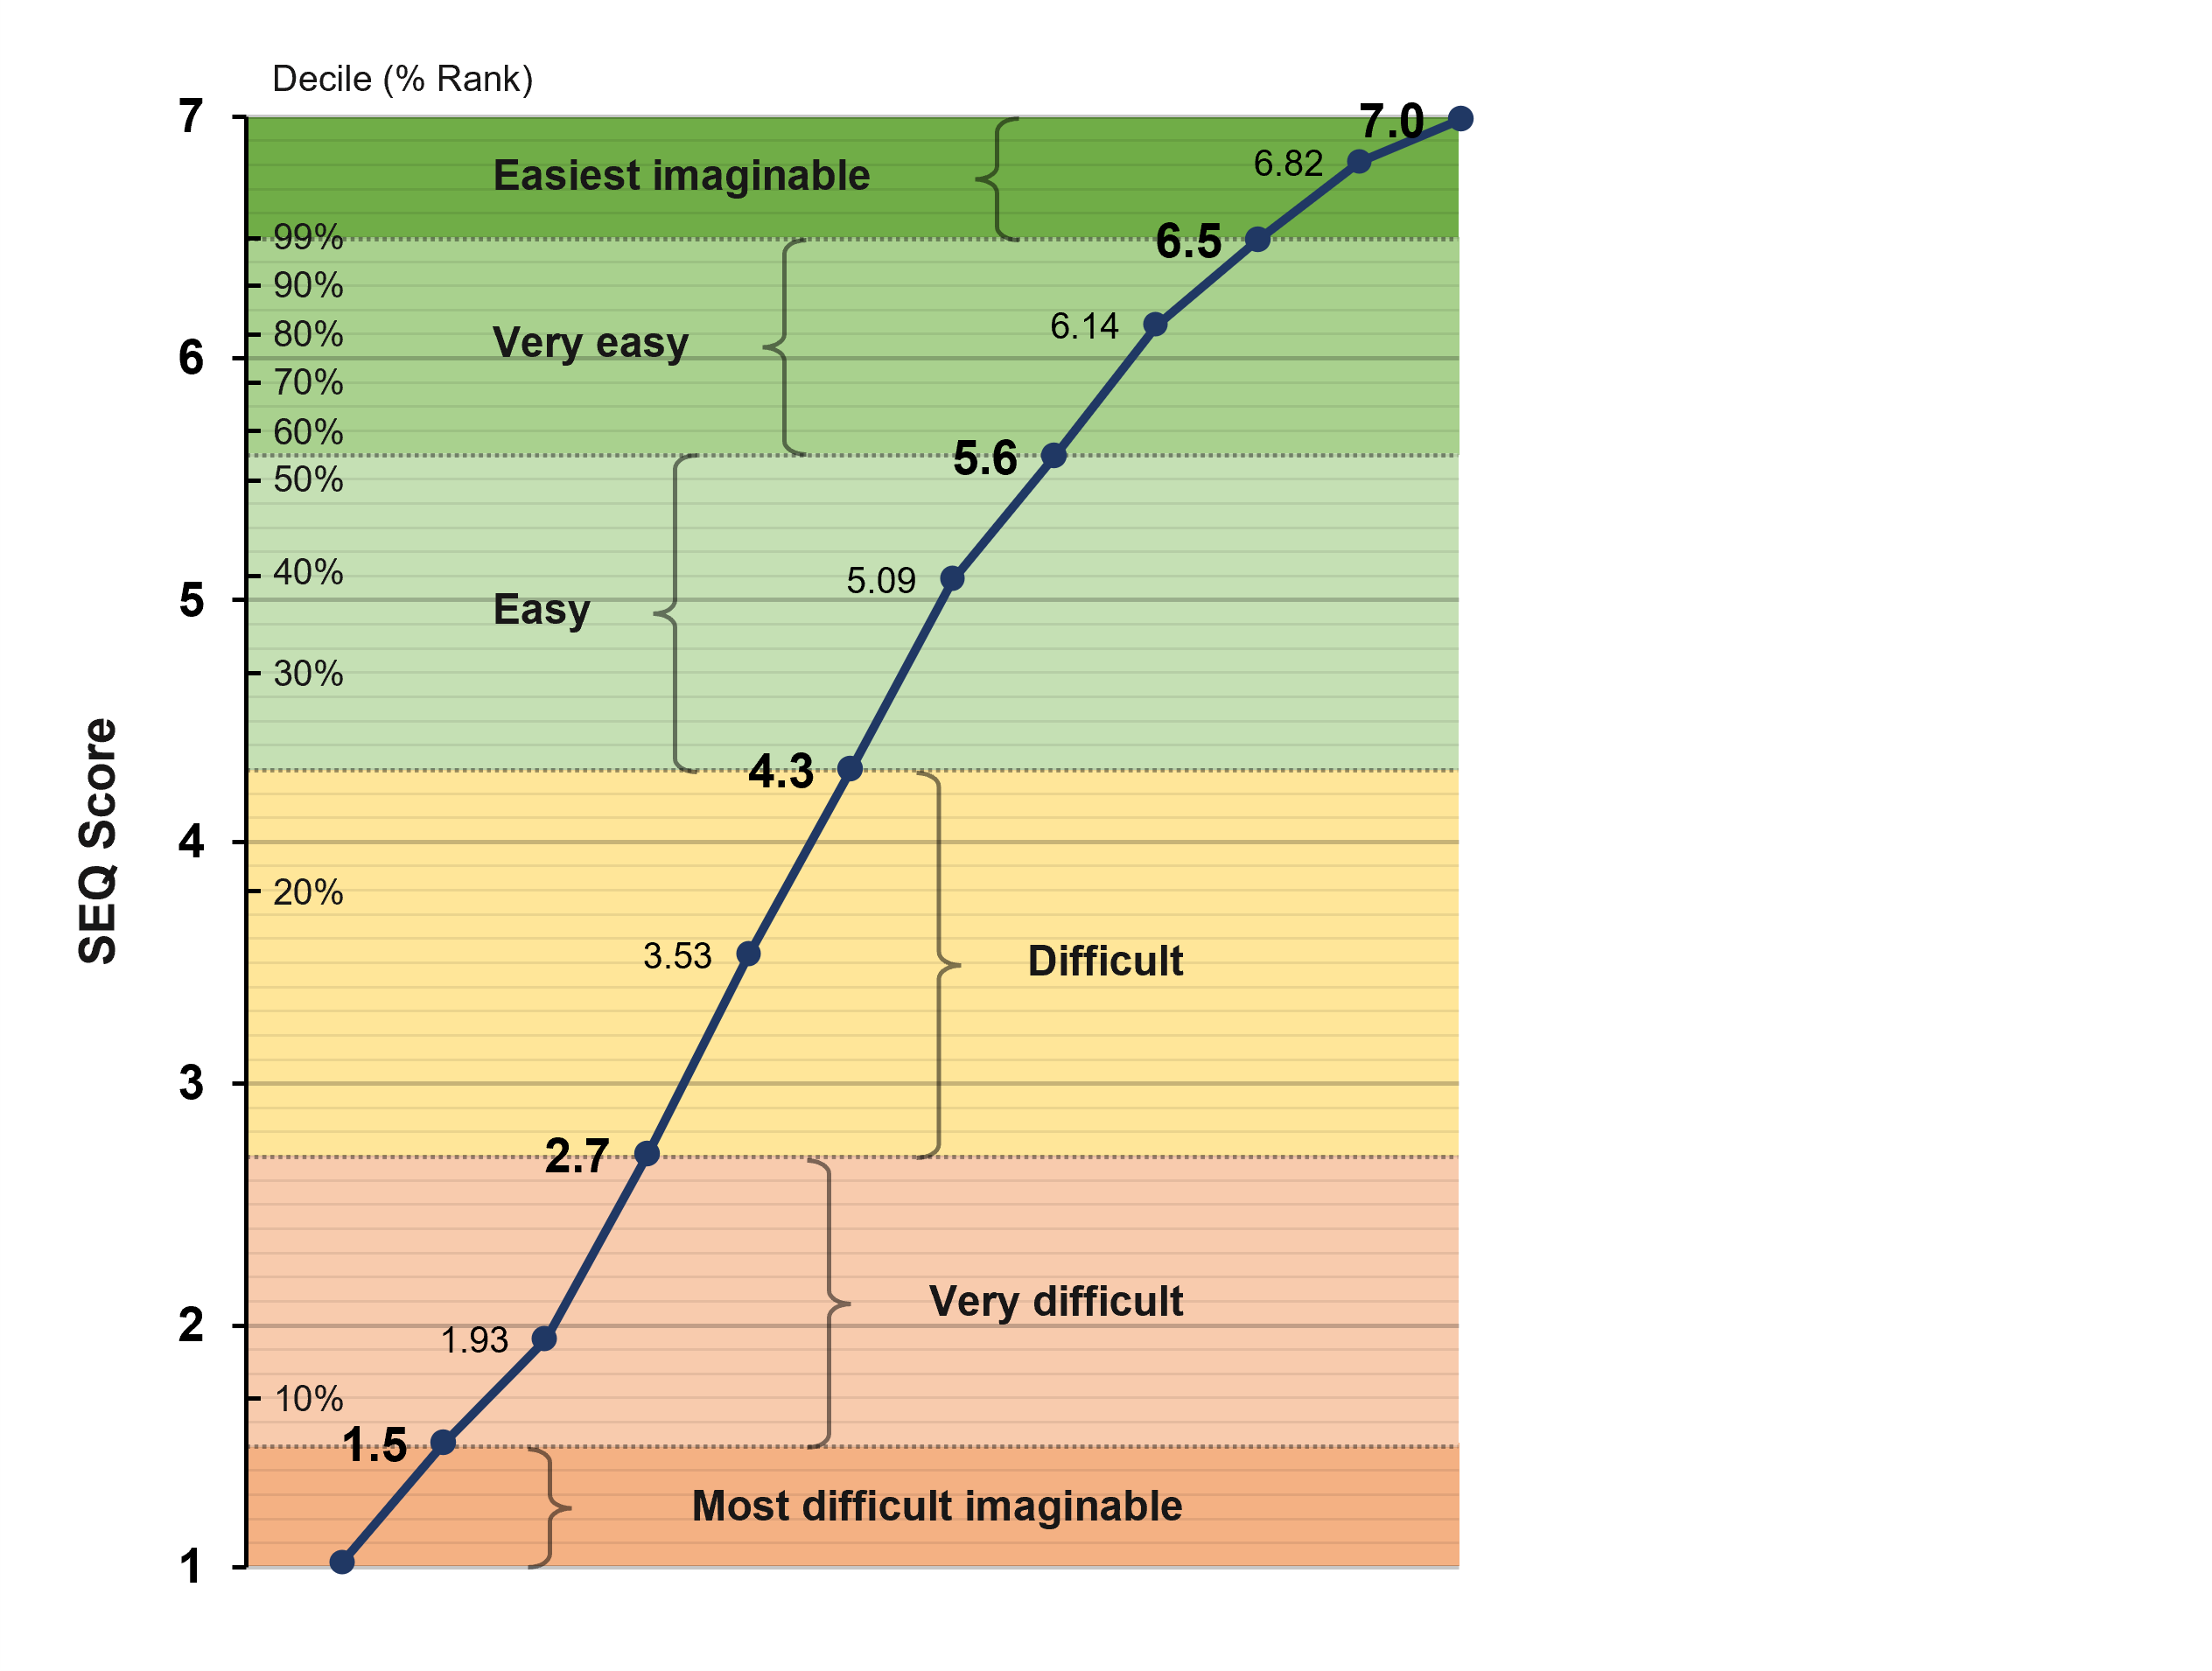
| Adjective Scale | Low | Mean | High |
|---|---|---|---|
| Most difficult imaginable | 1.00 | 1.00 | 1.49 |
| Very difficult | 1.50 | 1.93 | 2.69 |
| Difficult | 2.70 | 3.53 | 4.29 |
| Easy | 4.30 | 5.09 | 5.59 |
| Very easy | 5.60 | 6.14 | 6.49 |
| Easiest imaginable | 6.50 | 6.82 | 7.00 |
Using this table, the interpretation of our historical average SEQ of 5.5 would be at the upper end of Easy. Or, put another way, most tasks we’ve measured are “easy.” Table 3 shows how the full range of our historical deciles for the SEQ match up with this new adjective scale, showing that historically we have rarely asked participants to do tasks so difficult that the mean SEQ is less than 2 or so easy that the mean SEQ is greater than 6.5.
| Decile (% Rank) | SEQ | Adjective |
|---|---|---|
| 10% | 1.7 | Very difficult |
| 20% | 3.8 | Difficult |
| 30% | 4.7 | Easy |
| 40% | 5.1 | Easy |
| 50% | 5.5 | Easy |
| 60% | 5.7 | Very easy |
| 70% | 5.9 | Very easy |
| 80% | 6.1 | Very easy |
| 90% | 6.3 | Very easy |
| 99% | 6.5 | Easiest imaginable |
Discussion and Summary
Numbers by themselves don’t mean much unless they can answer the question, “Compared to what?” Since the initial publication of the SEQ, we’ve explored different ways to interpret its scores (e.g., a percentile scale with connections to task-completion times and successful task-completion rates). With this new research, we’ve worked out how to describe SEQ scores with descriptive adjectives of relative difficulty or ease of completing tasks based on data from 211 participants who rated five online tasks of varying difficulty (two retrospectives and three immediately after performing the task). Our key findings were:
The tasks used in this research covered a wide range of perceived ease. The difference in mean SEQ ratings for the most difficult and easiest tasks (ranging from 2.0 to 6.5) was equal to almost 75% of the range of the SEQ scale (from 1 to 7).
The correspondence between SEQ means and adjective scale response options was strong. Although there was some appearance of nonlinearity in their relationship, there was a strong linear component (mean correlation of .83), with increasing SEQ means for each level in the adjective scale.
These findings should be widely generalizable. The combination of the breadth of coverage of task difficulty and the strong linear trend gives us confidence that these findings should be generalizable within the covered range of task difficulty (2.0 to 6.5). That coverage, however, leaves unstudied any tasks with mean SEQs between 1.0 and 1.9 and between 6.6 and 7.0, so we can’t claim to have covered tasks that are the most extremely difficult or the most extremely easy. On the other hand, it seems very unlikely that tasks with SEQ means less than 2.0 would be rated as easy or tasks with SEQ means greater than 6.5 would be rated as difficult.
Key takeaway: These adjective descriptions for SEQ scores provide a new and potentially useful way to interpret the SEQ.