 Over the past few months, we’ve conducted several studies with different versions of the seven-point Single Ease Question (SEQ®), a popular task-level metric for perceived ease-of-use.
As we’ve seen with other research on rating scales, response means tend to be rather stable despite often salient changes to formatting.
In our earlier SEQ research, we found that reversing the polarity of the response option endpoint labels (Very Difficult on the left for standard; Very Easy on the left for alternate) produced very similar means. However, there were some significant differences in top-box scores, especially when the task was difficult.
When we manipulated the item stem (the part of the item that precedes the response options—original: “Overall, this task was:”; alternate: “How easy or difficult was it to complete this task?”), we found no significant differences in means or top-box scores.
Ah, but what about dropping numbers altogether? Surely that could affect scores. This isn’t just a hypothetical question we wanted to explore. In experiments we conducted with the earliest version of the SEQ in 2009, the response options were similar to our current version (Figure 1, Version 1), but they were not numbered (Figure 1, Version 2).
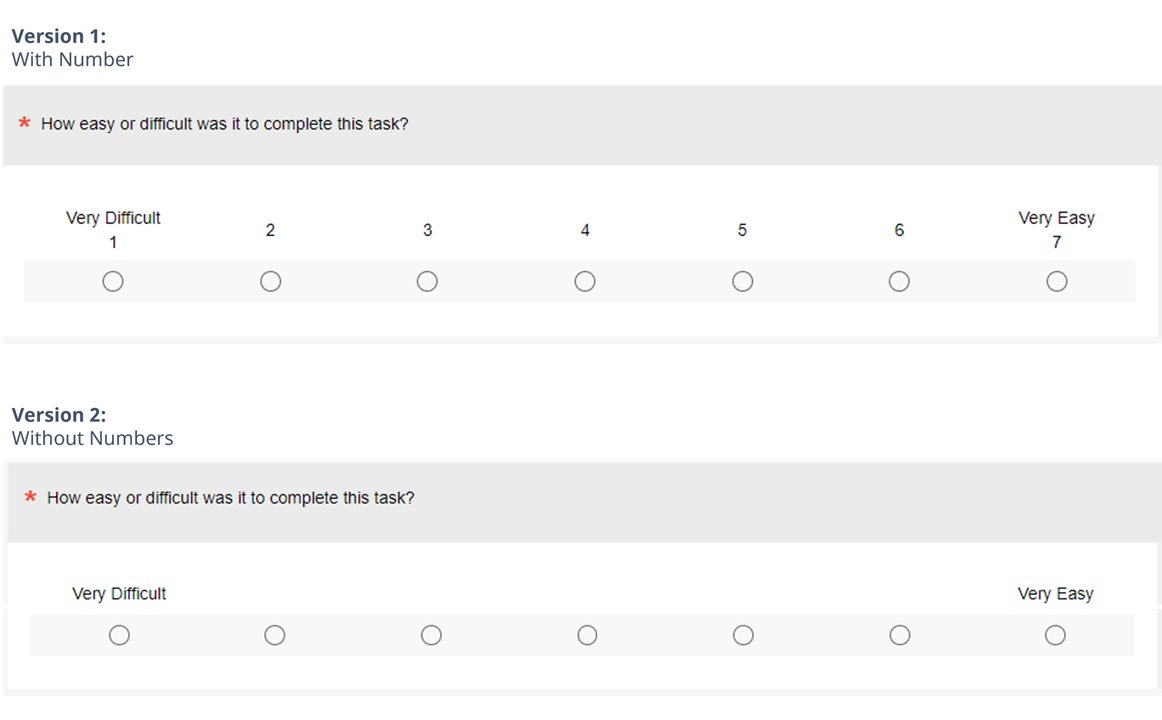
In this article, we report our findings on the measurement differences between numbered and unnumbered versions of the SEQ.
Experimental Design: SEQ With and Without Numbers
Using our MUIQ® platform for conducting unmoderated remote UX studies, we set up a Greco-Latin experimental design to support a within-subjects comparison of numbered and unnumbered versions of the SEQ in the context of attempting easy and hard tasks.
- Easy: Find a blender on the Amazon website for under $50. Copy or remember the name of the blender brand.
- Hard: Please find out how much the monthly cost of an iPhone 12 with 64GB of storage with service for one line is on the AT&T website. Copy or remember the monthly cost (including all fees).
We collected data from 298 participants (sampled in May and June 2022 from a U.S. panel provider). After attempting each task, participants completed either the numbered or unnumbered version of the SEQ in accordance with the experimental design. After completing both tasks, they indicated whether they preferred the items with or without numbers.
In this experimental design, there were three independent variables:
- Item Format: With numbers or no numbers, as shown in Figure 1
- Rating Context: Easy task or hard task
- Order of Presentation: The Greco-Latin design had four orders of presentation:
- Numbered/easy then unnumbered/hard (n = 73)
- Numbered/hard then unnumbered/easy (n = 73)
- Unnumbered/easy then numbered/hard (n = 74)
- Unnumbered/hard then numbered/easy (n = 78)
Using this design, all participants attempted the hard and the easy task, and all saw the numbered and unnumbered versions of the SEQ.
Participants were randomly assigned to one of the four orders of presentation. Across the experiment, this controls for the “nuisance” variable of order of presentation while enabling balanced analysis of item format and task difficulty. It also enables a purely between-subjects analysis using data from the first condition participants experienced in their assigned presentation order.
Results
We conducted analyses of means and top-box scores, both with all the data (within-subjects) and just initial ratings (between-subjects). In this experiment, there were no differences in the significance of outcomes for within-subjects and between-subjects analyses (using the standard alpha criterion of .05, no comparisons were statistically significant).
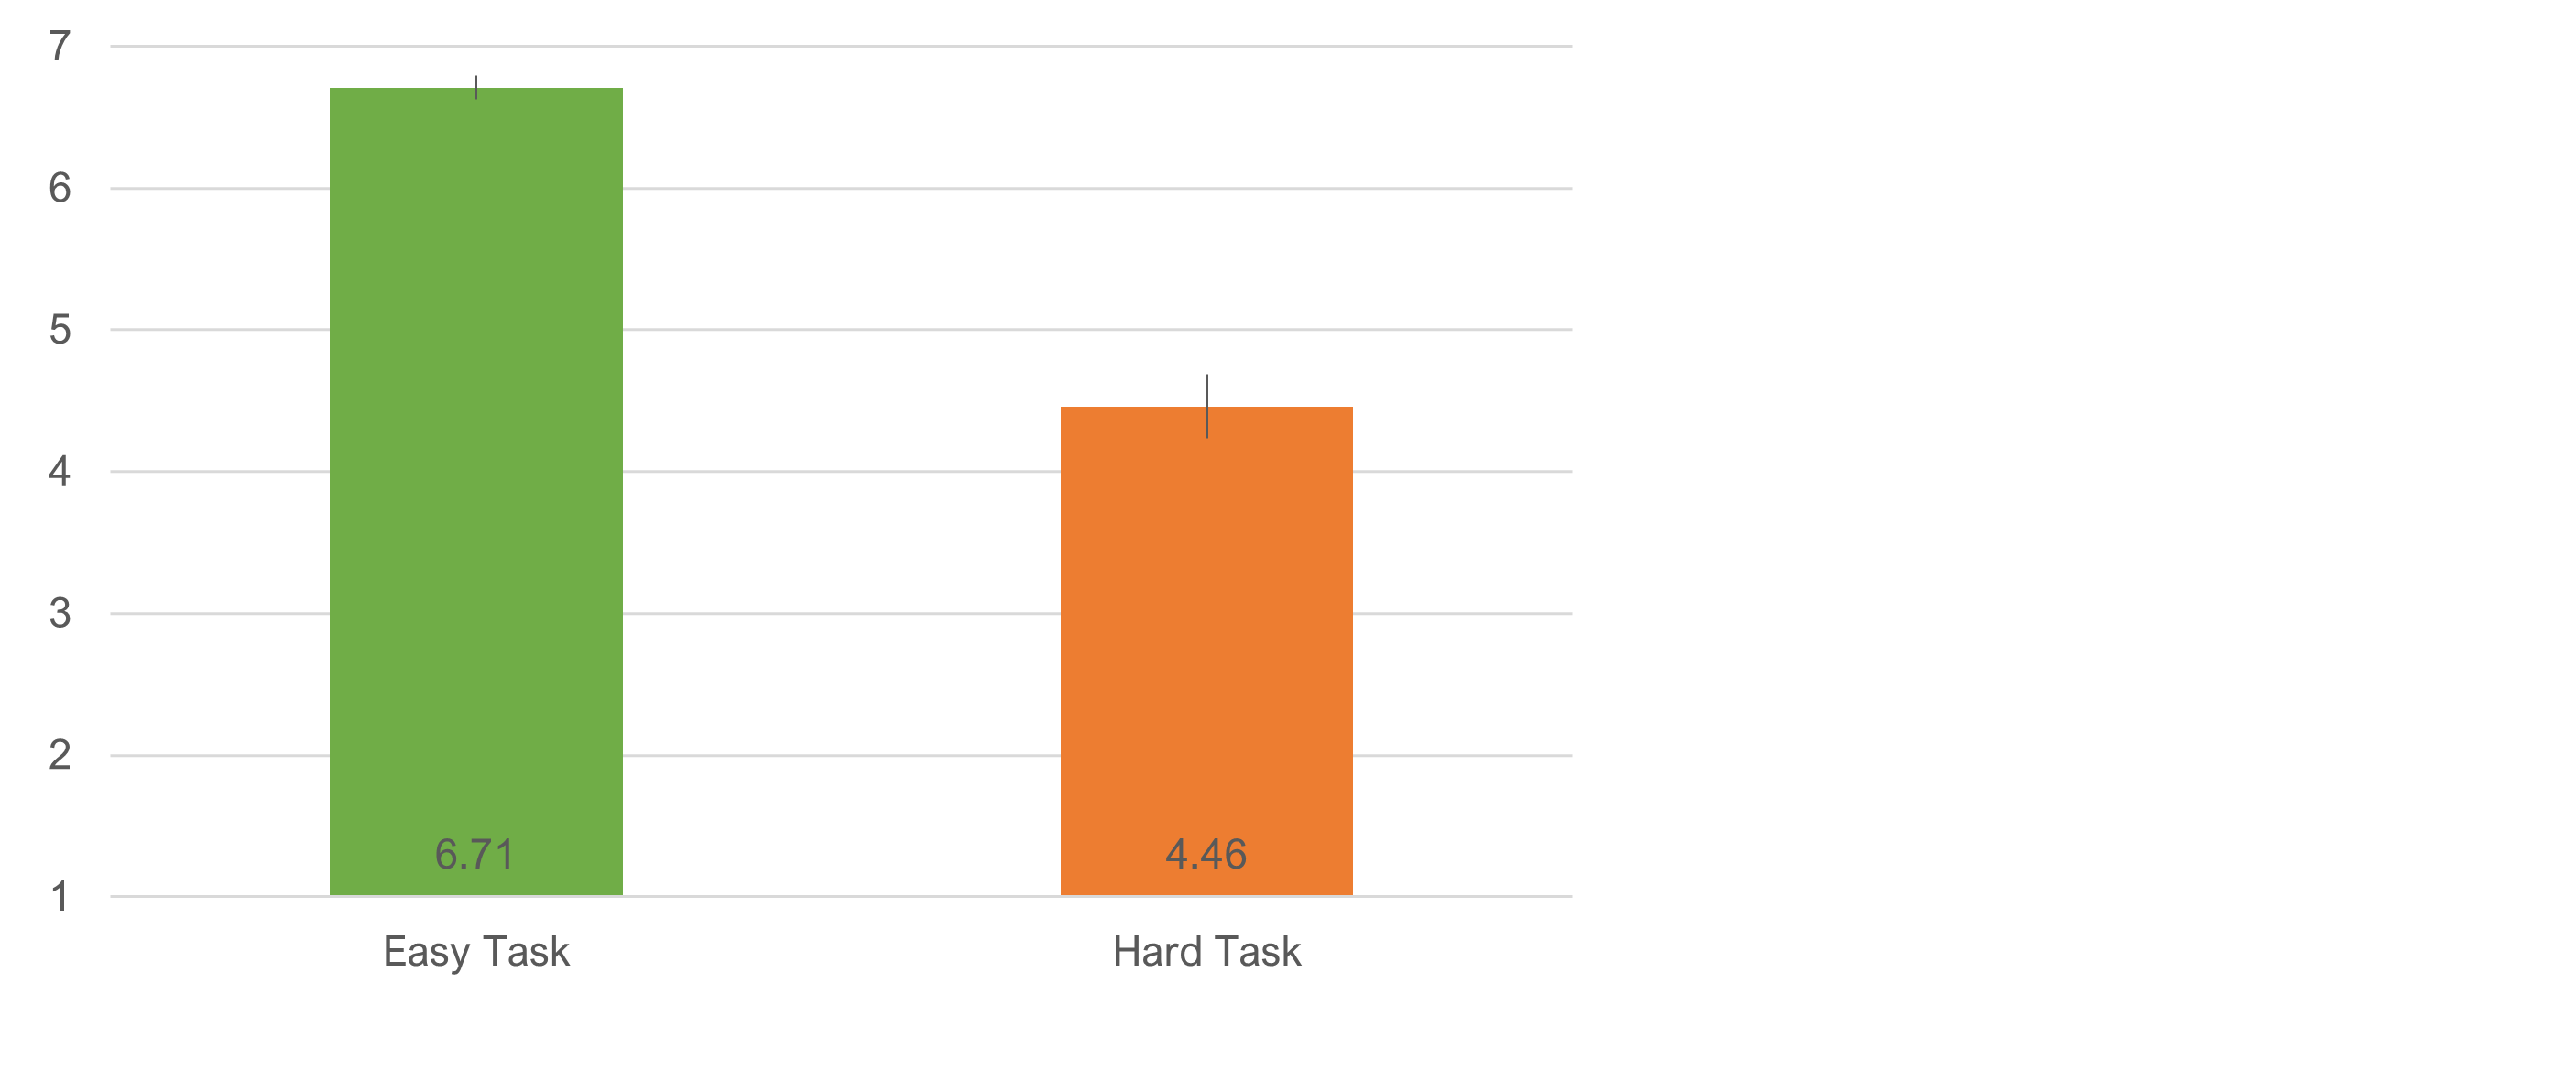
Was the Easy Task Perceived as Easier than the Hard Task?
We conducted a manipulation check to ensure that the tasks differed in their levels of perceived ease. As shown in Figure 2, the difference in overall SEQ means between the easy and hard tasks was statistically significant (t(297) = 19.3, p < .0001), with an observed difference of 2.25 (38% of scale range) and 95% confidence interval from 2.02 to 2.48.
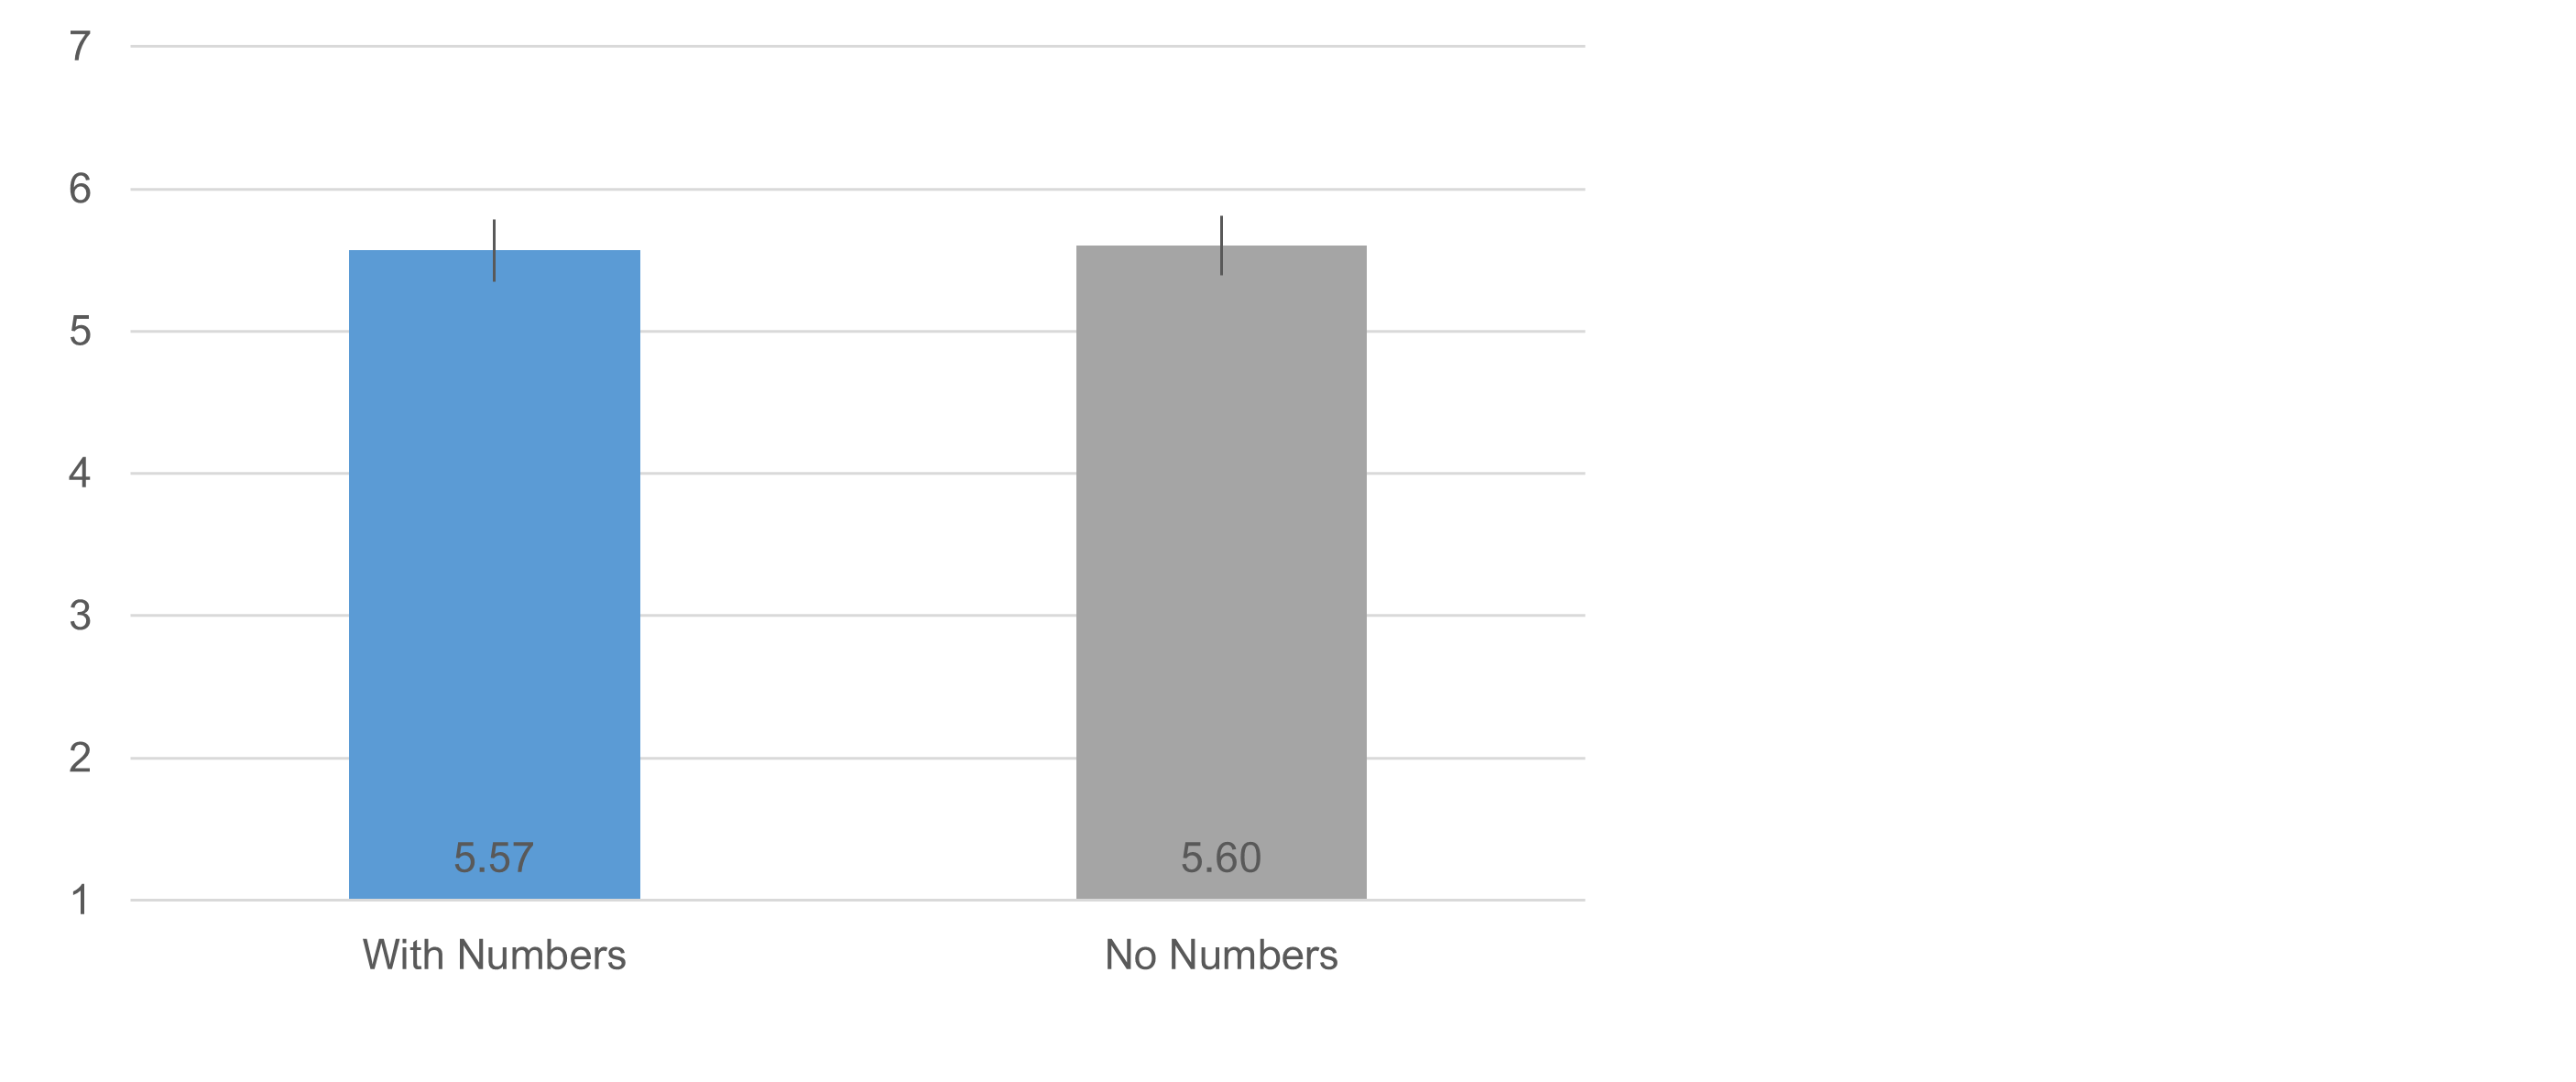
Did Item Format Affect the Means?
Figure 3 shows the overall within-subjects difference in mean SEQ for the two SEQ formats, which was not statistically significant (t(297) = 0.19, p = .85) with an observed difference of .034 (0.6% of scale range) and 95% confidence interval from −0.31 to 0.38.
For the between-subjects analysis using only respondents’ first task, the statistical outcome was similar with a mean of 5.69 with numbers and 5.76 without (t(296) = .33, p = .74, an observed difference of .071, 1.2% of scale range, 95% confidence interval from −0.35 to 0.49).
The within-subjects differences between formats for the easy and hard tasks were also not significant, as shown in Figure 4 with details in Table 1.
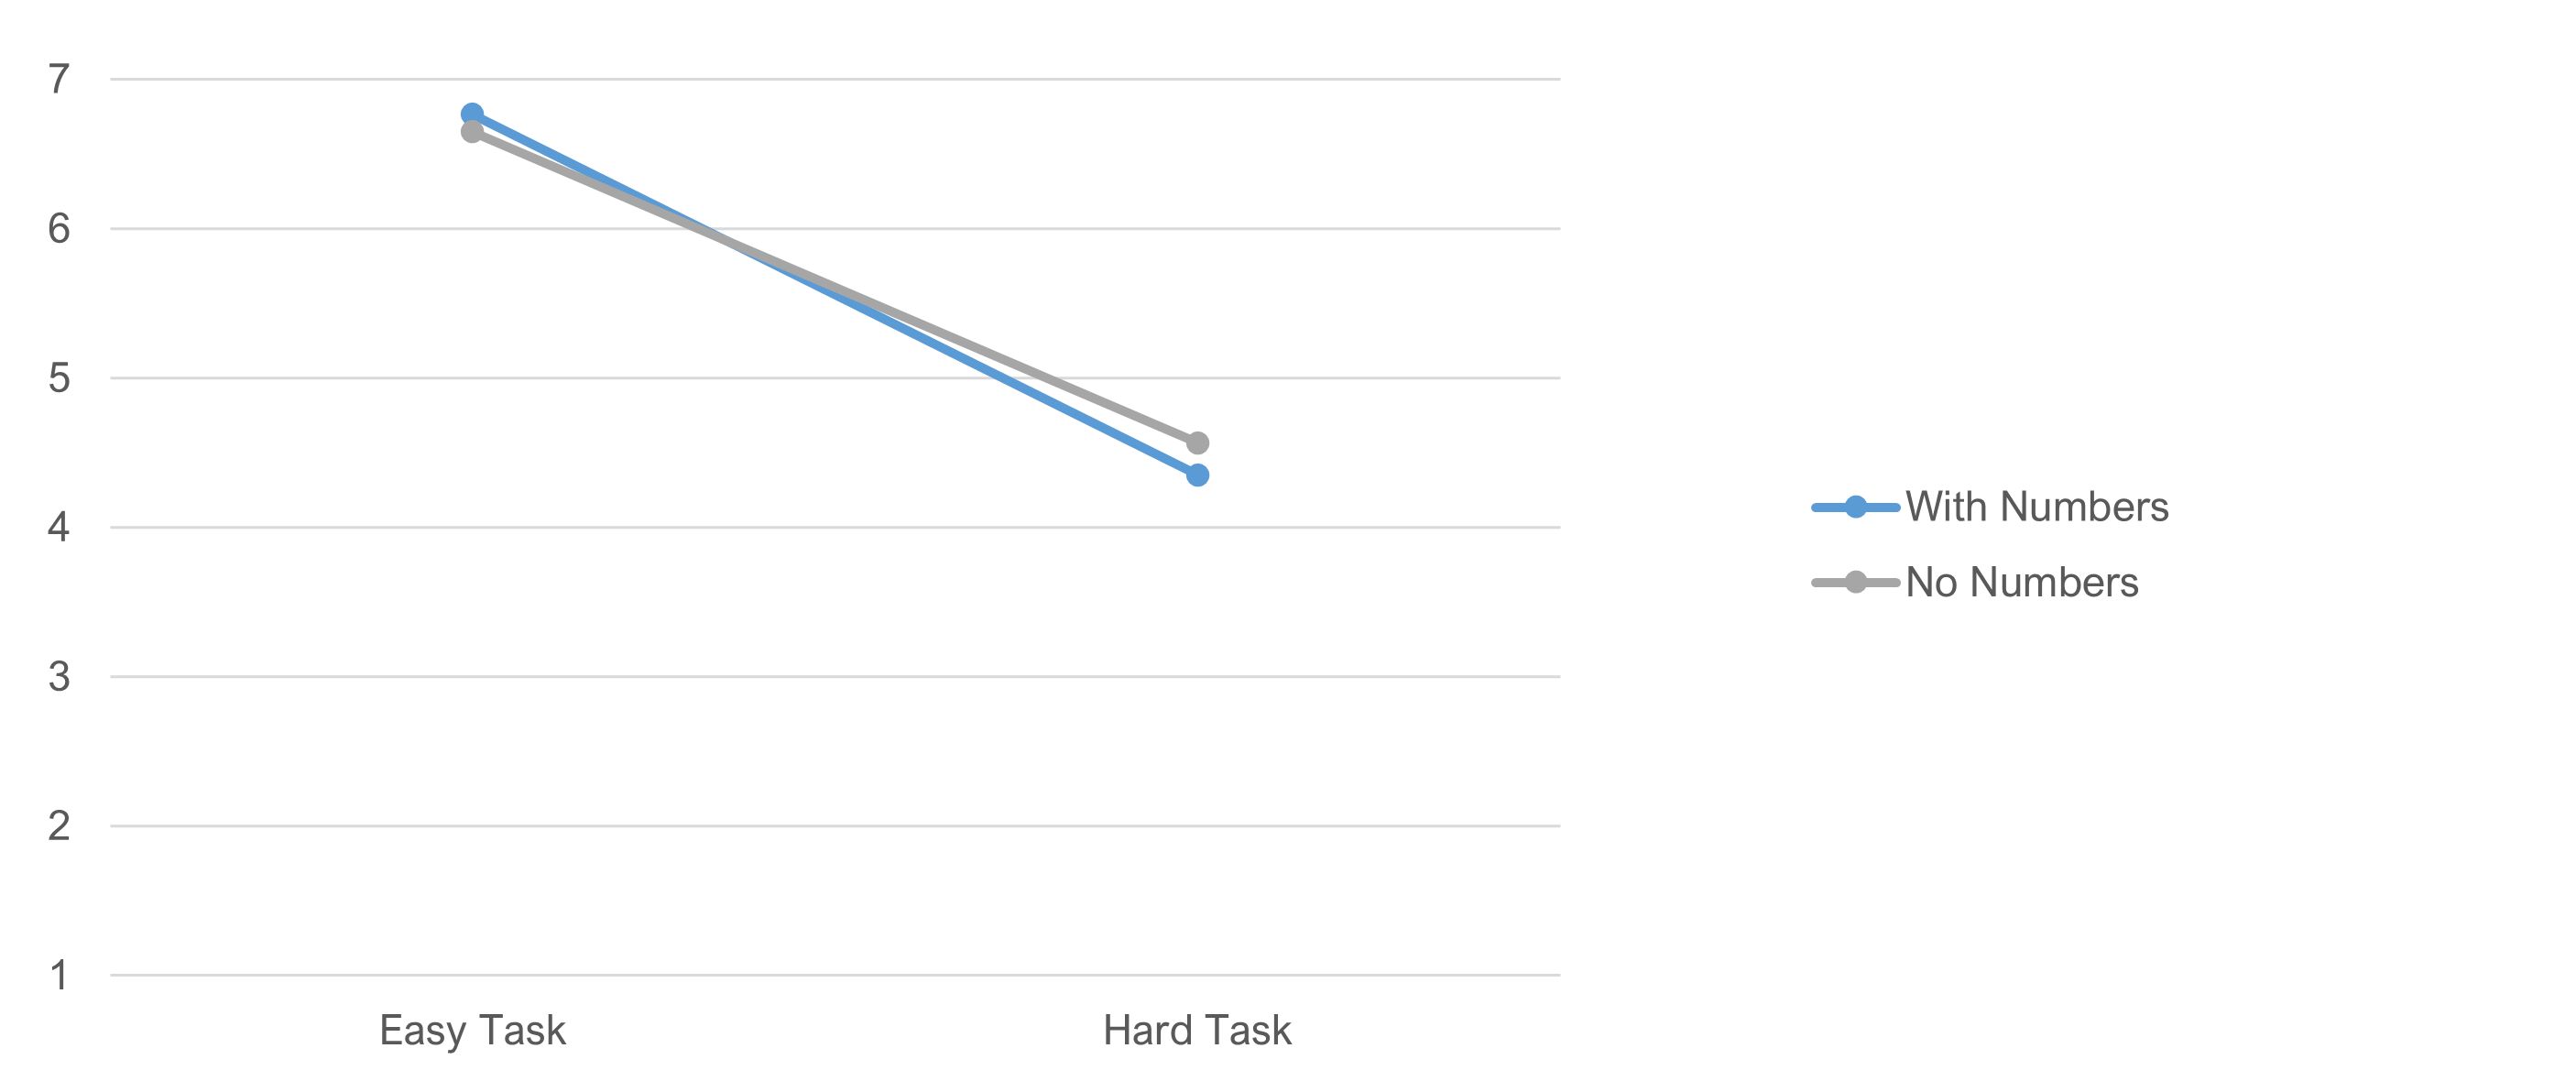
| Task | t | df | p | Obs Diff | % Range |
|---|---|---|---|---|---|
| Easy | 1.35 | 296 | 0.18 | 0.118 | 2.0% |
| Hard | −0.93 | 296 | 0.35 | −0.215 | 3.6% |
Table 1: Comparisons of SEQ means for the two-item formats and two levels of task difficulty.
The statistical outcomes were similar for the between-subjects analyses (Easy: t(145) = 1.1, p = .25, d = 0.09, 1.5% of scale range); Hard: t(145 = −.38, p = .71, d = −0.12, 2.0% of scale range).
Did Item Format Affect Response Distributions?
Figure 5 shows the overall response distributions collapsed over task difficulty. Combined in this way, the distributions are similar, with no significant difference for top-box or top-two-box percentages (Table 2).
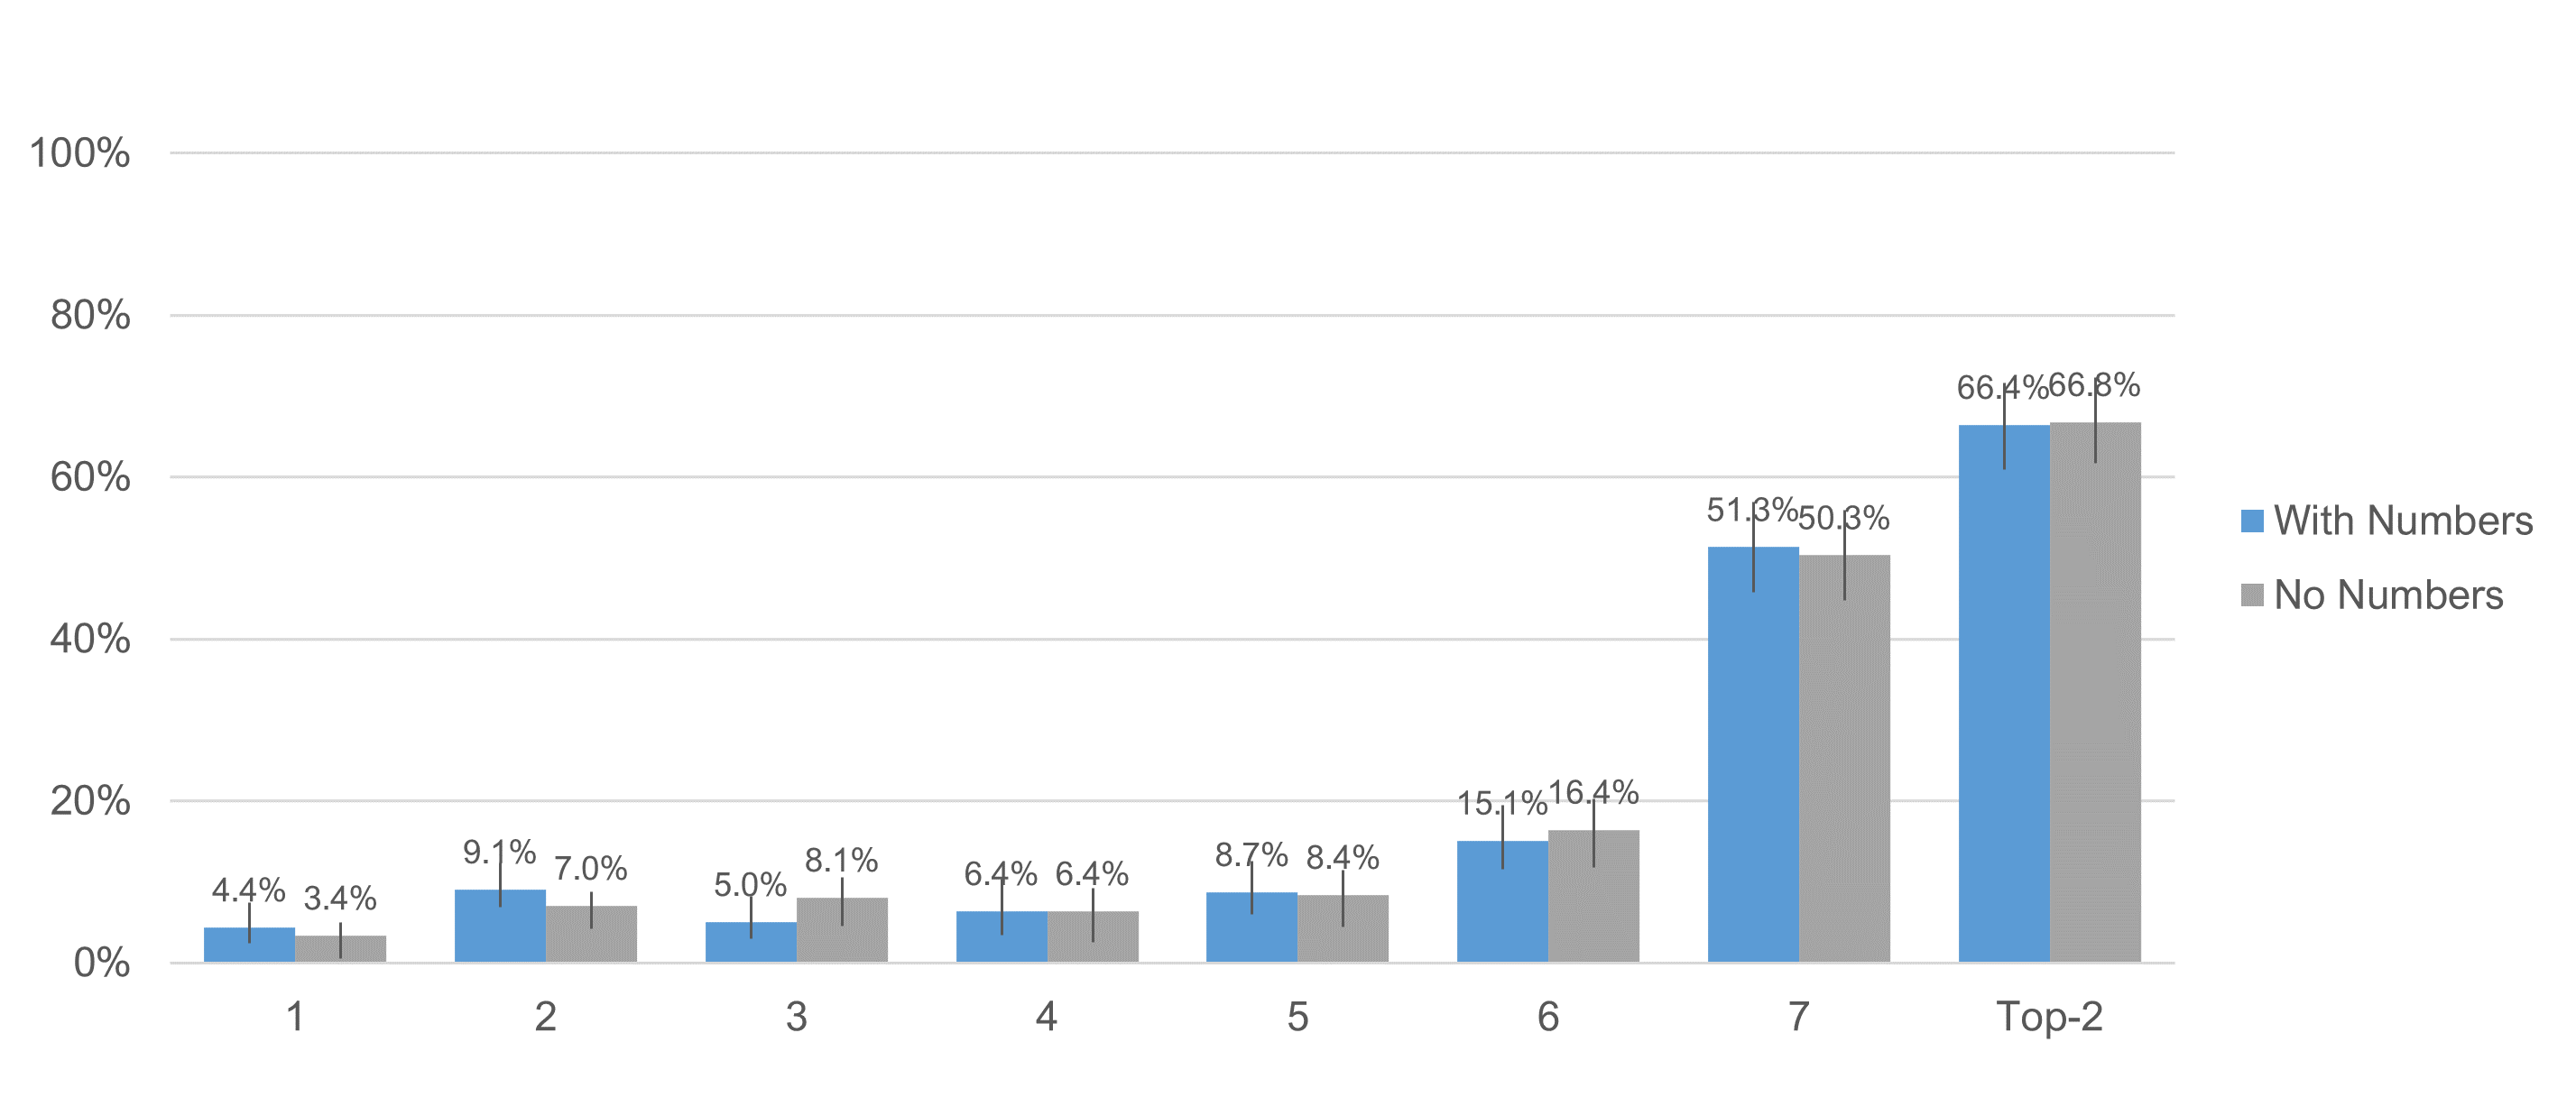
| Box Type | z | p | Obs Diff | Lower 95 | Upper 95 |
|---|---|---|---|---|---|
| Top-box | 0.22 | 0.88 | 1.0% | −7.9% | 9.9% |
| Top-two-box | −0.08 | 0.94 | −0.3% | −8.8% | 8.5% |
Table 2: Comparisons of SEQ top- and top-two-box scores for the two-item formats (within-subjects).
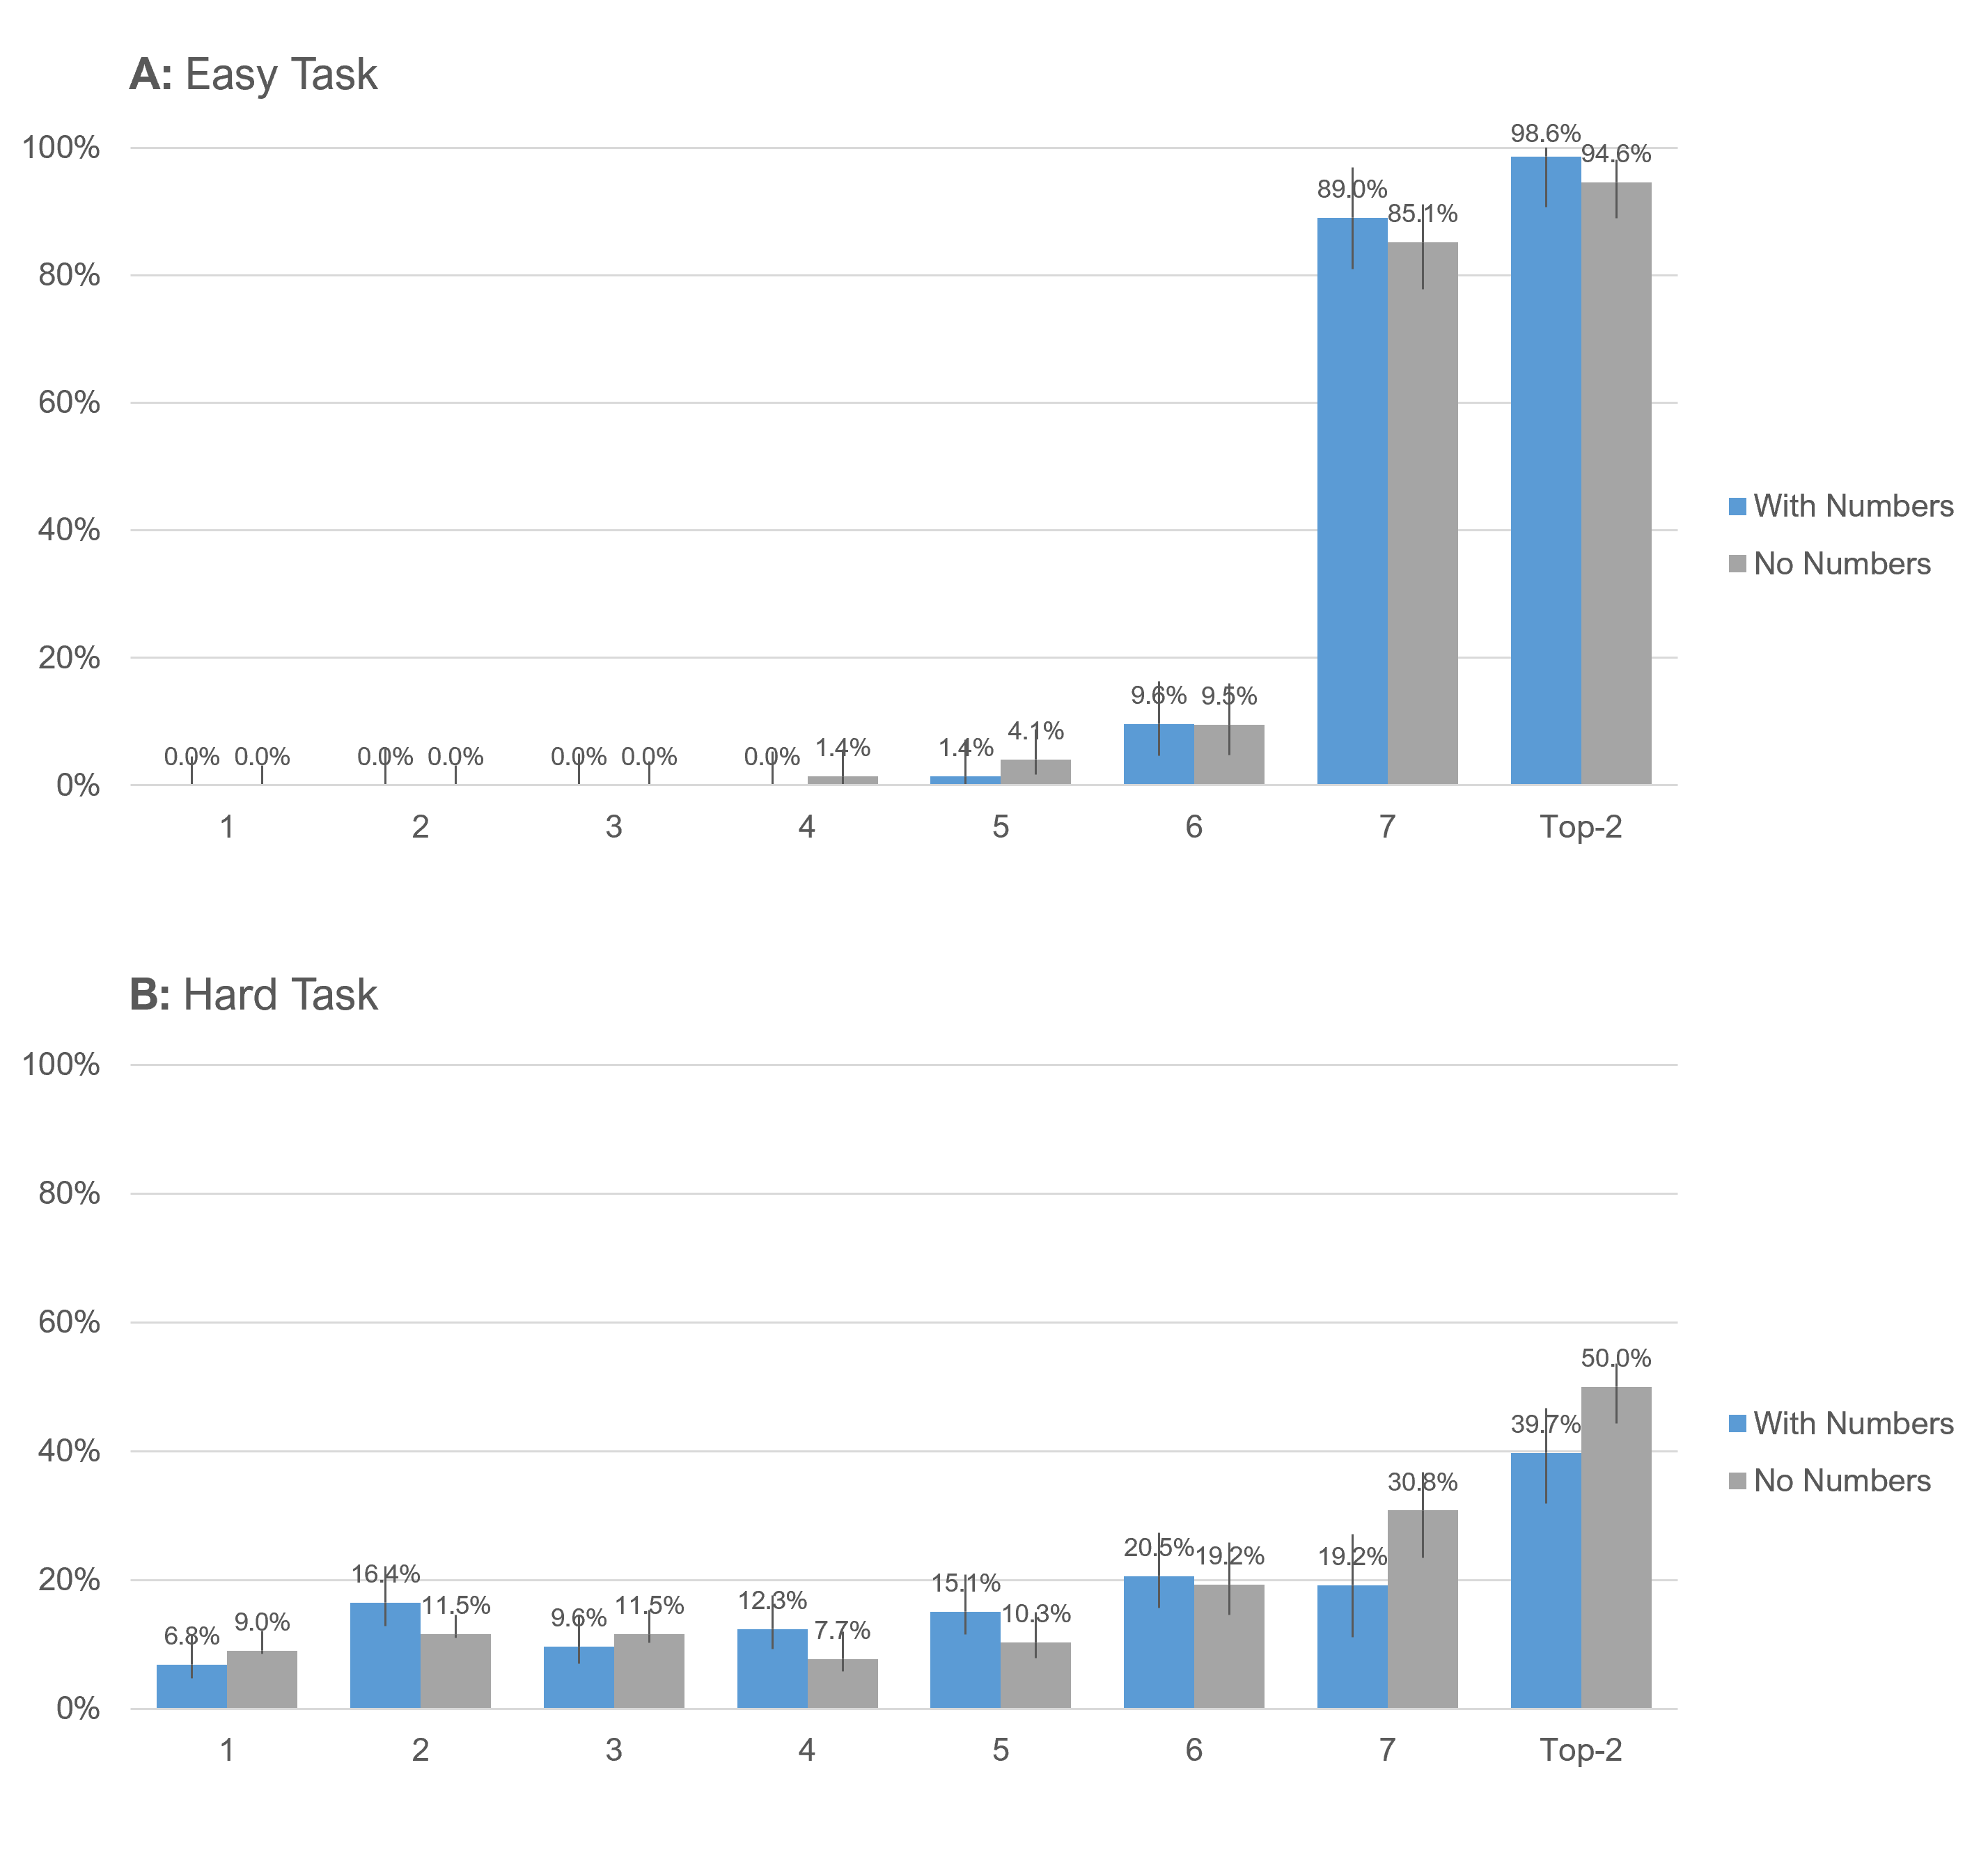
When analyzed to compare box scores for each format and each level of task difficulty, the magnitudes of differences were somewhat larger, but the statistical results continued to be nonsignificant (Table 3, n−1 two-proportion tests).
| Task Type | Box Type | z | p | Obs Diff | Lower 95 | Upper 95 |
|---|---|---|---|---|---|---|
| Easy | Top-box | 1.30 | 0.20 | 5.9% | −3.1% | 14.7% |
| Hard | Top-box | 1.17 | 0.24 | 5.5% | −3.7% | 14.5% |
| Easy | Top-two-box | 1.80 | 0.07 | 4.9% | −0.7% | 10.3% |
| Hard | Top-two-box | 1.23 | 0.22 | 8.0% | −4.0% | 11.0% |
Table 3: Comparisons of SEQ top- and top-two-box scores for the two-item formats and two levels of task difficulty (for all comparisons, n = 298).
As shown in Figure 6 and Table 4, differences in box scores were similarly nonsignificant but a bit more extreme when analyzing data from just the first task condition in the experimental design (between-subjects) with n−1 two-proportion tests, especially for the hard task.
| Task Type | Box Type | z | p | n | Obs Diff | Lower 95 | Upper 95 |
|---|---|---|---|---|---|---|---|
| Easy | Top-box | 0.70 | 0.48 | 147 | 3.9% | −7.2% | 14.8% |
| Hard | Top-box | 1.64 | 0.10 | 151 | 11.5% | −2.3% | 24.9% |
| Easy | Top-two-box | 1.35 | 0.18 | 147 | 4.0% | −2.7% | 10.5% |
| Hard | Top-two-box | 1.26 | 0.21 | 151 | 10.3% | −5.6% | 25.6% |
Table 4: Between-subjects comparisons of SEQ top- and top-two-box scores for two item formats and two levels of task difficulty.
Which Version Did Participants Prefer?
After attempting both tasks, participants indicated which item format they preferred. As shown in Figure 7, over half the participants didn’t notice the difference, and about a fifth noticed but didn’t care.
For those who had a preference, there was a significant preference for the version with numbers (n−1 two-proportion test, z = 3.33, p = .0009, observed difference of 9.1% with 95% confidence interval from 3.7 to 14.3%).

Summary and Takeaways
Did dropping numbers from the SEQ make a difference? Once again it turns out, not really.
Across a broad suite of analyses, there were no statistically significant differences in means or top-box scores (using the standard alpha criterion of .05). Observed differences between means for the two-item formats were consistently small—about 1% of the range of the scale when task data were combined, and from 1.5–3.6% of the range of the scale when separated by task.
Hard-task top-box had the largest difference: The largest nominal (nonsignificant) finding in this analysis was a top-box difference between the numbered and unnumbered SEQ formats of 11.5% for the hard task when examining only the between-subjects (first task) data (Figure 6, Panel B). The difference was about half that when the analysis included all the data from the within-subjects design. Despite the lack of statistical significance for the 11.5% difference, the associated p-value was a relatively low .10, and the 95% confidence interval ranged from −2.3 to 24.9%. We had a sample size of almost 300 participants for the total study, but that’s cut in half for many of the between-subjects analyses, plus the top-box percentages were around 40–50%. Because 50% is the point of maximum binomial variability, a larger sample size might find this relatively large difference to be statistically significant.
Numbers may help improve response accuracy: Referring again to Figure 6, even though the differences were not statistically significant, when the task was easy, the percentage selection of 7 (the top box) was slightly higher when numbers were present. When the task was hard, the percentage selection of 7 was 11.5 percentage points lower when numbers were present. This suggests a working hypothesis that the presence of the number 7 led participants to be more likely to select it when the task was easy and less likely to select it when the task was hard. This behavior would lead to better discrimination between easy and hard tasks when comparing top-box scores.
Mean differences remain small: Even so, it’s important to keep in mind that there appear to be response behaviors that act as a counterweight to this in the lower response options such that there is little difference between the means for numbered and unnumbered scales regardless of task difficulty.
Taking all this into account, we can get reasonably precise estimates for means, and the mean differences were consistently small. Our estimates for top-box scores are less precise, but we find the magnitudes of the observed format differences when the task was hard to be concerning regarding the likelihood of actual equivalence for top-box scores.
Most don’t care or don’t notice the format; those who do prefer the numbered version two to one: Because participants in the experiment used both formats during the task sessions, we asked them which they preferred. Among those who had a preference (only 25%), they significantly favored the version with numbers (17% to 8%).
Takeaway 1: UX practitioners can consider these SEQ formats to be “mean equivalent.” As long as your key dependent measure is the mean of the SEQ, you should get the same result with either format.
Takeaway 2: UX practitioners should not consider these SEQ formats to be “distribution equivalent.” If your key dependent measure will be a top-box or top-two-box score based on SEQ ratings, then you can’t necessarily count on getting the same result with the different formats, especially if your tasks tend to be difficult.
Takeaway 3: Unless there’s a compelling reason to do otherwise, we recommend using the version with numbers. This is the more commonly used format, and it appears to have the potential for better discrimination between easy and hard tasks, and among those who had a preference, the preference for the numbered version was statistically significant and just over 2:1.


