 Sliders are a type of visual analog scale that can be used with many online survey tools such as our MUIQ platform.
The literature on their overall effectiveness is mixed (Roster et al., 2015). On the positive side, evidence indicates that sliders might be more engaging to respondents. On the negative side, evidence also indicates that sliders can be more cognitively and physically challenging than clicking a number, increasing completion times and non-response rates.
In an earlier article, we explored the differences between sliders and standard numeric rating scales.
We found no substantial (nor statistical) differences in mean scores or response distributions between five-point rating scales and sliders for UMUX-Lite ratings of entertainment services (for example, Hulu and Netflix). We did not, however, analyze differences in their measurement sensitivities. In this article, we address the potential advantage of sliders concerning measurement sensitivity, starting with research conducted in 2009 on a specific type of slider and then returning to the entertainment services data we collected earlier this year with standard sliders.
Sensitivity Advantage of the Subjective Mental Effort Questionnaire (SMEQ)
In 2009, Joe Dumas and Jeff published a CHI paper [PDF] that compared the popular Single Ease Question (SEQ) with a specific type of visual analog/slider scale, the Subjective Mental Effort Questionnaire (SMEQ). Twenty-six participants attempted five tasks on two enterprise expense reporting applications. Each task was attempted three times on both systems (in counterbalanced order using a Greco-Latin design). Assessment of the two applications with the System Usability Scale (SUS) indicated a significant difference in their overall perceived usability (80 vs. 52).
Figure 1 shows the version of the SMEQ used in this experiment. Unlike typical sliders that usually measure responses from 0 to 100, the SMEQ has a range from 0 to 150. Also unlike typical sliders, the SMEQ has nine labels between the endpoints to guide placement of the slider. The placement of these labels is not arbitrary and was a major focus of the research that developed the SMEQ.

Figure 1: A digital version of the Subjective Mental Effort Questionnaire (SMEQ).
For the full sample of 26 users, after-task ratings were statistically significant on four out of five tasks for both the SEQ and the SMEQ.
To determine whether the SMEQ would be able to differentiate more than the SEQ at smaller sample sizes (i.e., if it’s more sensitive), we conducted a Monte Carlo resampling exercise.
We took a thousand random samples with replacement at sample sizes of 3, 5, 8, 10, 12, 15, 17, 19, and 20 and compared the means for the two products using a paired t-test. We counted the number of means that could differentiate between expense reporting applications at p < .05. The more sensitive a questionnaire type is, the more readily it can detect significant differences between products with smaller sample sizes.
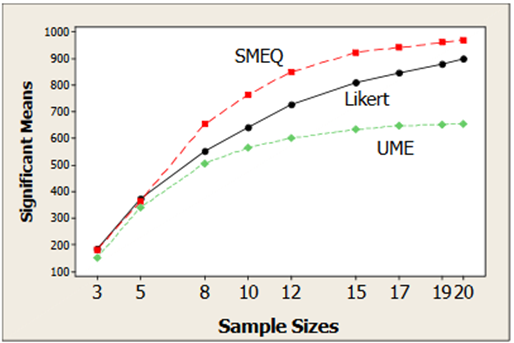
Figure 2: Monte-Carlo resampling results showing the sensitivity of three rating methods at various sample sizes (from Dumas and Sauro, 2009). The Likert format was the SEQ, and the usability magnitude estimation (UME) method is not relevant to the current article (for details, see the original CHI paper).
The SMEQ was more sensitive, better differentiating between the apps at smaller sample sizes. Figure 2 shows that starting at a sample size of eight, SMEQ tended to identify more samples than the SEQ as statistically significant (out of a thousand). For n = 8 and higher, the advantage ranged from 8–14% depending on the sample size.
However, the SMEQ also had different (and calibrated) labels (Figure 1) and a range of 0 to 150, so this advantage might not generalize to standard sliders with just endpoint labeling and a range from 0 to 100. We needed more data.
Resampling Sliders vs. Numbers
To explore the possible sensitivity advantage of the standard slider, we conducted a new Monte Carlo resampling exercise with the entertainment data described in our earlier article. Both the slider and the five-point scales had only the endpoints labeled with strongly disagree and strongly agree (Figure 3), which eliminated the confounding of the label formats. The sliders could record ratings from 0 to 100.
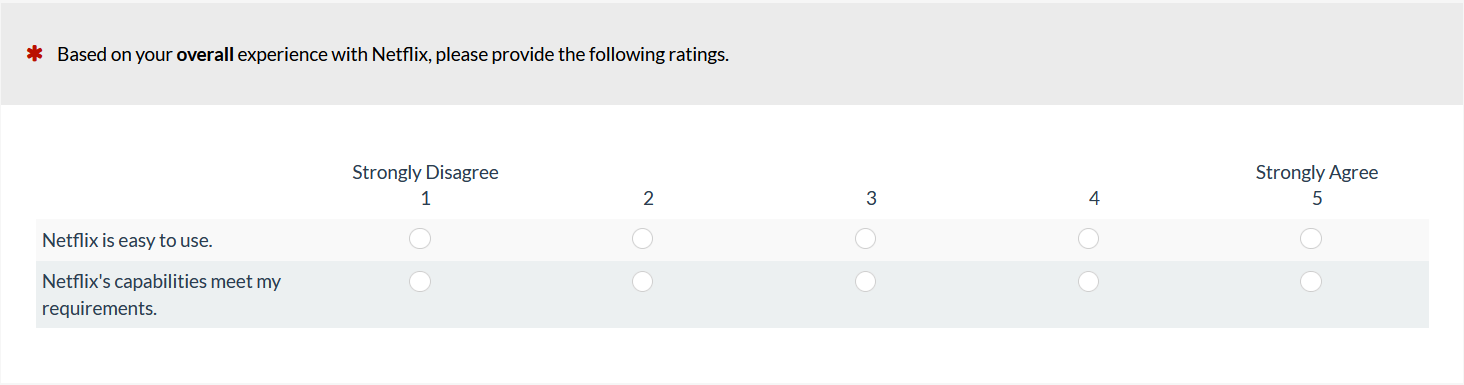

Figure 3: Numbered rating scales and sliders.
Figure 4 shows the resulting UMUX-Lite scores for all three services and both item formats. There were no statistically significant differences between the slider and number formats at the full sample sizes within each brand. Netflix (n = 73) received significantly higher ratings than Hulu (n = 40) and Amazon Prime (n = 38). Consistent with a sensitivity advantage for sliders, although all were significant (p < .05), the p-values for t-tests comparing Netflix with Hulu and Prime were lower for sliders than numbers (equal variance not assumed):
Netflix vs. Hulu | Numbers: t(65.0) = 2.94, p = .005
Netflix vs. Hulu | Sliders: t(60.4) = 3.12, p = .003
Netflix vs. Prime | Numbers: t(58.3) = 2.20, p = .03
Netflix vs. Prime | Sliders: t(51.3) = 2.65, p = .01
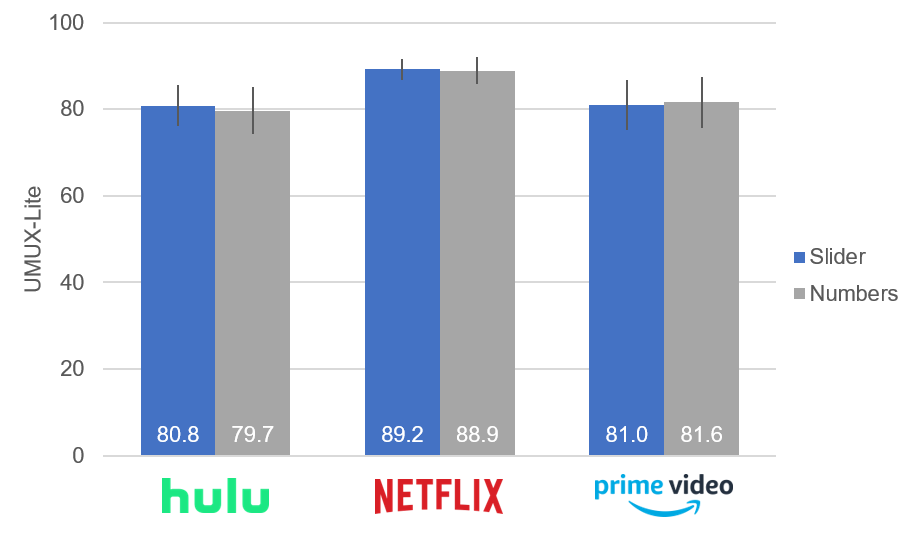
Figure 4: UMUX-Lite scores by entertainment service for sliders and numbers.
The standard deviations of the sliders and numbers by brand are shown in Table 1. Sliders had a slightly smaller standard deviation than their corresponding numeric scale data, which may provide more precision at smaller sample sizes. The smaller standard deviation likely caused the lower p-values observed for sliders in the full sample comparisons.
| Sliders | Numbers | |
|---|---|---|
| Hulu | 15.1 | 17.2 |
| Netflix | 10.5 | 13.3 |
| Prime | 17.5 | 18.1 |
Table 1: Standard deviations between sliders and numbers by brand (sliders have nominally lower standard deviations).
We again performed a resampling exercise similar to the one we did with the SMEQ to see if standard sliders detected the statistical differences between Netflix and the other brands at smaller sample sizes. To avoid potential issues associated with depleting a sample in resampling experiments when sampling without replacement and conducting between-subjects t-tests, we restricted resample sizes to half the data for the service with the smaller full sample size. For clarity, we then rounded the resample size down to the nearest five.
This meant that our maximum sample size for Netflix vs. Hulu resampling was n = 20, and for Netflix vs. Prime the size was n = 15. To work with larger sample sizes, we split all the data we had between Netflix (n = 73) and Not Netflix (n = 107) services, allowing exploration of sample sizes up to n = 35. The Not Netflix sample included Hulu and Prime data, plus smaller sets of data collected for Disney+ and HBO Now. For the full sets of data, the means (and standard deviations) for Not Netflix were 80.5 (17.9) for numeric scales and 81.4 (16.4) for sliders, both significantly different from the Netflix ratings (numeric: t(176.7) = 3.61, p < .0001; sliders: t(177.5) = 3.92, p < .0001).
Using a custom script written in PHP, we took ten thousand random samples in batches without replacement at various sample sizes, compared the means for the two products using a two-sample t-test, and counted the number of samples with p values less than .05. (As a check, we replicated the PHP resampling results using an independently developed R script based on the RESAMPLE function, also verifying that sensitivity measures were stable with ten thousand iterations.)
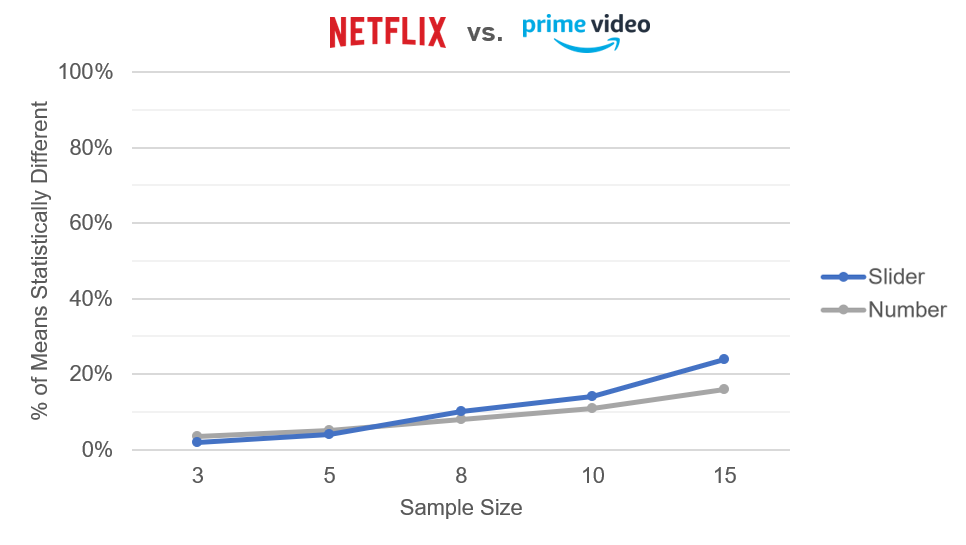
Figure 5: Percent of ten thousand differences that were statistically significant (p <.05) between Netflix and Amazon Prime at sample sizes between 3 and 15.
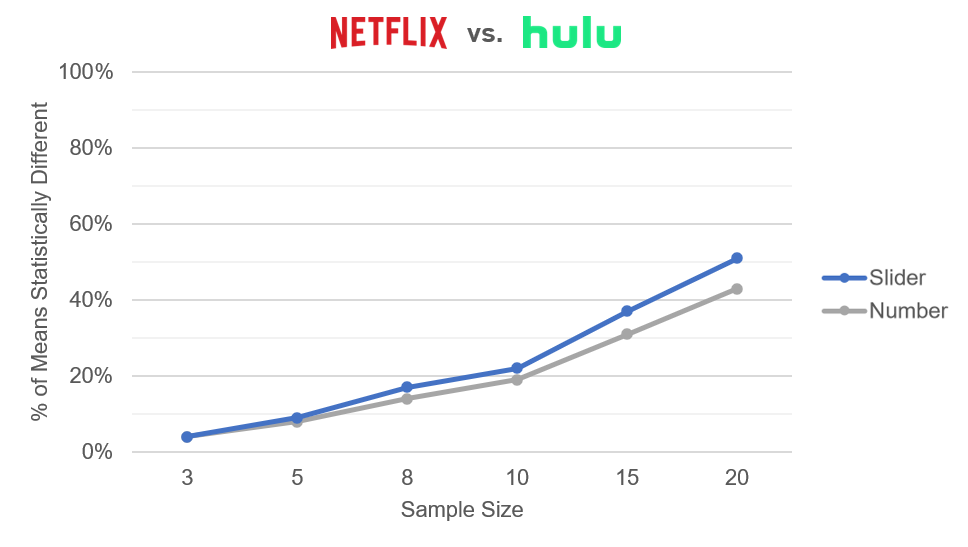
Figure 6: Percent of ten thousand differences that were statistically significant (p <.05) between Netflix and Hulu at sample sizes between 3 and 20.
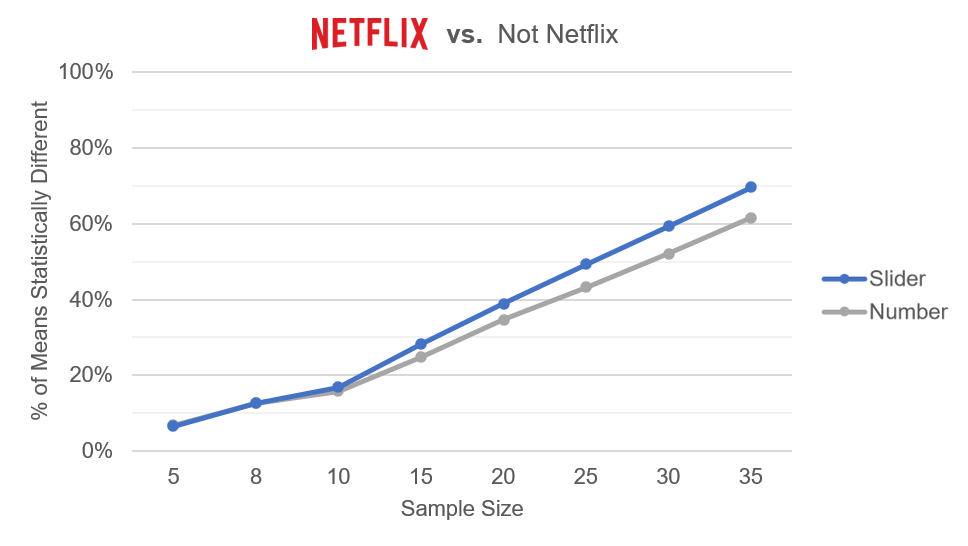
Figure 7: Percent of ten thousand differences that were statistically significant (p <.05) between Netflix and Not Netflix at sample sizes between 5 and 35.
Figures 5, 6, and 7 show a sensitivity advantage for sliders for all but the smallest sample sizes (less than n = 10). At the larger sample sizes, the advantages for sliders topped out at about 8%.
These data were consistent with the earlier research that found the SMEQ slider to be more sensitive than the SEQ numeric scale. Standard sliders can differentiate between groups at smaller sample sizes better than standard five-point rating scales, most likely due to smaller standard deviations associated with their larger number of response options (0–100).
Note that all three sets of data had similar mean differences and standard deviations. Variation in these distributional characteristics could change the magnitude of the sensitivity advantage of sliders (a good topic for future research).
It’s well known that increasing the number of response options in numeric scales generally improves their reliability and reduces measurement variability, so it’s possible that using scales with more than five points would reduce the sensitivity advantage of sliders (another good topic for future research).
Summary and Discussion
Our earlier research had demonstrated a sensitivity advantage of a specific type of slider scale (the SMEQ), but that sensitivity may have been specific to that questionnaire (because of its unique labels and numbers) and not necessarily generalizable to all sliders.
We conducted a series of Monte Carlo resampling analyses on streaming entertainment providers (Netflix, Hulu, Prime, Disney+, and HBO Now) and found that standard sliders did have a moderate sensitivity advantage, corroborating our earlier findings. The differences were detectable once the sample sizes were ten or more (presumably, the point at which the analyses had enough power to start discriminating between the services). At n = 10, the advantage across the three analyses was about 2%, increasing to about 8% at the maximum n for resampling in each analysis.
Researchers can use sliders to achieve higher sensitivity than they would get with five-point numeric scales, but they must consider the shortcomings of sliders (higher non-response rates and possible accessibility issues).
In the future, we plan to examine more comparisons to see if a numeric scale with seven or eleven points gets closer to (or even matches) the sensitivity of a slider.