 We conduct a lot of quantitative online research, both surveys and unmoderated UX studies.
Much of the data we collect in these studies is from closed-ended questions or task-based questions with behavioral data (time, completion, and clicks).
But just about any study we conduct also includes some open-ended response questions. Our research team then needs to read and interpret the free-form responses. In some cases, there might be a few dozen comments; in other studies with multiple questions, there can be easily 10,000+ comments to discern.
While there’s no substitute for reading the actual words participants provide, a long list of verbatim comments can be difficult to interpret. One way to help the interpretation of these comments is to code them into themes and then use those themes as variables that can be counted and used in advanced analyses.
We’ve experimented with sophisticated algorithms for parsing verbatim responses, and so far we’ve found that nothing quite beats the brute force method of manually coding and classifying comments. While tedious, the extra effort brings insight that automated algorithms can’t provide. Here’s the process we follow to code and analyze verbatim comments.
- Download & setup: To code verbatims, start by exporting them from your survey platform (MUIQ, Qualtrics, or SurveyMonkey—all allow you to export). Ensure you download both the raw comments along with a unique participant ID. This is important, as you’ll need these IDs again later. We usually code our comments in Excel.
- Orient to comments: Examine the open-ended responses and orient yourself to the type of comments by randomly reading around 10% of them (if there are a lot). This may mean reading 10 to 100 comments to get a feel for the types of themes that are likely to emerge.
- Sort & clean: Depending on the question, you’ll likely receive a lot of blank responses, N/As, or similar terse responses. Sorting them will help speed up the coding process. But when sorting, be sure to sort with the user ID of the response as shown in the figure below (ID on the left, comment on the right). If your dataset hasn’t already been cleaned, this is a good time to identify and remove participants that are providing gibberish or poor quality responses (another reason to maintain the ID).

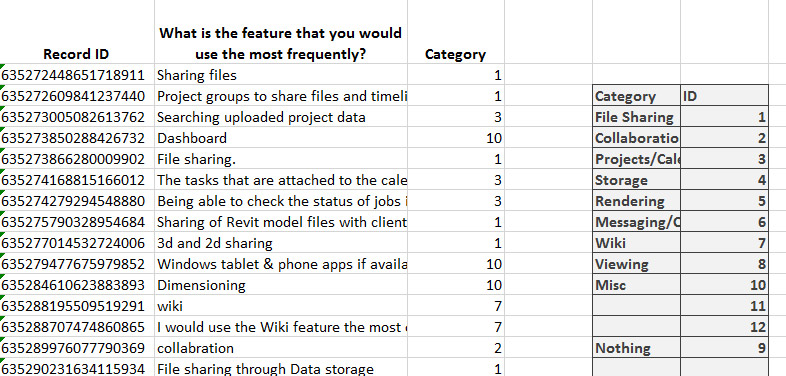
- Group into themes: With the data cleaned, create your initial themes. In Excel, we either drag and drop the comments into groups or create codes and assign the codes to each comment as shown in the figure below. Depending on the type and number of responses, aim for around 10-20 themes. Having too many (30-40+) is harder to interpret and take action on.
- Split: Some participants will have a lot to say and will touch on multiple themes. Split the comments down into the atomic ideas. For example, a comment below came from a participant on an automotive website on one improvement he would make:
“If Chevy makes the Excalibur model, it would be nice to have it listed on selectable options. A site text search box would be handy as well as a site index page if I were to get totally lost or unable to find something using the drop down menus. If there is a site text search box already, I missed seeing it.”
This comment can be split into at least three themes: Selectable options for a car model, search, and a site index page.
- Combine: After your initial pass at coding you may have too many or redundant themes. Take a second pass and combine or rename themes so you have a manageable number to interpret. For example, the comment about having selectable options for a car model may be too idiosyncratic and gets merged into a general category of car information or options. As a general guide, if you have an “Other” category with more than 10% of the overall comments, break it into more themes.
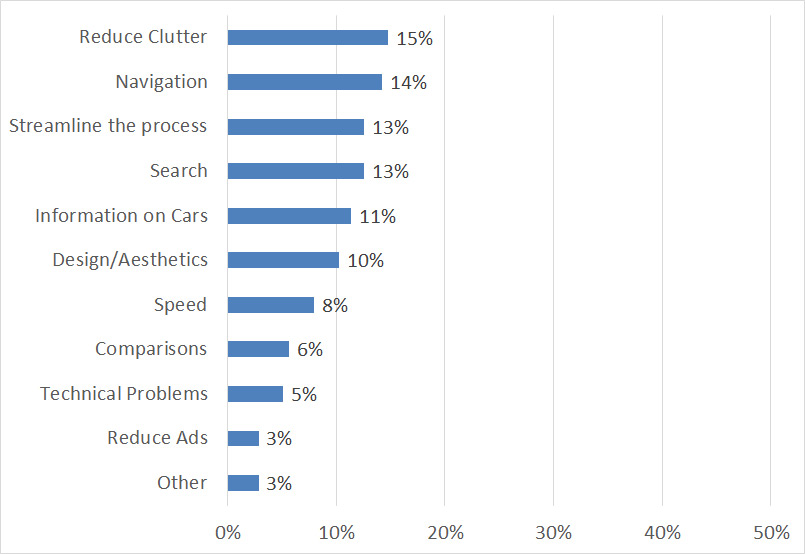
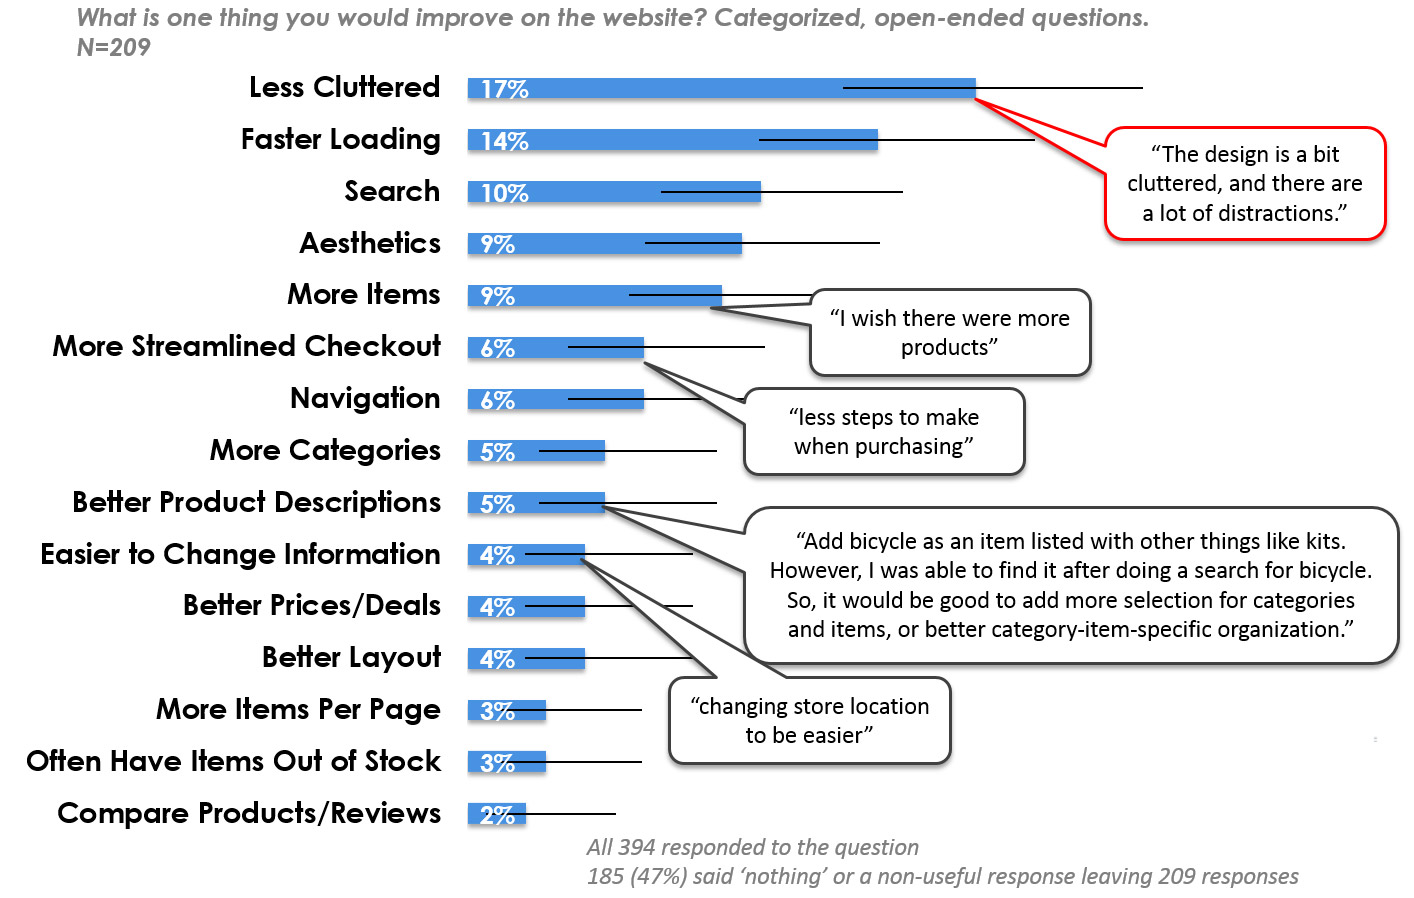
- Quantify & display: With comments coded into themes, count the number of comments within each theme, calculate the percentage of total comments, and graph them. The figure below shows an example of coded comments left by 176 participants on a survey for an automotive website. The percentages can be a percent of total comments (percentages will add up to 100% as shown in the figure) or percent of respondents making a comment within the theme (percentages will add up to more than 100%).
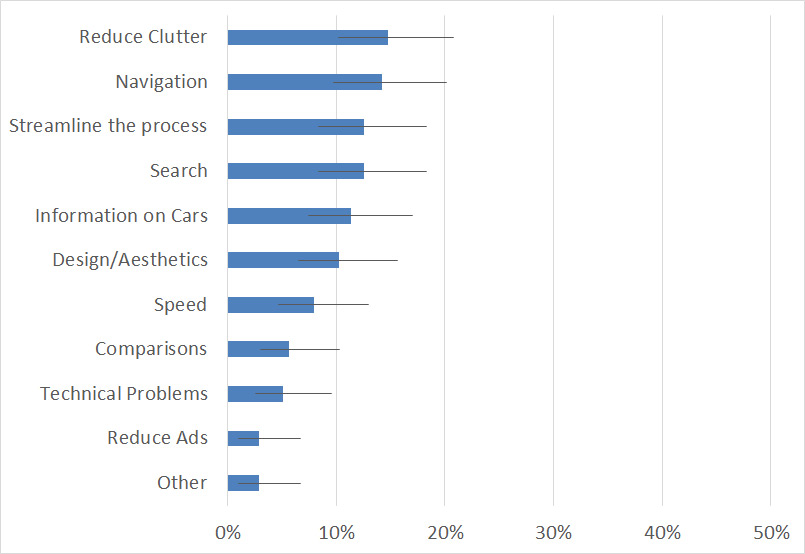
- Add confidence intervals: To better understand the uncertainty that comes with sampling error, add confidence intervals to the percentages.
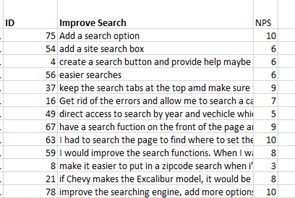
- Create variables: With your comments coded and associated with an ID, you now have a new variable to create additional analyses. For example, the table below shows the raw likelihood to recommend (NPS column) responses from respondents who also wanted to see a Search function.
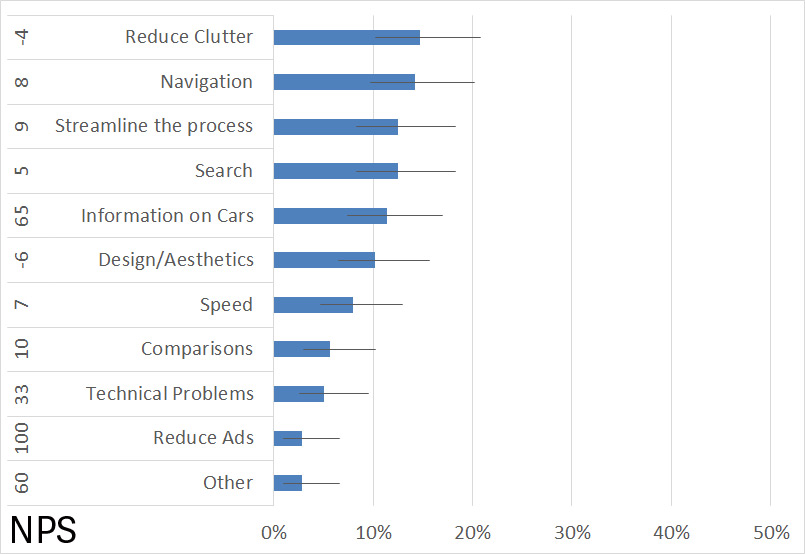
This variable can be used to cross-tab or segment or create a key driver analysis similar to any other categorical variable. The figure below shows the NPS scores associated with each theme. You can see that participants who made comments about “Reduce Clutter” had a Net Promoter Score of -4%.
- Include examples with themes: As with any summarization process, information is lost. Rich detail in comments gets rephrased into more general terms. One of the best way to exemplify the categories and maintain some of that richness in a succinct ways is to display the summarized verbatim categories along with prototypical example verbatim comments (as shown in the figure below.)
Additional Thoughts about Verbatim Coding
Interrater Variability & Training: As with anything that involves human judgment, there will be variability in how an evaluator classifies comments into themes. Some of this variability can be reduced by training evaluators to use a rubric (e.g. when to split themes, better naming conventions, fewer themes). If you have the time and budget, having multiple evaluators will allow you to assess the level of reliability between coders and reconcile differences.
Software & Algorithms: If you’re looking for a systematic way to automatically code issues, consider more advanced software than Excel. But the cost, setup, and the ultimate results may mean these higher tech solutions (which often use machine learning algorithms) aren’t worth it. One of the reasons software algorithms don’t consistently work well, is that the questions and context tend to differ so much from study to study. However, with structured and similar questions between studies and improving technology you may find a benefit.
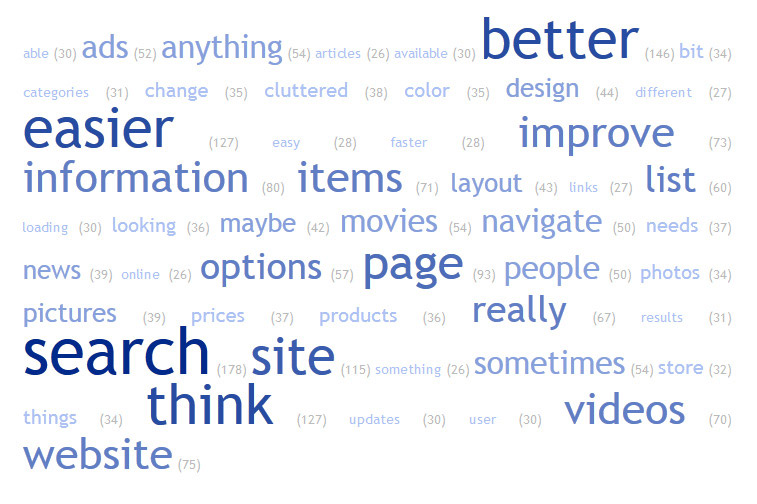
Word Clouds: In our experience, word clouds (like the figure below) are a quick way to visualize the frequency of key words but don’t do a great job of summarizing verbatim comments that are more than a couple words.
Predefined Codes: If you find yourself analyzing the same type of studies on similar interfaces, your analysis may benefit from having predefined themes and codes. This is similar to the idea of diagnostic codes in clinical settings. At MeasuringU the studies we run for clients are unique (different questions and interfaces) but they do share common elements and tasks. We currently don’t use predefined codes but do explore ways to identify common themes, which allows us to quickly identify patterns and suggested improvements.

