 Errors can provide a lot of diagnostic information about the root causes of UI problems and the impact such problems have on the user experience. The frequency of errors—even trivial ones—also provides a quantitative description of the performance of a task.
The process of observing and coding errors is more time-consuming and dependent on researcher judgment than recording task completions or task times. Consequently, errors aren’t collected as frequently in usability studies as other metrics.
But there are times when it’s good to systematically collect them, especially when improving task performance is a primary research goal.
We find that about 10% of the projects we work on with clients involve the process of collecting and quantifying the slips and mistakes participants make. These are almost always moderated remote or in-person studies, where the facilitator can observe interactions.
However, it’s possible to code errors for large-sample unmoderated studies. The approach we recommend depends on whether you have access to videos of the participants’ experiences.
Videos Available
We can start with an obvious solution: if you have recordings of the participants’ experiences, you can watch the videos and code the errors. For example, our MUIQ platform can record participants’ screens on desktop and mobile devices. For some studies, it’s worth the time to review dozens to hundreds of videos and code errors as you would in a moderated study. Reviewing videos allow us to code UI issues, too.
No Videos Available
For many unmoderated studies, it’s not always possible to record screens due to confidentiality reasons or technical constraints. Or you could have videos for some or all participants but don’t have the time to review dozens or hundreds of videos (especially when research findings are needed ASAP).
It’s quite a similar challenge to assessing task completion in unmoderated studies. When you can’t observe users, you have to determine task completion using other means (such as self-reported completion) and other metrics (such as the SEQ).
Some research suggests users can report negative aspects of the experience through self-reporting usability issues. In one study, users reported about half the problems trained usability professionals found, and they even identified some problems the pros overlooked.
We’ve found that what are often referred to as “errors” by product teams also include a mix of bugs and UI problems in addition to the more classic slips and mistakes. With that in mind, we’ve taken a similar approach to self-reporting UI problems and applied it to the broader category of errors.
After each task, we ask participants whether they encountered any problems and if so, to select from a (randomized) list of possible errors/problems they encountered. We also include an open text field for them to report any errors that weren’t listed (see Figure 1).
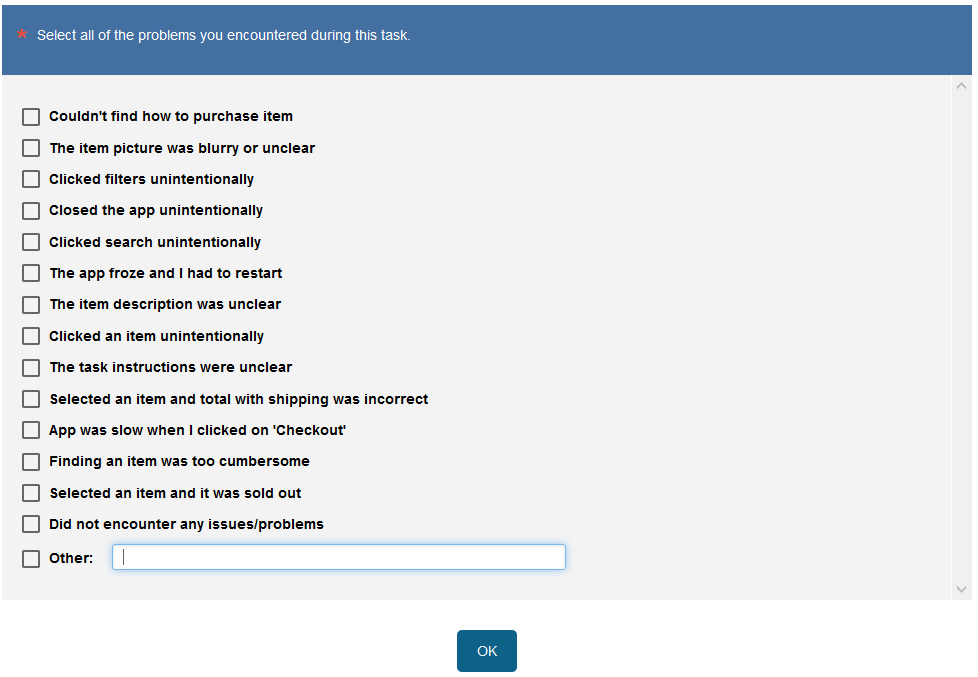
Figure 1: Sample problem list (created with MUIQ).
This approach requires the research team to generate a list of possible errors, problems, and obstacles ahead of the unmoderated study. There are a few ways to come up with this list.
- Use existing error data. Use any data from prior studies in which errors were collected and identified.
- Anticipate the errors. Have a researcher go through the tasks to anticipate the possible errors, similar to how a researchers go through tasks in cognitive walkthroughs, Keystroke Level Modeling (KLM), or PURE analyses.
- Conduct a pilot study. Run a small, moderated pilot study to observe errors and use this as an initial list.
It’s unlikely you’ll be able to provide a complete list of errors for participants to select from, but using any or all of the above options helps increase the chance you will spot a possible error and be able to provide it to participants. Including the open-ended text field also allows participants to provide possible future additions. Figure 2 shows a sample distribution of errors.
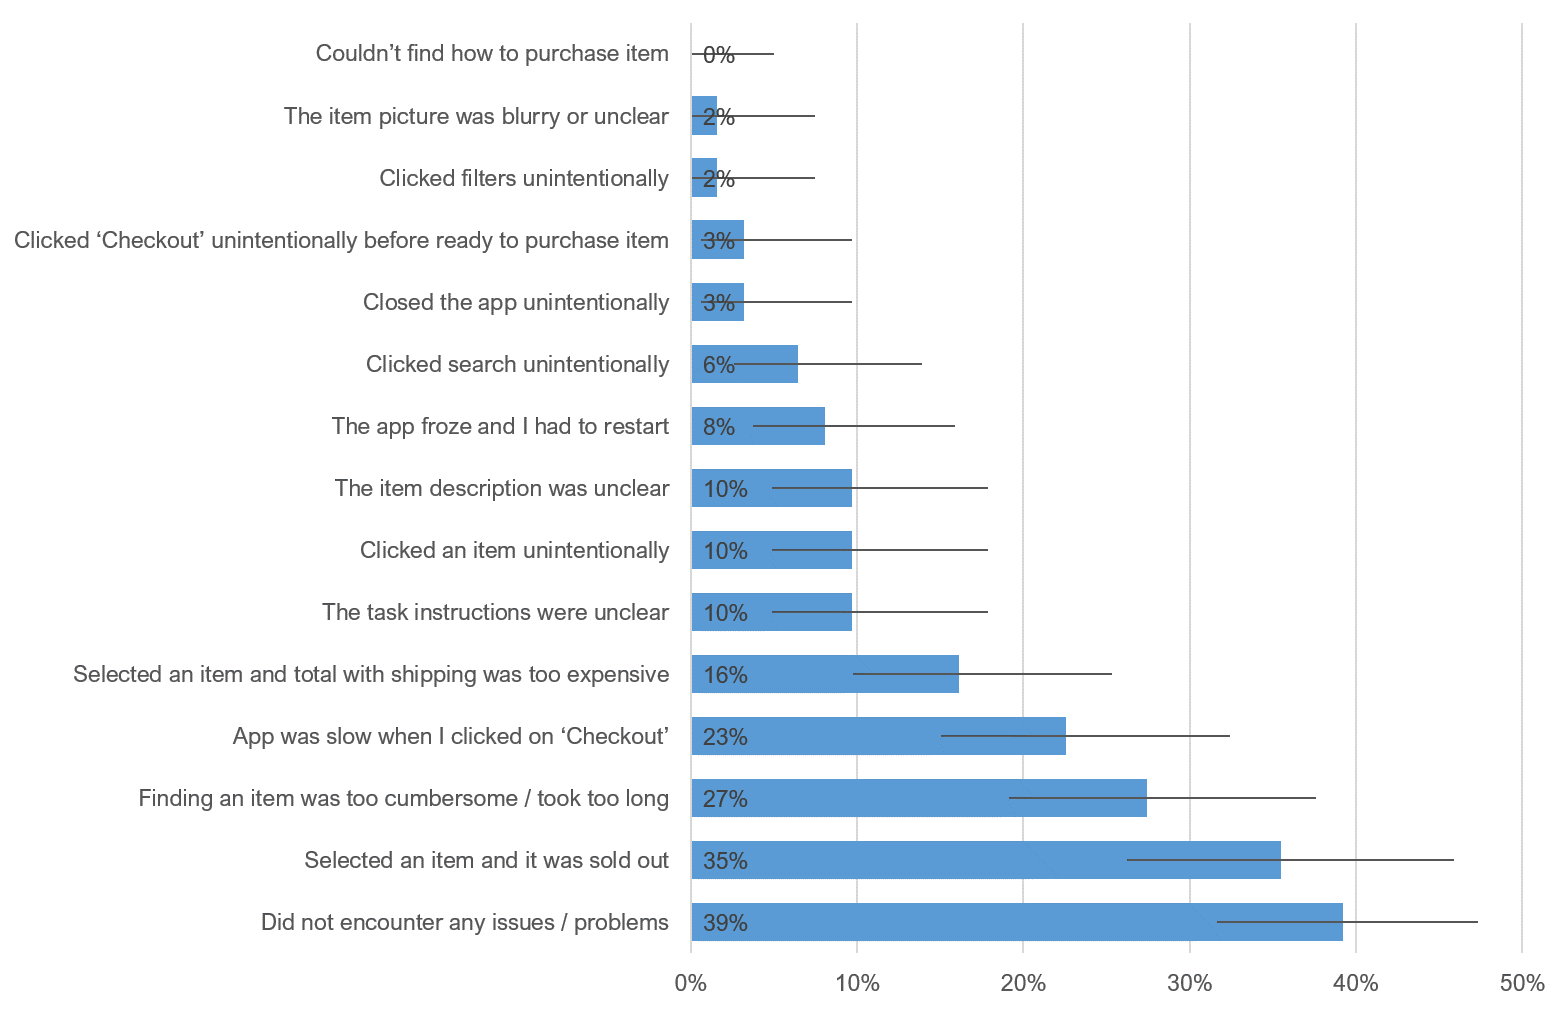
Figure 2: Sample distribution of self-reported errors from an unmoderated study on an eCommerce website.
How Accurate are Self-Reported Errors?
Researchers are understandably suspicious of self-reported data, so it’s good to have some idea about how well it matches more objective, verified means, as we assessed when we examined self-reported purchase data.
Albert and Tedesco (2010) investigated the reliability of self-reported awareness measures based on eye-tracking data. They displayed 20 popular home pages to participants for seven seconds each and then asked whether participants had seen two specific elements on each page. They concluded that the self-reports were reliable, but the level of reliability varied depending on question structure and object type.
We are not aware of research that has examined the accuracy of self-reporting of errors in UX research. We do have some data from our own research which suggests that self-reported errors provide a reasonably reliable indication (at least in aggregate).
To assess the accuracy of the self-reported errors, we compared the errors collected from a moderated study with 11 participants to an unmoderated study with 86 participants. The study was on an eCommerce mobile app that allowed participants to make purchases. We looked at two metrics: the percent of any error reported and the breakdown of types of errors.
We found the overall self-reported error rate for one task to be quite close, differing by only five percentage points (14% vs. 9%). We observed a larger difference of nine points for the second task (27% vs. 18%); see Table 1 for details. The differences are not statistically significant.
| T1 | T2 | |
|---|---|---|
| Unmoderated Self-Reported | 14% | 27% |
| Moderated Observed | 9% | 18% |
Table 1: Overall error rates (percent of users encountering any error) between moderated and unmoderated (self-report) studies for the same two tasks.
Examining the distribution of errors was more challenging because a smaller percentage of users encountered errors (between 14–27% depending on the task). This is especially challenging for the moderated sample where only two of the eleven participants encountered errors, which significantly reduces the statistical power to identify differences. That’s why the percentages in the Moderated column of Table 2 are so large—50% if one of two participants experienced the problem and 100% if they both did. More research is needed to better evaluate the accuracy of this type of error.
| Number Encountering | ||
|---|---|---|
| Task 1 | 11 | 1 |
| UnMod | Mod |
|
| Clicked Wrong Product Name | 0% | 100% |
| App Froze | 8% | 0% |
| Task Instructions Unclear | 25% | 0% |
| Trouble Finding Order Details | 33% | 0% |
| Unintentional Click Elsewhere | 42% | 0% |
| Task 2 | 23 | 2 |
| UnMod | Mod | |
| App Froze | 4% | 50% |
| Unintentional Click Elsewhere | 13% | 50% |
| Incorrectly Clicked Profile | 13% | 0% |
| Task Instructions Unclear | 17% | 0% |
| Trouble Finding Order Details 43% | 43% | 0% |
Table 2: Distribution of specific errors for moderated and unmoderated studies for the same tasks.
Summary
Errors can provide additional details about task performance, helping researchers understand the impacts of UI issues on general task performance. The process of collecting errors tends to be time-consuming but is possible for both moderated studies and unmoderated studies with videos.
Without videos in unmoderated studies, having participants self-report errors from pre-selected lists (and open-ended text boxes) seems to provide a reasonable idea about whether an error occurred, and to a lesser extent, exactly which error occurred.
Preliminary findings suggest a reasonable correspondence between overall error percentages in moderated and unmoderated usability studies. More research is needed to better understand the statistical relationship between counts of errors collected from lists in unmoderated usability studies and those that evolve in the course of running a moderated usability study.