 Should you label all points on a scale?
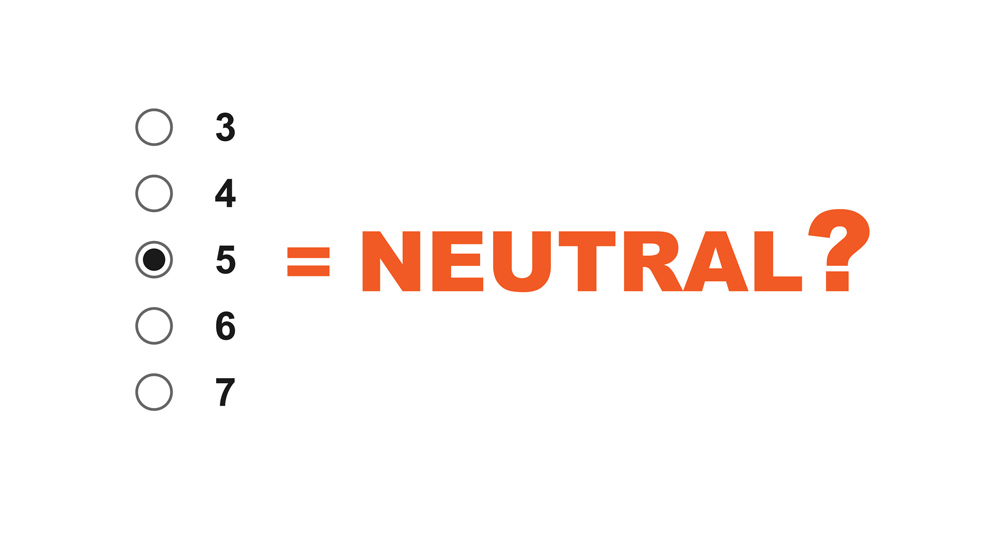
Should you include a neutral point?
What about labeling neutral points? How does that affect how people respond?
These are common questions when using rating scales and they’ve also been asked about the Net Promoter Score: What are the effects of having a neutral label on the 11-point Likelihood to Recommend (LTR) item used to compute the NPS?
For example, I received the following survey about my Xerox printer. You’ll notice the LTR item has the neutral point labeled. How does including or not including the label affect response and the overall Net Promoter Score?
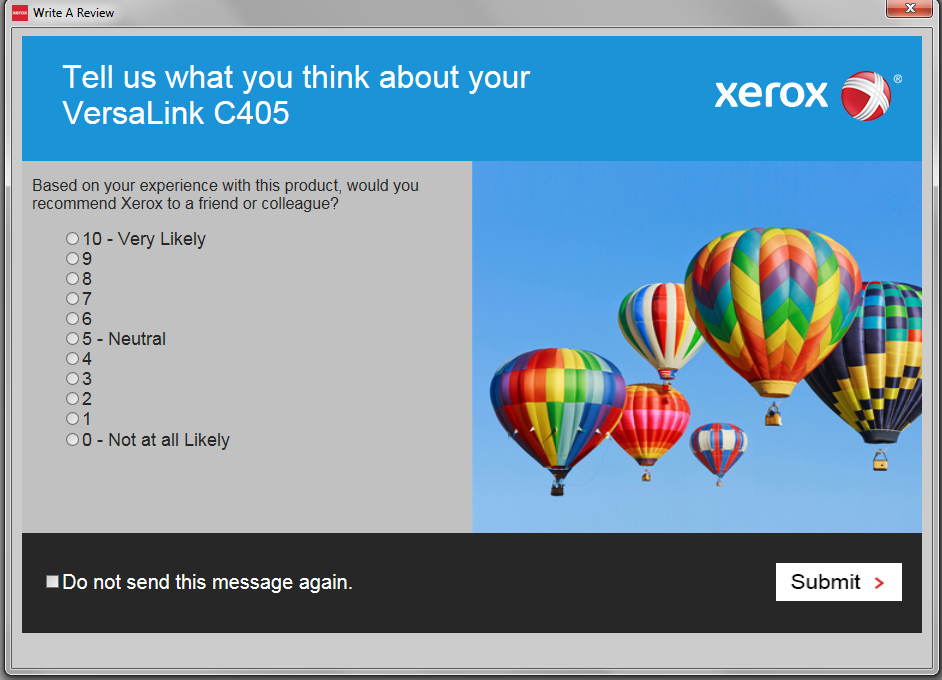
Figure 1: Example LTR item with the midpoint labeled.
As it is often the case unfortunately, most guidance you’ll find in articles about scales is based more on opinion than provided data.
Or worse, some authors argue that if there are any “flaws” or inconsistencies in how measures are collected, then the whole endeavor should be thrown out. That’s misguided. Let’s take a look at the research on neutral point labels on the NPS.
Labeling Neutral Analysis
In the original HBR article, Reichheld mentions that “five means neutral.” However, the neutral label didn’t appear on a scale in the article or in the 1st or 2nd editions of The Ultimate Question.
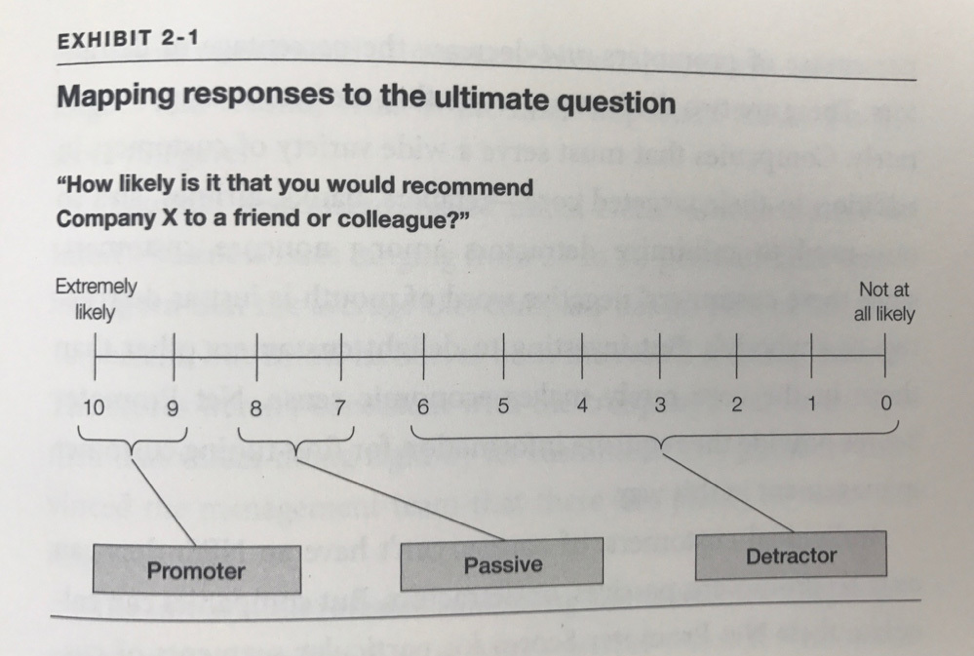
Figure 2: Image from the Likelihood to Recommend item from The Ultimate Question, p. 22.
Some research by Waypoint Group found that including the neutral label compels respondents to choose it more than when it’s not labeled, but few details are given.
A more extensive analysis was conducted by Schneider et al. in 2008 [pdf]. They posited that placing the neutral label on the midpoint would be problematic because neutral “represents a lack of evaluation, rather than a 50% chance of recommending a company.”
In their analysis across two studies and thousands of participants, they also found that the neutral point attracted more responses. However, the 11-point and 7-point versions of the Likelihood to Recommend question with the endpoints and neutral point labeled tended to perform as well or better than fully labeled 7- and 5-point versions in predicting stated past recommendations and historical growth in the airline and car industries.
Their research suggests that while the neutral label may attract responses, it may not necessarily have a deleterious effect on the concurrent or predictive validity of the NPS. They didn’t explore how including the label affects the Net Promoter Score nor did they look at when only the endpoints were labeled in the LTR.
Study 1
To further understand the effects of labeling a neutral midpoint, we conducted our own study to find out how the label may or may not impact the scores.
Between November and December 2018, we collected NPS data from US-based participants in an online panel. Across ten separate studies we collected data from 2,104 participants and asked them the 11-point Likelihood to Recommend (LTR) item on a number of different well-known brands, including airlines, retail stores, and online services:
- United Airlines
- Southwest Airlines
- Delta Airlines
- Netflix
- Microsoft
- Target
- Whole Foods
- 7-Eleven
- Their most recent purchase (any product or service)
- Their most recently recommended company, product or service
Not all participants were shown the same brands so the sample size per brand varied between 502 and 1,027 (roughly split with and without a neutral label).
This gave us a good mix of LTR scores and a range of products and companies. Importantly, responses for both customers and non-customers of brands are included, a distinction Schneider et al. (2008) found important.
Participants were randomly assigned either an LTR item with or without a midpoint as shown in Figure 3. Participants were asked to rate all brands, even if they hadn’t purchased from them. Many of the brands were presented together on the same page, but randomized from survey to survey. This means that response patterns are not independent. This is a similar setup to the data in Schneider et al., but keep this non-independence in mind when interpreting the results.
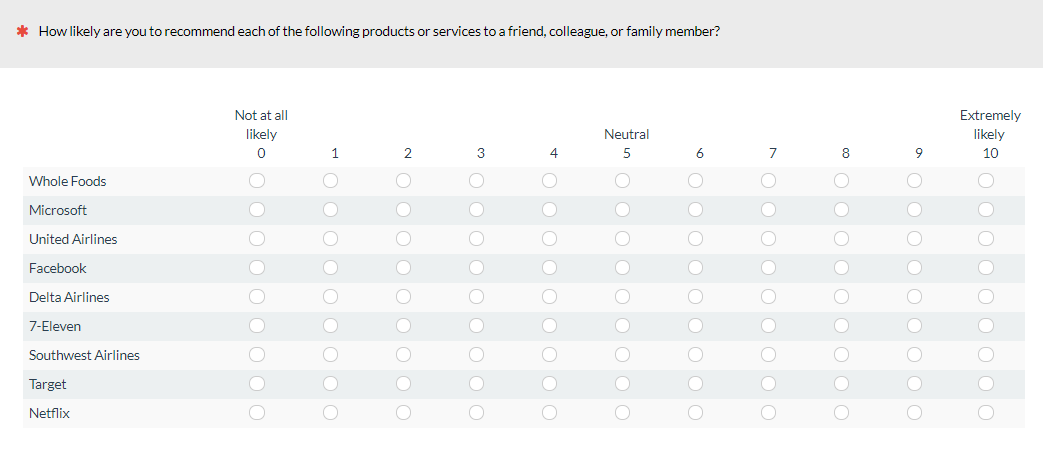
Figure 3: Example of an NPS item with a labeled neutral midpoint.
Results
The Net Promoter Scores for each brand for labeled and unlabeled are shown in Table 1. Overall the Net Promoter Scores are very low with the exception of Facebook. These low scores are a consequence of a substantial number of respondents who have no purchase history with the brand. For example, a recent NPS datapoint on Netflix places it closer to 40% rather than -46% we see here.
For this study, we didn’t collect purchase history for all brands, but we suspect the higher NPS for Facebook is because most respondents had a recent experience with Facebook. Our interest, though, is less about finding NPS benchmarks as understanding possible change in scores.
Table 1 shows that, in general, there are differences in Net Promoter Scores when the neutral label is absent or present. However, none of the differences are statistically significant. Each brand had between 243 and 520 responses for both the Neutral labeled and unlabeled conditions).
| Label | No Label | Diff (Label - No Label) | |
|---|---|---|---|
| Netflix | -51% | -46% | 6% |
| United | -26% | -26% | 0% |
| Southwest | -64% | -57% | 7% |
| 10% | 10% | 0% | |
| Delta | -73% | -66% | 7% |
| Microsoft | -29% | -28% | 1% |
| Target | -69% | -75% | -6% |
| Whole Foods | -48% | -54% | -7% |
| 7 Eleven | -66% | -56% | 10% |
Table 1: Difference in NPS% when using a neutral or no label for both customers and non-customers.
In addition to not seeing statistical differences, there’s not a clear pattern of scores increasing or decreasing. Two scores were higher when a neutral label is present (Whole Foods and Target), two scores were unchanged (United and Facebook), and five increased (7-Eleven, Microsoft, Delta, Southwest, and Netflix).
All the non-customers could be adding noise, however. When we limit the analysis to the most recent purchase and recommendation (by definition, this only includes customers), there is now only a small 1% difference in the aggregated Net Promoter Scores (see Table 2).
| Label | No Label | |
|---|---|---|
| Most Recent Purchase | 36% | 37% |
| Most Recently Recommended Product | 60% | 61% |
Table 2: Difference in NPS% when using a neutral or no label for respondents most recently purchased product and most recently recommended product.
The sample sizes for these groups were substantially larger (between 1,600 and 3,000 for both the most recent purchase and most recently recommended) allowing us to detect much smaller differences. The 1% difference for the most recently recommended product was statistically significant using a Chi-Square analysis of the distribution of promoters, passives, and detractors.
The shift can be seen in Tables 3 and 4, which shows the biggest change in passives from 21% to 26% for the most recently recommended product and from 26% to 30% for the most recently purchased product.
| Most Recent Recommendation | Label | No Label | Diff |
|---|---|---|---|
| % Promoter | 67% | 70% | -3% |
| % Passive | 26% | 21% | 5% |
| % Detractor | 7% | 9% | -2% |
| NPS% | 60% | 61% | 1% |
Table 3: Distribution of promoters, passives, and detractors for the most recently recommend product. Adding a neutral label had the biggest impact on the number of passives.
| Most Recent Purchase | Label | No Label | Diff |
|---|---|---|---|
| % Promoter | 53% | 56% | -3% |
| % Passive | 30% | 26% | 3% |
| % Detractor | 17% | 18% | -1% |
| NPS % | 36% | 37% | 1% |
Table 4: Distribution of promoters, passives, and detractors for the most recently purchased product. Adding a neutral label had the biggest impact on the number of passives.
In both cases, the presence of a neutral label decreased the number of promoters (3%), increased the number of passives (~4%), and decreased the number of detractors (~2%).
Changes in Response Distributions
To further examine the effects of a neutral label, we examined how the distributions might change for both customers and non-customers.
First, we aggregated all responses from customers and non-customers across all nine brands (many of the same participants responded nine times) to get an idea about how the distribution may change with or without the neutral label (see Figure 4).

Figure 4: Change in distribution when the neutral label is present for aggregated (non-independent) responses across all nine brands and recent purchase and recommendation.
Figure 4 shows that indeed the neutral response attracts more responses. The percent of total responses increases from 10% to 16% when the neutral label is present. The number of 0 responses decreases from 11% to 7% when the neutral label is present. Each response option from 1 to 4 also contains more responses when the label is absent, suggesting respondents are more likely to select responses from 0 to 5 when there’s no neutral label.
However, when we look at how the distributions change for only the most recent purchases and recommendations (customers only), the differences are subtler. Figure 5 shows that when the neutral label is present, it only slightly increases the number of 5 responses (from 5% to 7%) but also decreases the number of 10 responses from 45% to 41%.
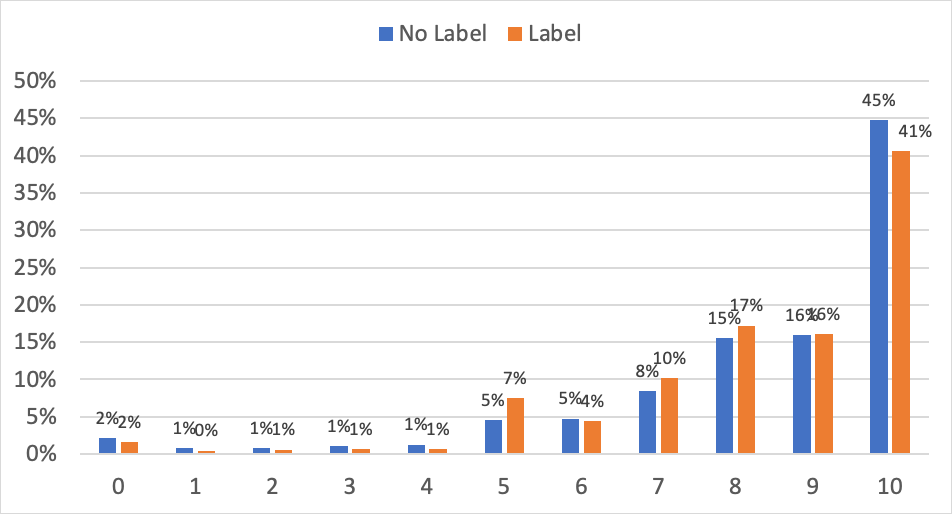
Figure 5: Distribution for responses for only the most recently purchased and most recently recommended product (customers only).
Differences in Means
While we looked at the changes in the Net Promoter Score (promoters minus detractors) we also examined how including a neutral point might affect the mean of the scores. In this case, there is a clear pattern when we examined customers and non-customer means. All brands saw a mean increase, ranging between .05 and .96 with an average increase of .43 on the 11-point scale (see Table 5). Only the increase in Target’s mean score was statistically significant (p <.01).
| Label | No Label | Diff | |
|---|---|---|---|
| Netflix | 4.34 | 4.29 | 0.05 |
| United | 5.89 | 5.50 | 0.38 |
| Southwest | 4.32 | 4.17 | 0.16 |
| 7.37 | 7.09 | 0.28 | |
| Delta | 4.59 | 4.31 | 0.28 |
| Microsoft | 6.37 | 6.09 | 0.28 |
| Target* | 4.30 | 3.34 | 0.96 |
| Whole Foods | 5.23 | 4.69 | 0.54 |
| 7 Eleven | 4.69 | 3.77 | 0.92 |
| Average | 0.43 |
Table 5: Difference in mean LTR scores when including a neutral label. The mean increased by .43 points (on the 11-point scale). * Statistically significant at p <.01.
When looking at only customers we again see that pattern is much less pronounced (Table 6). The average increase was small, at only .04 and .01 points, which is less than 10% of the increase seen when using non-customers. Interestingly, neither is statistically significant (despite the much larger sample sizes).
| Label | No Label | Diff | |
|---|---|---|---|
| Most Recently Recommended Product | 8.8 | 8.8 | 0.04 |
| Most Recent Purchase | 8.2 | 8.2 | 0.01 |
Table 6: Mean difference in LTR scores when using only respondents who are customers or have a relationship with the brand.
Study 2: Users of Consumer Software
To further investigate how the neutral label may be less influential on those who have a relationship with a product or brand, we conducted an additional study on a few consumer software products. In February 2019, we asked 600 participants from an online panel to select which of the following common software products they had used at least once in the last year as well as which product, if any, they used the most:
- Photoshop
- Dropbox
- Google Calendar
- Excel
- iTunes
- McAfee Antivirus
We asked all participants how likely they would be to recommend each product. Half the respondents had the neutral point labeled and half did not. Table 7 shows how the Net Promoter Scores changed based on the presence of the label for only these frequent users of the product.
| No Label | Neutral Label | Diff | # Used Most | |
|---|---|---|---|---|
| Photoshop | 49% | 22% | 27% | 80 |
| Dropbox | 21% | 35% | -14% | 83 |
| Google Calendar | 22% | 49% | -27% | 137 |
| Excel | -33% | -12% | -21% | 87 |
| iTunes | 9% | 4% | 5% | 97 |
| McAfee | 0% | -33% | 33% | 24 |
Table 7: Differences in Net Promoter Scores based on the presence of the neutral label for participants who reported using the software product the most in the last year.
Of the six products we analyzed, we found that the neutral label increased the Net Promoter Score for half and decreased the NPS for half the products (showing an inconsistent pattern). Using a Chi-Square analysis to compare the shifts of promoters, detractors, and passives, none of the differences were statistically significant. The sample sizes were quite small for some products (e.g. McAfee Antivirus had only 24 respondents). This is especially the case when using the top-box minus bottom box scoring which tends to inflate the margin of error.
When looking at the shifts in the mean LTR scores, two products’ means decreased with the presence of the neutral label (Photoshop and iTunes) while the other four increased. Only the 9% increase in the mean LTR score for Google Calendar was statistically significant (p = .027) when the neutral label was present.
When we aggregated the responses across all products, there is very little effect on the distribution of scores. In fact, the percent selecting the neutral response is now virtually identical, as is the percent selecting the 0 response. Some of the higher response options (e.g. 9 and 8) have more responses when the label is present, but the differences aren’t statistically significant (there were 253 and 255 responses in total and 41 and 56 for the 9 responses).
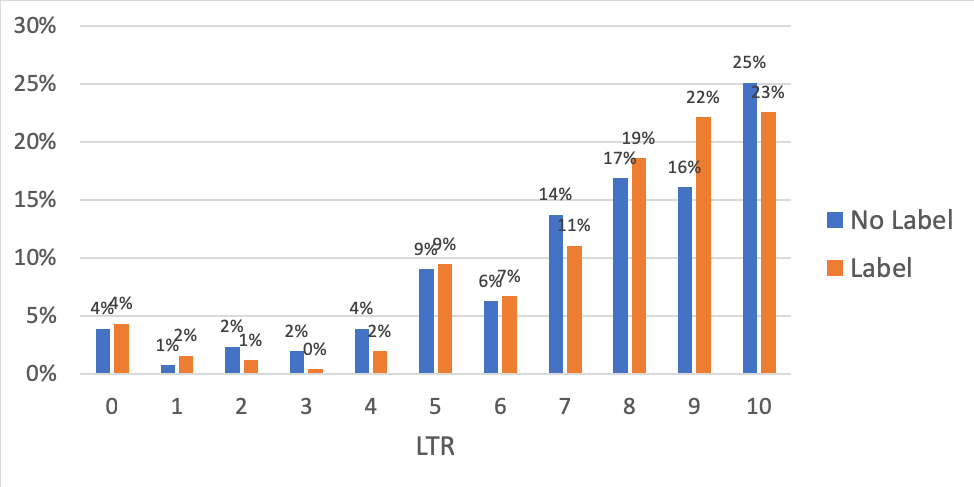
Figure 6: Distribution for responses for only the most frequently used software products.
Unlike earlier when examining customers’ most recent purchase and recommendation (Tables 3 and 4), we now see a different pattern. This time the number of passives actually decreased slightly (31% to 30%), the number of promoters increased (41% to 45%), and the number of detractors decreased (28% to 26%) with the presence of a neutral label.
10-Point Neutral Labels
Some organizations use a 10-point version of the LTR item. In an earlier analysis, we found only subtle differences in scores when using the 10- instead of the 11-point version. If your company uses a 10-point version, we recommend sticking with the same number of points to benefit from historical comparisons (any deviation from the 11-point version may sacrifice comparability to external benchmarks).
With a 10-point version there actually is not a neutral point because 10 is an even number, so we were curious to find out what the effects would be.
To see how the neutral label affects 10-point versions, we also manipulated the label for 501 respondents for several well-known brands including retail, airlines, and rental cars:
- Amazon
- Apple
- eBay
- BestBuy
- Walmart
- Target
- United
- Southwest
- Budget
- Enterprise
As in the first study, participants were randomly shown a 10-point scale with the 5 labeled neutral or without a label. Participants responded to all brands, even if they had no relationship with them. The brands were randomized but presented together in a grid (e.g. all retail sites were shown together). Therefore again, the responses are not independent, meaning there are potential carry-over effects from one response to the next.
We aggregated all the responses across the brands so there were 2,377 responses for the no-label condition and 2,445 for the label condition. We found similar results to the 11-point version. Figure 7 shows the different distributions.
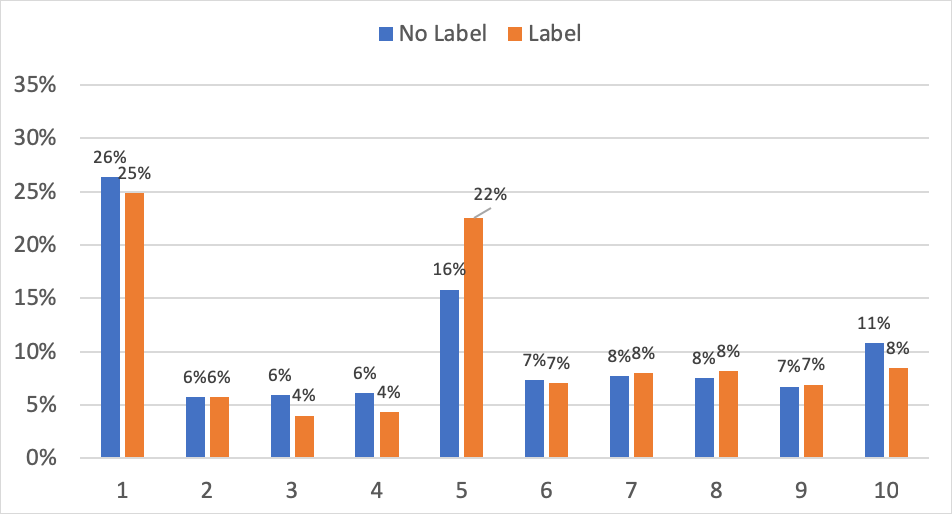
Figure 7: Differences in distribution for a 10-point version of the LTR item.
With the presence of the neutral label, even when 5 wasn’t neutral, more participants selected the 5 response (22% vs 16%) supporting the idea that a Neutral label can attract more responses (in some cases).
Summary
Across multiple studies examining the effects of labeling the neutral midpoint of the LTR item, we found the following:
Having a neutral label sometimes attracts responses (but not always). As suggested in earlier studies, adding a neutral label will attract more respondents to the midpoint option. This happens for both the 11-point and 10-point versions of the LTR item. However, the differences (when they occurred) were generally small and often not statistically significant, even with large sample sizes for recent purchases or recommendations.
Neutral labels may attract other low scores for non-customers. Adding the neutral point label appears to attract other “detractor” responses from the 0 to 4 range when using non-customers only. When a neutral label was included, the percent of 5 responses increased from 10% to 16% for respondents who didn’t have a recent purchase history with the brand. Interestingly though, this doesn’t have a significant impact on Net Promoter Scores (most still remain detractors), but it does tend to increase the mean scores.
Neutral labels mostly affect non-customers. While we saw a change in response patterns, the difference was most pronounced when we included non-customers and generally disappeared for respondents with a recent experience with the brand. When people don’t have a relationship with a brand, it’s hard for them to recommend it. A neutral label provides a logical choice for people who have no opinion. If you’re collecting NPS data from non-customers, consider NOT having a neutral label, having an N/A option, or allow participants to skip it. It may reduce the noise (albeit a small amount) in your analysis by separating true detractors from those who just don’t have any experience with the brand.
There’s no clear pattern on Net Promoter Scores. Across nine brands that included both customers and non-customers, we found nominal differences in Net Promoter Scores. However, none were statistically significant (with medium sample sizes of 250-500 per condition) and there wasn’t a clear pattern of increasing or decreasing scores. This was especially the case when looking at frequent users of software products; none of the differences were statistically significant and there was no clear pattern of an increase in neutral responses or decreasing scores nor of a consistent pattern in shifts in promoters, passives, and detractors.
The means increased with a neutral label. While the NPS wasn’t systematically affected, we did find a clear pattern of the mean LTR score increasing when using a neutral label. This was again most pronounced when including non-customers. All nine brands saw increases in scores (which included a substantial number of non-customers). When examining frequent users of software, the effects were again smaller, with only one of six products having a statistical increase in mean LTR scores and two having means scores decreasing.
Small differences exist but be consistent. This analysis suggests that including a neutral label will have a negligible impact on Net Promoter Scores and means when collecting data from existing customers. Even when using non-customers to collect NPS data the differences were modest. As is often the case with changes in scale points or labels, differences are generally small and it’s more important to be consistent over time. If you’re starting out data collection, it’s probably best to leave off the Neutral label when asking about Likelihood to Recommend.
Higher scores may mask impact. We generally see that the neutral label mainly has an impact on people with little or no experience with a brand. For current customers or users of software, there is little effect. One possible explanation is that people with experience with a product are generally more likely to recommend it and so don’t consider the lower end of the scale (below 7) as much as those who have little experience (consequently the neutral label doesn’t have as much impact). A future analysis can see whether higher LTR scores are masking a possible effect of the neutral label by examining customers only, but for a range of brands that have lower Net Promoter Scores.


