 The pandemic had sudden and significant impacts on many industries, including grocery delivery, online meeting software, and vacation rentals.
Understandably, people significantly increased their visits to news websites to understand the impacts of the virus and governments’ responses to it.
Fake news and misinformation; fact-checkers who need fact-checkers: it’s become challenging to disentangle the biases of organizations, and readers have become increasingly critical of their news sources. Not surprisingly, a recent YouGov poll shows that most people don’t trust news sources, especially traditional news sources. In fact, only the Weather Channel is trusted by more than half of US citizens—which is a pretty low bar when you consider the typical skepticism most have for weather forecasters! So far, we haven’t politicized the weather (e.g., no claims of fake rain).
The YouGov poll also made clear that there is a significant partisan divide of news sources driven by political ideology. Our analysis doesn’t track political affiliation, but we had a similar panel composition in our 2017 study.
To find out what aspects of online news usage are driving customers’ attitudes and behaviors, and which websites are excelling, we collected data on a variety of attitudes and intentions toward some of the largest (mostly) U.S. news websites:
- The Atlantic
- BBC
- BuzzFeed
- CNN
- Fox News
- The Guardian
- HuffPost
- The New York Times
- Refinery29
- Rolling Stone
- Travel + Leisure
- VICE
- The Wall Street Journal
- The Washington Post
We computed SUPR-Q® and Net Promoter scores, investigated reasons for using the websites, measured users’ attitudes regarding their experiences, conducted key driver analyses, and analyzed reported usability problems.
Benchmark Study Details
From February 2022 to March 2022, we asked 675 online news users in the U.S. to recall their experiences using, and their perceptions of, one each of the listed online news providers on its desktop site and its mobile app in the past year.
Participants completed the eight-item SUPR-Q (which includes the Net Promoter Score), answered the UX-Lite standardized questionnaire, and answered questions about brand attitudes, usage, and their prior experiences.
Quality of the News Website User Experience: SUPR-Q
The SUPR-Q is a standardized measure of the quality of a website’s user experience. It has become the standard for measuring attitudes toward the quality of a website user experience. It’s based on a rolling database of around 200 websites across dozens of industries.
SUPR-Q scores are percentile ranks that tell you how a website experience ranks relative to the other websites (50th percentile is average). The SUPR-Q provides an overall score as well as detailed scores for subdimensions of Usability, Trust, Appearance, and Loyalty.
The fourteen news websites in this study collectively averaged at the 36th percentile. The Atlantic scored best at the 75th percentile, and BuzzFeed scored the lowest at the 7th percentile.
Usability Scores and Trust
We asked participants to reflect on how easy they thought it was to use and navigate through the websites. Travel + Leisure had the highest usability score (84th percentile) and The Wall Street Journal had the lowest (32nd percentile). Comments about The Wall Street Journal regarding usability included
- “The website isn’t clean to look at or very intuitive to navigate. They try too much to make it seem like a physical newspaper.”
- “There’s a constant call-to-action to subscribe. News is free on so many platforms that charging and constantly pestering people is an odd tactic.”
We also asked participants to reflect on the trust and credibility of the news websites. Travel + Leisure had the highest Trust score (80th percentile). BuzzFeed had the lowest (1st percentile). Based on respondents’ feedback, this may be related to the amount of perceived bias or exaggeration in articles and videos.
- “I find that its more opinion based and not exactly trustworthy credible information. [It’s] more of an entertainment website.”
- “Their views are extremely biased and not inclusive at all. They report only things that fit with their narrow liberal viewpoint.”
More verbatim comments are available in the downloadable report.
Loyalty/Net Promoter Scores
All the news websites received relatively low NPS (fewer promoters than detractors). The average NPS was −15%. The BBC and The Atlantic both had the highest NPS (0%), while VICE received a fairly low score of −36%.
In general, a better user experience is a good predictor of customer loyalty.
Use of News Websites and Mobile Apps
As a part of this benchmark, we asked participants how they accessed the online news services. All participants reported using their desktop/laptop computers (this was a requirement for participation in the survey); 20% also used mobile apps and 72% used mobile websites (low mobile app but high mobile website usage).
The typical frequency of use was a few times a month to a few times a year for desktop/mobile websites. Usage patterns were similar for mobile apps and mobile web, with many respondents never using them. For those who did use them, the typical frequency of use was a few times a month to a few times a year. The New York Times was the most frequently used mobile app and mobile website.
Key Drivers of the News Experience
To better understand what affects SUPR-Q scores and Likelihood-to-Recommend (LTR) ratings, we asked respondents to rate the following attributes of the news websites on a five-point scale from 1 (strongly disagree) to 5 (strongly agree). We conducted key driver analyses (regression modeling) to quantify the extent to which ratings on these items drive (account for) variation in overall SUPR-Q scores and, separately, LTR (the rating from which the NPS is derived).
- The website provides unbiased news.
- The website contains the most up-to-date current events.
- The homepage contains a good selection of news stories.
- It is easy to find articles I am interested in.
- The articles available on the website are impactful.
- The articles available on the website are concise and to the point.
- The website presents statistics and data in an easy-to-understand manner.
- The ads on the website don’t interfere with reading content.
- The website loads quickly.
- I frequently share content from this website.
- It’s easy to share content from this website.
- It’s easy to comment on articles on this website.
- The images on the website are high quality.
- The images on the website are relevant to the content.
- I can get all my news from this website.
- The search results are relevant.
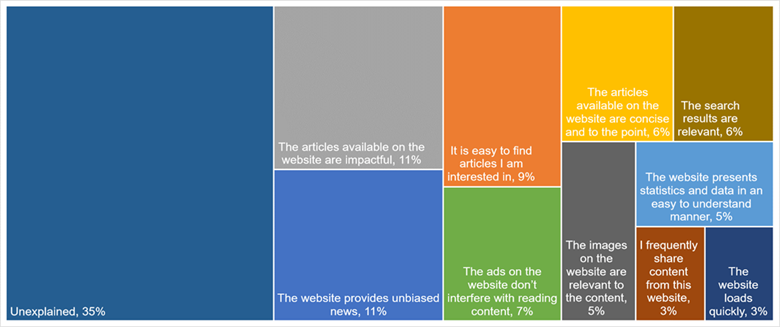
SUPR-Q Drivers. As shown in Figure 1, the top key drivers from the list above were “The website provides unbiased news” and “The articles available on the website are impactful” (each accounting for 11% of SUPR-Q variation).
Other significant key drivers were “It is easy to find articles I am interested in” (9% of variation) and “The ads on the website don’t interfere with reading content” (7% of variation).
Comparison with 2017 Data
We conducted a study in 2017 with a similar panel composition from a subset of the websites (n = 564). Overall, there was a slight decline in NPS for these seven websites, from −9% to −13%. Fox News had the largest increase in NPS (from −42% in 2017 to −19% in 2022) while The New York Times had the largest drop (from 20% to -4%). Although The New York Times continues to have a higher NPS than Fox News, the gap has narrowed.
Of the websites we surveyed in both 2017 and 2022, HuffPost had the greatest increase in Usability scores (from 53rd to 78th percentile), while The New York Times had the greatest drop (from 74th to 46th percentile).
There was a consistent decline in Trust from 2017 to 2022 (from an average of 42nd percentile to 32nd percentile). All websites except HuffPost suffered drops in Trust. In the 2017 analysis, BBC and The New York Times were tied with the highest Trust scores (77th percentile), but BBC dropped to the 62nd percentile and The New York Times to the 56th percentile in 2022. Both CNN (30th to 9th percentiles) and The New York Times had the largest drops in Trust scores.
Across the seven news websites included in the 2017 study, all had decreased appearance scores since 2017 (changes in percentile rankings from −16 for Fox News to −39 for BBC). This is consistent with our qualitative insights for what to improve.
What to Improve
There were a few common problems and frustrations that respondents had across the news websites, such as (1) too many advertisements or pop-ups and (2) too many paywall gates or membership requests. News organizations continue to find the balance between viable revenue models and not excluding or annoying too many readers or potential readers.
Specific key areas of improvement cited by respondents for each website/app include:
- The Atlantic: Layout is cluttered/messy (e.g., “The website is really overwhelming and cluttered. There is an immense amount of content organized in a way that is often not intuitive or clear. More recent stories are shown first, it seems, but how they are arrayed after that is unclear. A reader may miss a great articles simply because they looked at the first few and did not scroll down because it is just too much content.” )
- BBC: Too many ads/pop-ups (e.g., “There are a lot of ads and pop ups when reading articles.” )
- BuzzFeed: Too many ads/pop-ups (e.g., “[I have] the same notification that I have earned an award and it’s the same award I’ve had for over a year. It pops up every time I log in.” )
- CNN: Too many ads/pop-ups (e.g., “The only issue I have is with an ad, blocking a portion of the article, no matter what I do to try to move or close it.” )
- Fox News: Don’t like political outlook/bias (e.g., “Extreme bias against democrats. … I really wish that news could just be news and not be twisted.” )
- The Guardian: Paywall/membership request (e.g., “The giant subscription ad that pops up every page.” )
- HuffPost: Don’t like layout design/aesthetic (e.g., “The layout is not that attractive.” )
- The New York Times: Paywall/membership request (e.g., “I hate the fact that The New York Times site is behind a pay wall. I understand that the site needs to make money, but I would think that such a prestigious site would be able to survive using ad revenue. Especially given the fact that the NYT has had a few unsavory scandals lately, I am unmotivated to pay for coverage.” )
- Refinery29: Layout is cluttered/messy (e.g., “The website is extremely crowded looking, and many times I’ll go to the front page but then immediately exit out of it because I just feel so overwhelmed by this gigantic page with a hundred articles to click on.” )
- Rolling Stone: Too many ads/pop-ups (e.g., “[It’s] ad city. Instead of easily accessing the information you want you have to dodge ads. It is quicker to just look somewhere else.” )
- Travel + Leisure: Don’t like some content/articles (e.g., “I feel like it is not directed towards the free-thinking traveler or those on a true budget.” )
- VICE: Difficult to navigate/find content (e.g., “Navigating the site could be a little more intuitive.” )
- The Wall Street Journal: Paywall/membership request (e.g., “Almost everything costs money to read.” )
- The Washington Post: Too many ads/pop-ups (e.g., “I usually find the number of advertisements throughout their website to be quite annoying and turn me off from wanting to read any additional articles at length.” )
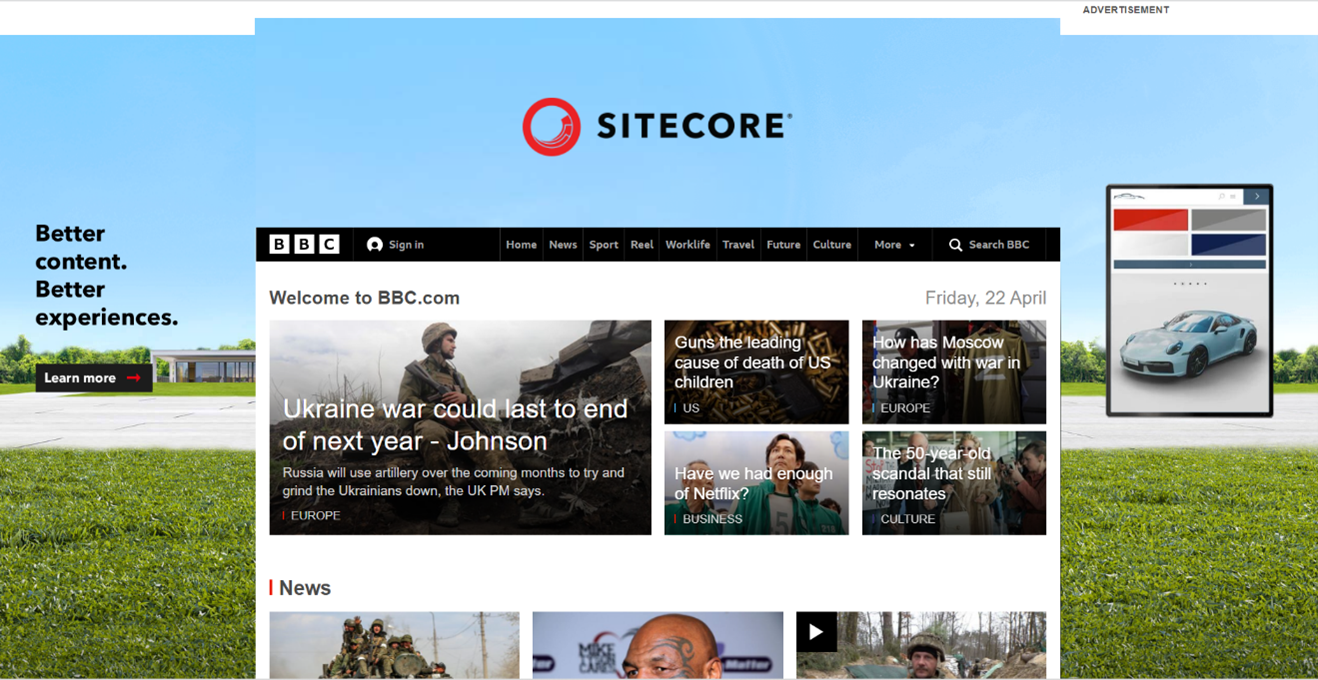
Figure 2 shows a screenshot of BBC’s website, highlighting the intrusiveness of advertisements. In this instance, the entire BBC home page was scaled down (text and pictures included) to fit a fully encompassing advertisement. These broad ads and pop-ups can cause dissatisfaction and discourage users from using the BBC website.
Summary and Takeaways
An analysis of the user experience of the fourteen news websites found:
- SUPR-Q and NPS were mostly below average. The websites had SUPR-Q scores ranging from the 7th to the 75th percentiles (a mean 36th percentile where the 50th percentile is the average for all websites in our current normative database). The average NPS across the websites was −15% (fewer promoters than detractors). These results show that this sector has below-average UX and loyalty.
- There was a slight decline in NPS from 2017 to 2022. The mean for the seven websites we studied in 2017 was −9%; in 2022, the mean for those sites was −13%. Fox News had the largest increase, while The New York Times had the largest drop (from 20% to −4%). Although The New York Times continues to have a higher NPS than Fox News, the gap has narrowed.
- There was a consistent decline in Trust from 2017 to 2022. All websites included in both studies except HuffPost saw drops in their Trust percentile scores.
- Users are frustrated by too many advertisements/pop-ups and too many paywall gates/ membership requests. Verbatim comments indicated ads/pop-ups were very problematic on five websites, while paywall/membership requests were very problematic on three sites.
- Key SUPR-Q drivers were “The website provides unbiased news” and “The articles available on the website are impactful.” In all, we found 10 significant key drivers of the SUPR-Q, including “It is easy to find articles I am interested in” and “The ads on the website don’t interfere with reading content.”
Full details are available in the downloadable report.