Product Description
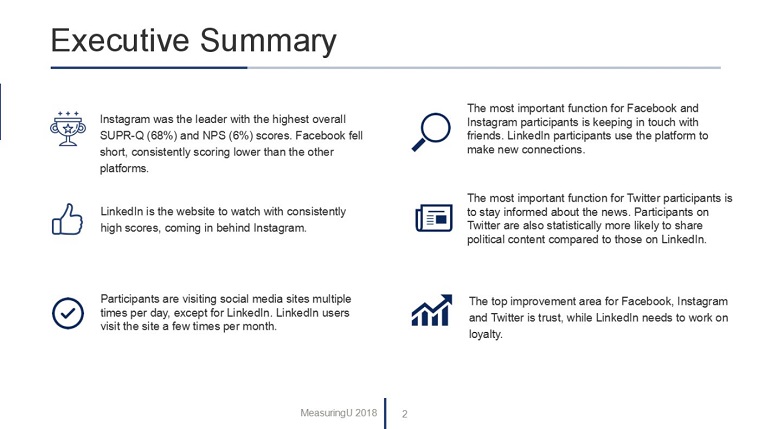
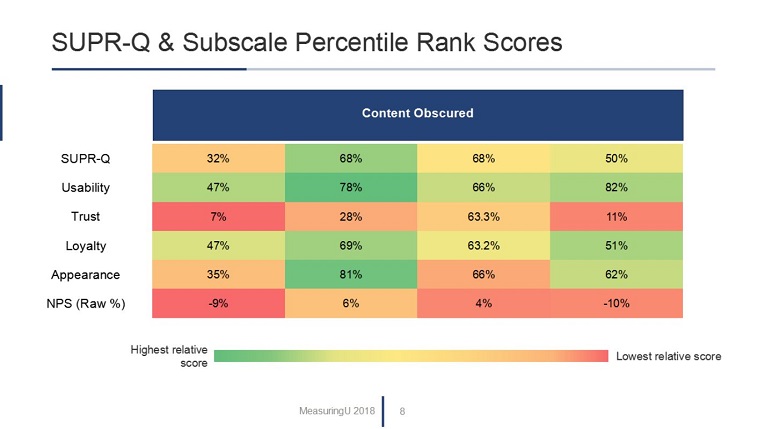
An analysis of 195 participants on four social media desktop websites: Facebook, Instagram, Twitter and LinkedIn. This report contains UX benchmarks (SUPR-Q and task-metrics), Net Promoter Scores, and behavioral data from Q1 2018.
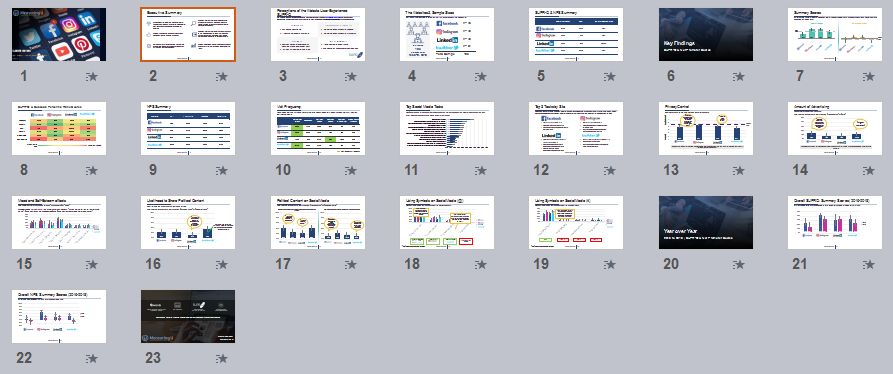
Table of Contents
Study Overview
SUPR-Q Scores
Usability
Loyalty
Trust & Credibility
Appearance
Net Promoter Scores
Past Experiences & Visit Frequency
Top Tasks By Site
Perceptions of Privacy
Amount of Advertising
Mood & Self-Esteem Effects
Political Content
Symbols on Social Media
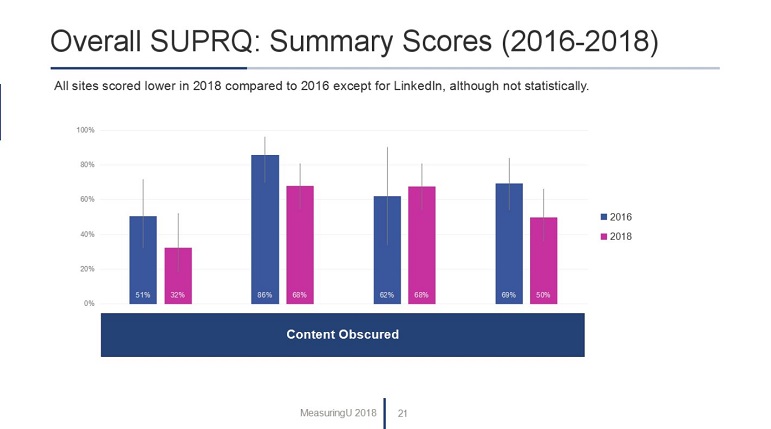
2018 to 2016 Comparison


