 When approaching a UX research project, one of the first things to consider is the method. And UX research has many methods.
Methods can be categorized as quantitatively focused (e.g., A/B tests) or qualitatively focused (e.g., interviews). Most UX research methods can collect both qualitative and quantitative data.
For example, surveys often collect both closed-ended rating scale data to generate quantitative metrics and open-ended questions for qualitative comments.
Usability testing can identify both what problems users encounter (qual) and how long users take to complete tasks (quant). To this end, it’s good to think not “quant or qual” but “quant and qual” for a mixed-method research approach.
The first step in conducting UX research is to think about the goals. With well-articulated research goals in mind, you can take the next step to operationalize them and think about how you will meet those goals, considering both the general approach and the exact method within that approach.
An approach we use at MeasuringU to help operationalize research questions is to look for certain keywords that signify whether qual or quant data would better address them.
While these words can signify both qual and quant research questions, these tend to be associated more in one than the other. Figure 1 shows the keywords with quant on the left, qual on the right, and mixed in the middle.
When approaching a UX research project, one of the first things to consider is the method. And UX research has many methods.
Methods can be categorized as quantitatively focused (e.g., A/B tests) or qualitatively focused (e.g., interviews). Most UX research methods can collect both qualitative and quantitative data.
For example, surveys often collect both closed-ended rating scale data to generate quantitative metrics and open-ended questions for qualitative comments.
Usability testing can identify both what problems users encounter (qual) and how long users take to complete tasks (quant). To this end, it’s good to think not “quant or qual” but “quant and qual” for a mixed-method research approach.
The first step in conducting UX research is to think about the goals. With well-articulated research goals in mind, you can take the next step to operationalize them and think about how you will meet those goals, considering both the general approach and the exact method within that approach.
An approach we use at MeasuringU to help operationalize research questions is to look for certain keywords that signify whether qual or quant data would better address them.
While these words can signify both qual and quant research questions, these tend to be associated more in one than the other. Figure 1 shows the keywords with quant on the left, qual on the right, and mixed in the middle.
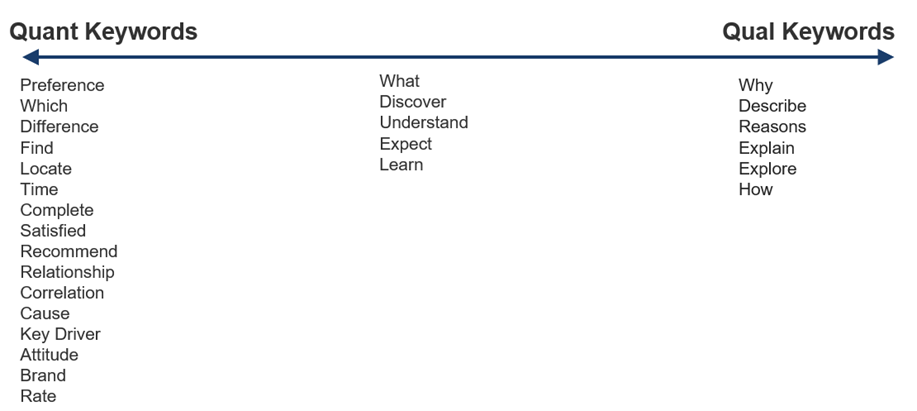
Figure 1: The 27 primarily quant, qual, and mixed-method keywords.
Quantitative Words
The following words are commonly (but not always) associated with research questions answered with quantitative data. Preference: If you want to know which design users prefer between several options, you should compare preference data. Choosing a design based on the preference of a small sample is risky unless the differences are substantial. Which: A variation on preference is to know which variant (e.g., design element, content, feature) users prefer. Difference: Determining differences in attitude or behavior requires measuring (e.g., completion, preference, time, brand attitude) and using a statistical comparison. Find: To determine whether users can locate a piece of functionality or content is best answered quantitatively by measuring the percentage of successful findings. Locate: A variation on finding, often phrased as whether users can locate (or find) something, but it’s almost always expressed as the percentage of users who can find something. Time: The quintessential efficiency measure collected at the task level. Complete: The fundamental usability metric and common measure of effectiveness. Completion can be easily assessed from low-fidelity prototypes to fully functioning products with a definition of task success. Satisfied: Satisfaction is a fundamental measure of attitude, which can affect (and predict) behavior and is best measured using standardized scales. Recommend: Intention to recommend is a common measure of loyalty, often assessed with a linear numeric scale and used as the basis of the Net Promoter Score. Relationship: Understanding the association between variables such as design elements and behavior or attitudes and action (LTR and recommend behavior) is quantified. Correlation: This is the most common way of measuring associations, usually using the correlation coefficient that ranges from −1 (perfect negative) to 1 (perfect positive). Cause: Correlation is necessary to establish a relationship, but it is insufficient to establish causation, which needs an experimental design. Key Driver: A method for understanding which independent variables (e.g., features, experiences) have the biggest impact on a dependent variable (e.g., likelihood to recommend). Attitude: Attitudes are best measured using standardized scales. Common ones include satisfaction, performance, agreement, and intention (e.g., to recommend or reuse). Brand: Brand awareness, brand favorability, and brand preference can be quantified using linear numeric scales. Rate: Both the act of rating (e.g., rating ease or satisfaction) and the rates themselves (e.g., completion rate or rate of agreement) are quantifiable.Qualitative Words
The following words are commonly (but not always) associated with research questions answered with qualitative data. Why: Where quant tells the what, qual provides the why to explain the motives and reasons behind preferences, attitudes, and behaviors. Describe: Describing what happened (including motivations, complex interactions, and unexpected behavior) typically starts with qualitative inquiry. Reasons: Reasons motivate behavior, such as the details behind the why or the reasons for the quantitative outcome. Explain: Understanding a phenomenon requires explanations often gained through observing and interviewing. Explore: When something is poorly defined or unknown, you must explore to begin to understand. How: Key questions used to explore and explain behavior and attitudes often involve asking how.Mixed-Use Words
We’ve seen these words in questions that researchers can address with either qual or quant data. What: Identifying an unknown reason, a location, a path, or a decision is often part of exploratory qual research that researchers can use later in quant research. It can also be used as the beginning of a quantitative question, such as what features are most important. Other wh- words, such as who, when, and where (e.g., who are our users, where do they live), are often special cases of what research questions in quant or qual questions or both. Discover: Often used broadly to capture where people navigate within interfaces, what content or features they select, and why they select those (a mix of quant and qual). Understand: This can be a description of understanding a phenomenon (qualitative), and it can also gauge user understanding. A user’s understanding starts from having correct knowledge, but deeper understanding usually means taking the correct next actions (primarily quant). Researchers also have understanding as a goal when they conduct advanced quantitative analyses such as ANOVA, cluster analysis, and multiple regression. Expect: Investigating what people expect when they click a button or use a feature can lead to descriptions of what’s expected (qual). It can also involve enumeration of the variation in expectation—such as 30% of users expecting a total price with fees included (quant). Learn: Learn often appears in research questions as a qualifier on understanding or as a precursor to what, so you’ll find it in qual and quant research both (e.g., learn what features are the most important).Examples
Table 1 shows ten examples of research questions with a different mix of keywords (bolded) and their classification as primarily quant or qual (or both).| Question | Quant | Qual |
|---|---|---|
| Why aren’t people paying their bills via the mobile app? | X | |
| What do users expect when they click the icon? | X | |
| Which entry points and menu locations do users prefer? | X | |
| Learn users? thoughts about online shopping. | X | |
| How likely are people to recommend the new app? | X | |
| Do users understand how to make the player full screen? | X | X |
| Which prescription order form is easier to use? | X | |
| Which icons are preferred? | X | |
| What are the first impressions people have of the homepage? | X |
Table 1: Ten examples of quant and qual research questions with keywords.