
UX research pulls many terms, methods, and conventions from other fields.
Selecting a method is an important first choice in measuring the user experience. But an important next step is understanding the variables you’ll have to deal with when designing a study or drawing conclusions.
Variables are things that change. Variables can be controlled and measured.
It sounds simple enough but there are actually different types of variables and understanding the difference is one of the keys to properly interpreting your findings (and avoiding common mistakes). In this article, I’ll cover the differences between five different variables: dependent, independent, latent, observed, and extraneous/nuisance variables.
Dependent (Outcome) Variables
The dependent variable (often called the outcome variable) is what we hope changes when we change an interface—either through a new design or from fixing problems. Dependent variables are more easily recognized as commonly used UX metrics. For example, in usability tests with tasks, common task-level (dependent variable) metrics include completion rate, task time, and perceived ease (using the SEQ).
There’s more to the user experience than task-performance metrics. Other common dependent variables include people’s broader attitudes. Attitudes towards the brand, ease of use, trust, and appearance are also examples of dependent variables.
These attitudes are operationalized (turned into something you can measure) using questionnaires with rating scales, such as the SUS, SUPR-Q, and UMUX-Lite. Attitudes, when measured properly, can be good predictors of behavior, may explain behavior, and are often much easier to measure than behavior. For example, one of the key drivers of dating website usage and referral behavior is users’ trust in the quality of the people (and few scams) on the dating platforms.
Effective UX research links more traditional task and product metrics to higher level business metrics, such as retention rate, revenue, number of calls to customer support, and referral rates. For example, increasing trust from users on a dating website can be linked to increased time and usage on the platform and the corresponding revenue that it brings.
It’s a common mistake to want a dependent variable to tell you what to fix. After all, if you’re going through the trouble of collecting UX measures, don’t you want the payoff of getting some diagnostic information? You will get diagnostic information, but it usually won’t come from the dependent variables directly.
The outcome of these metrics DEPEND on the independent variable. Instead of looking to the dependent variables on what to do, you should look to the independent variables to understand what caused the change and what you can do to hopefully improve the dependent variable (or if a change was made, if it led to an improvement). I’ll cover selecting dependent variables in more detail in a future article.
Independent Variables
The independent variables are what you manipulate or change. This manipulation can be specific design changes within an interface or app, such as a redesigned form or new navigation labels. But it can also be alternative versions of the same design (version A or B), a current version and competing version, or different tasks you administer in the same study. Using the language of experimental design, we’d say independent variables have levels, one for each variation.
For example, if we’re comparing two versions of an interface, we’d say the independent variable has two levels (A or B—hence an A/B test). The two levels could also be a current website and competitor website. If we’re testing one website with five tasks, the independent variable would be the tasks with five levels.
It can help to work through examples of how the dependent and independent variables work together.
Example 1: Sixty people who were recently researching flights online were randomly assigned to find the cheapest flight on the Delta Airlines website or the American Airlines website (30 participants on each website). The completion rate was 40% on American and 83% on Delta. All other things being equal, we can deduce that the difference in completion rates is from our manipulation of the independent variable, the website.
Dependent Variable: Completion Rate
Independent Variable: Websites, Two Levels (Delta and American)
Example 2: The same 30 participants who looked for a flight on the Delta website in Example 1 were then asked to select a seat on the Delta website. The completion rate was 50% (half were able to find the seat selector and actually select a seat). We can deduce that the task of finding a seat was harder than finding the cheapest flight on the same website.
Dependent Variable: Completion Rate
Independent Variable: Task, Two Levels (Find Cheapest Flight, Select a Seat)
The dependent variable (completion rate) of 50% itself can be meaningful because we understand percentages (100% is perfect and 0% is horrible), but the completion rate can be made more meaningful when it’s compared using the independent variable. Because we’ve manipulated the independent variable by having different websites and different tasks, we know that 50% actually isn’t that great because on the same website, the same users had an 83% completion rate for another task. But how do we know what to fix? The completion rate doesn’t tell us that. From observing people attempting the task we saw the root cause of failure is an awkward seat selector (clicking the legend opens a new tab; see Figure 1).
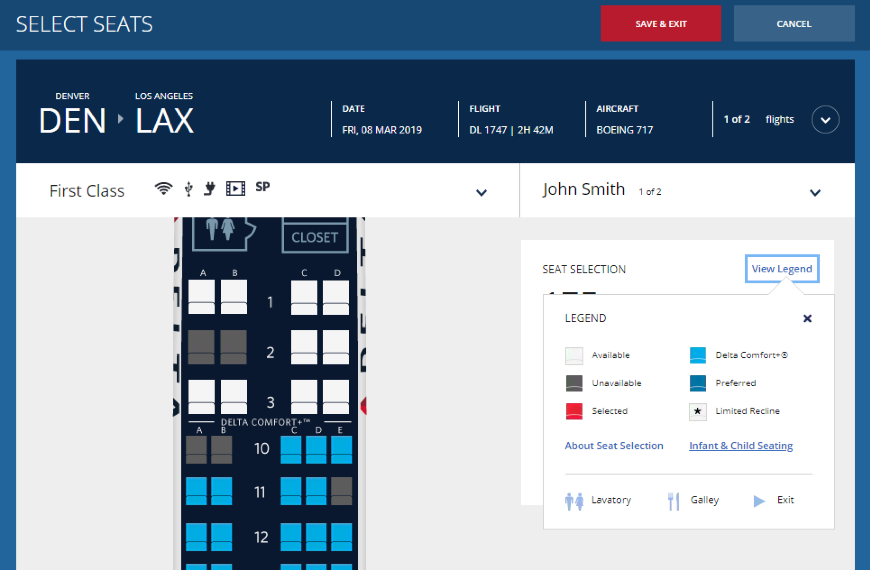
Figure 1: The seat-selector legend on the Delta website led to increased task failure.
So why not just dispense with the dependent variables altogether and watch people? There are at least two good reasons you should use dependent variables: 1) The relatively low completion rate (especially compared to the earlier task and competitors) tells us something wasn’t right, and we should look further for problems. 2) If we now attempt to fix the seat-selector legend with a new design (a new independent variable with two levels of old design and new design), we need the completion rate to tell us whether the change had an impact. If the completion rate remains at 50%, we should look for other reasons.
Example 3: Fifty recent users of each of the eHarmony and PlentyOfFish dating websites rated their trust of the dating platforms using the 8-item SUPR-Q that includes two questions on trust. The trust scores for eHarmony were about average at the 54th percentile, but those for PlentyofFish were at the 5th percentile. Because SUPR-Q scores are already being compared to 150+ other websites, we can deduce that not only do current users trust eHarmony more than PlentyofFish, but they have really poor trust in PlentyofFish.
Dependent Variable: Trust Scores
Independent Variable: Website, Two Levels (eHarmony, PlentyofFish)
The dependent variable is made doubly meaningful by using a standardized measure (the SUPR-Q trust score) and through the independent variable showing PlentyofFish has a trust problem. But how do we know what to fix? In this case, we asked participants to tell us their concerns with the website and respondents clearly identified the high number of fraudulent profiles.
Latent vs. Observed Variables
When we measure trust, as in the dating website example, or when we measure attitudes toward social media platforms, we can’t see people’s trust. There isn’t a trust X-ray machine that allows us to understand whether people trust what a company says it will (or won’t) do, or whether they trust the people on the platform. Trust, like usability or satisfaction, can’t be observed directly. You can’t see these variables; they’re hidden—or using a fancier term, they’re latent.
To measure latent variables, we have to use something we can see to make inferences about something we can’t see. To measure trust, usability, and other constructs such as satisfaction and loyalty, we typically use rating scales that are the observed variables (observed in that we can observe the responses, not the attitudes). These observed variables are more of the effects or shadows of hidden variables. We use the intercorrelations between the items and advanced statistical techniques, such as factor analysis, latent class analysis (LCA), structural equation modeling (SEM), and Rasch analysis, to be sure what we can observe is a reasonable proxy for what we can’t observe.
When I developed the SUPR-Q’s trust factor<https://digitalcommons.du.edu/etd/1166/>, we found two questions that asked about trust and credibility clustered together and differentiated well between websites that had other indicators of high trust or low trust.
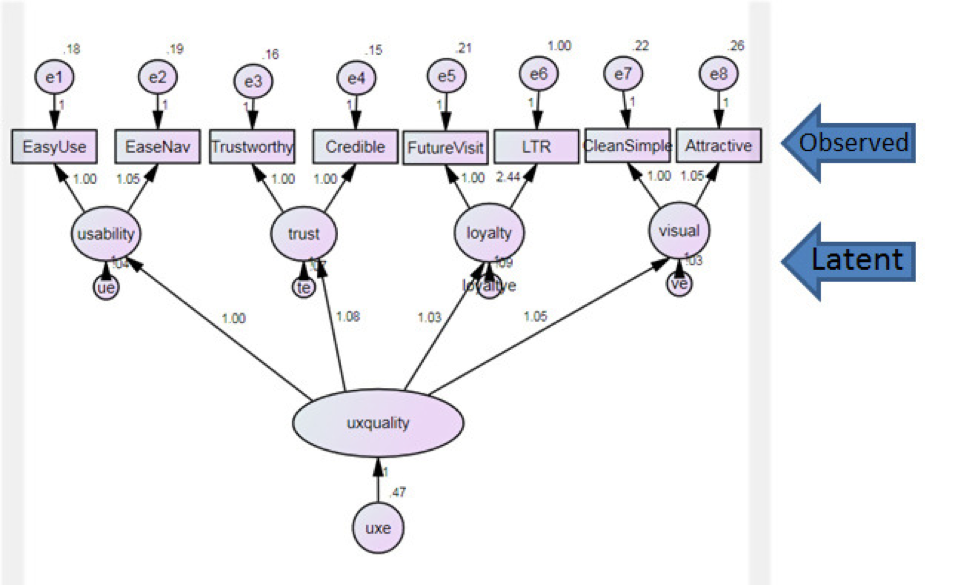
Figure 2: Diagram showing how observed questions map to latent constructs of usability, trust, loyalty, and visual appearance
Extraneous (Nuisance) Variables
In the airline website and dating website examples above, we have good evidence that the manipulation of the independent variables (the website or task) caused the changes in the completion rate or trust scores. But other things might be causing the changes, or at least interfering, with the completion rate. For example, even though people were randomly assigned to the different airline websites, it could be that some participants had more experience on American or on Delta and this prior experience affected their completion rates.
This unintended effect is often called an extraneous or nuisance variable. Extraneous variables aren’t things we’re manipulating but they may distort our dependent variables. Prior experience may also be affecting the trust scores on the dating websites. Even though we only used existing users of the websites, the experience could be higher for eHarmony than PlentyOfFish. Prior experience is a common extraneous variable in UX research.
Market and macro-economic changes can have big impacts on business metrics. For example, we recently helped a financial services company differentiate understand how changes in the stock market (a nuisance variable) affected their Net Promoter Score.
Another common extraneous variable is a sequence effect. When you administer multiple tasks to participants in a study, the prior task experience may affect (positively or negatively) performance on subsequent tasks. This may have affected the performance in the seat selector task as it was administered after finding the flight; although, if anything, it more plausibly would improve the performance as participants had more time to become familiar with the website. The sequence of tasks (first find a flight and then select a seat) while mapping what happens when people really book a flight may also cause some dependencies between the tasks. Participants who failed to find the correct flight (lowest cost and earliest arrival time) may have more trouble picking seats if the flight had fewer seats.
While you can’t get rid of extraneous variables, there are ways of handling them when you design your study (such as counterbalancing the order of tasks or websites and when drawing conclusions (such as statistically controlling for prior experience). One of the best things is to measure them, such as having a good measure of prior experience (as we did with the dating and airline studies) and changing the order in which tasks or websites are presented so you can see whether order has an effect on the dependent variables.
Summary
Dependent variables depend (change) on how the independent variables are manipulated or selected. Dependent variables can be observed directly, such as task times or completion rates, or be latent (hidden) variables that are measured indirectly, often using questionnaire items from the SUS or SUPR-Q. Don’t look to your dependent variables alone to tell you what to do or fix. Instead understand how changes to the independent variable (such as comparing designs) change the dependent variable (for better or worse).
Each time you set out to measure the user experience, think about what extraneous variables may be affecting your dependent variables (such as prior experience or sequence effects) and be sure to measure them. Here’s a mnemonic to remember: Dependent variables are what you get, independent variables are what you set, and extraneous variables are what you can’t forget (to account for).