 Numbers are universally understood across cultures, geography, and languages.
But when those numbers are applied to sentiments (for example, satisfaction, agreement, or intention), do people respond universally or does a 4 on a five-point scale elicit different reactions based on culture or geography?
Many international organizations use similar sets of measures (such as satisfaction or the Net Promoter Score) to compare countries and regions. If cultural differences do have a strong impact on scores it can be difficult to disentangle the effects of meaningful differences across regions (e.g., lower product satisfaction) from cultural differences, which is a form of measurement error.
Many published papers have identified effects from culture and geography. For example, Zax and Takahashi (1967) found cultural and gender differences between U.S. and Japanese respondents in response patterns of seven-point semantic differential ratings of characteristics of Rorschach inkblots.
They found U.S. respondents were 41% more likely to select the extreme responses compared to Japanese respondents (19.2% vs. 13.6% respectively). Conversely, Japanese respondents selected the neutral response 33% more (23.2% vs. 17.4%).
The preference for extreme responses has also been seen in other western countries. For example, Dolnicar and Grün (2007) found that Australian respondents selected extreme responses more than Asian respondents (Chinese, Indonesian, Indian, and Malaysian) across multiple studies.
Hui and Triandis (1989) reported that Hispanic-American navy recruits who rated characteristics of supervisors were more than twice as likely as non-Hispanic recruits to select an extreme response when a five-point scale was used (but not on a ten-point scale).
Re-analyzing data from European surveys on cooking, cleaning, and shaving (five-point scales), Van Herk, Poortinga, and Verhallen (2004) found that people in southern Europe (Italy, Spain, and Greece) had stronger acquiescence and extreme-response tendencies than northern European respondents (UK, Germany, and France). These findings were somewhat surprising because extreme responding is usually associated with individualistic cultures (UK, Germany, France) rather than more collectivist cultures (Italy, Spain, Greece), but Harzing (2006) replicated the results.
Niikura (1999) studied responses of white-collar workers to a questionnaire on modes of expression in the workplace, finding that U.S. respondents reported a more assertive style than Japanese, Malaysian, and Filipino respondents. This research did not, however, provide any analysis of extreme or neutral response style to the questionnaire’s items.
Yang et al. (2010) summarized the response-style effects by culture but concluded that the exact impact of culture on responses may be hard to predict, as it’s affected by variables such as the question content and respondent motivation.
Yu & Yang (2015) conducted an international comparison using Gallup’s Customer Engagement Metrics CE11 across dozens of countries for both B2B and B2C brands. The CE11’s eleven five-point items provide a measure of brand affinity and include items such as satisfaction and likelihood to recommend. In their study (see their Table 2), they showed how the CE11’s global mean score differed by country despite ostensibly measuring the same things. The range was almost a full point (high of 4.35 in the U.S. for B2C down to 3.43 in Hong Kong for Cantonese B2C). Other notable lower-scoring countries included 3.59 B2C in Japan, 3.81 in B2B France, and 3.88 in B2C Germany. They established patterns of mean differences in responses for different cultures but did not provide data about tendencies toward neutral or extreme responding.
We decided to conduct our own study to see whether we could replicate the effects found in Zak and Takahashi and Yang et al. using two commonly used scales in UX research: the eleven-point likelihood to recommend (LTR) item and the seven-point Single Ease Question (SEQ). We’ll examine both means and neutral/extreme responses.
Cultural Scale Differences Study
In September 2019, we asked 61 participants from the U.S., 51 from Japan, 53 from Germany, and 50 from France to respond to three item types (six items total):
- Likelihood to recommend their mobile carrier and last restaurant visited (Figure 1) using an eleven-point scale.
- Satisfaction with their mobile phone carrier and the last restaurant they visited (Figure 2) using a seven-point scale.
- The ease/difficulty of answering two standardized math questions using the seven-point Single Ease Question (SEQ) (Figure 3).
We selected mobile phone carriers and restaurants as products and experiences that were common in all countries tested. For the ease question, we wanted to use a task comparable across cultures that could be universally understood but also calibrated for difficulty. We selected two math items from the Wonderlic pre-hiring assessment (Figure 4).
The questions were drafted in English for the United States and translated for participants in other countries (Japanese, German, and French). We selected these countries based on the findings in Yang (2015), which showed that these countries had large differences in CE11 scores compared to U.S. respondents.
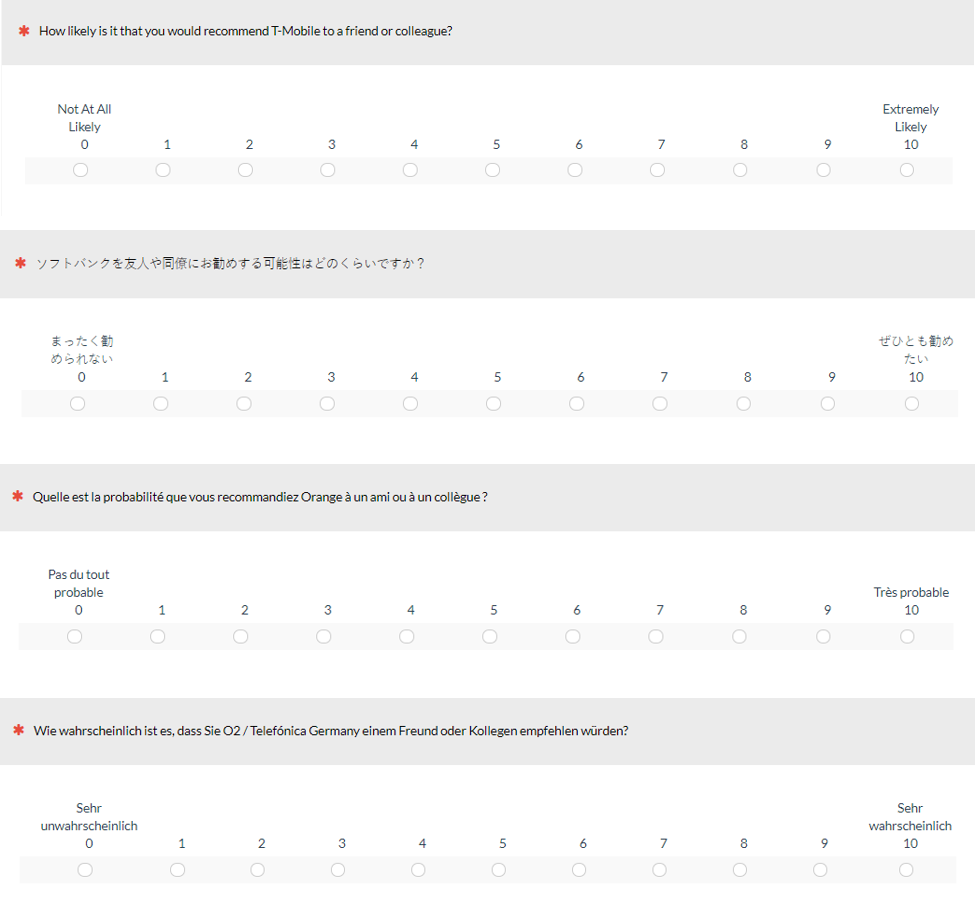
 Figure 1: Likelihood to recommend mobile carrier (top) and restaurant (bottom). Carrier and restaurant names were piped in from prior open-ended responses. (Expand each item to view translated versions.)
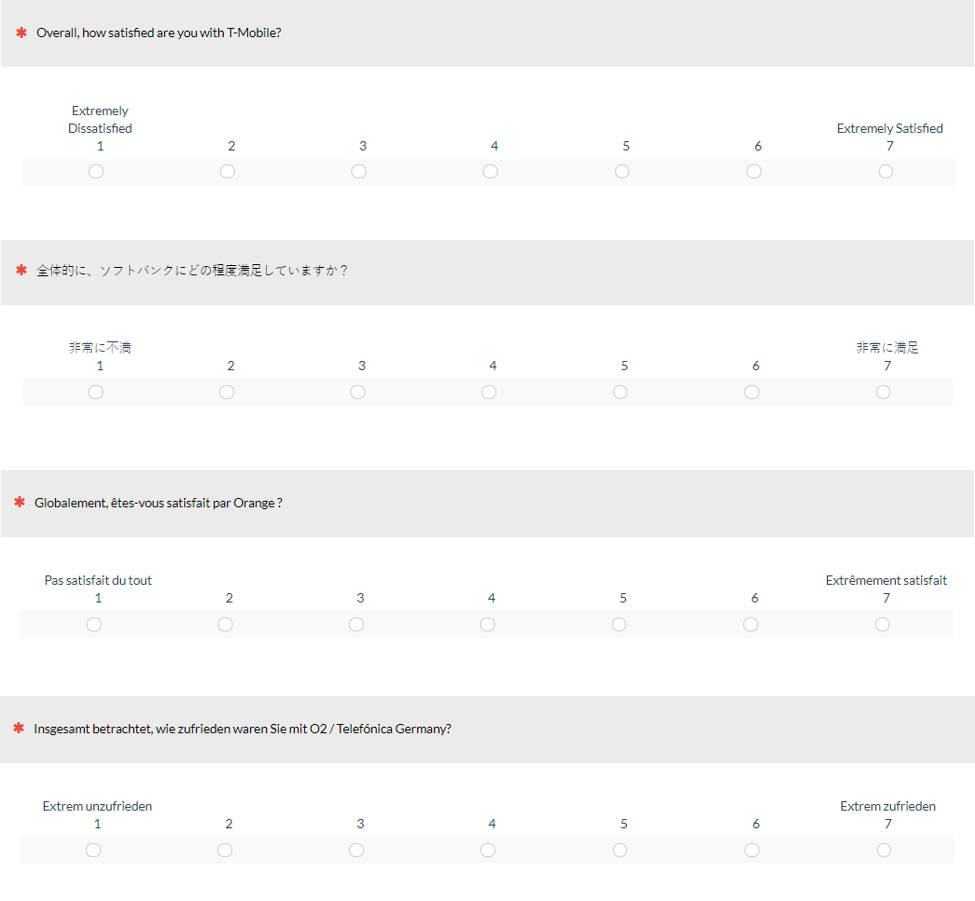
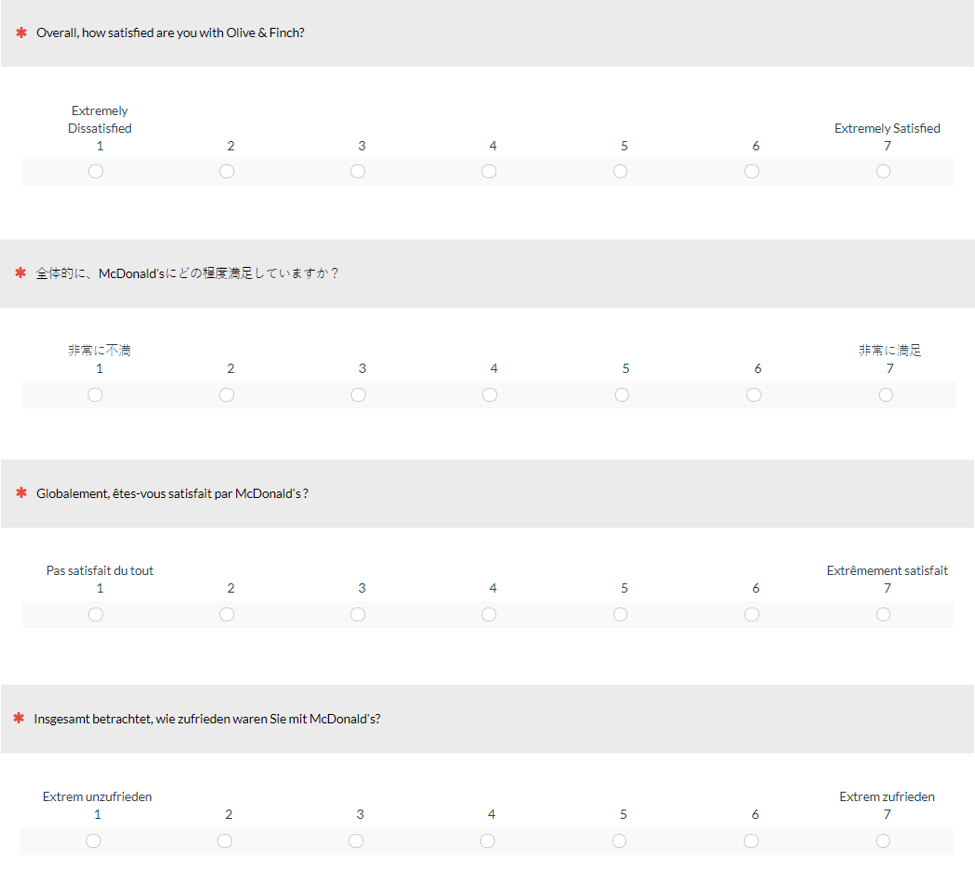 Figure 2: Satisfaction with mobile carrier (top) and restaurant (bottom). Carrier and restaurant names were piped in from prior open-ended responses. (Expand each item to view translated versions.)
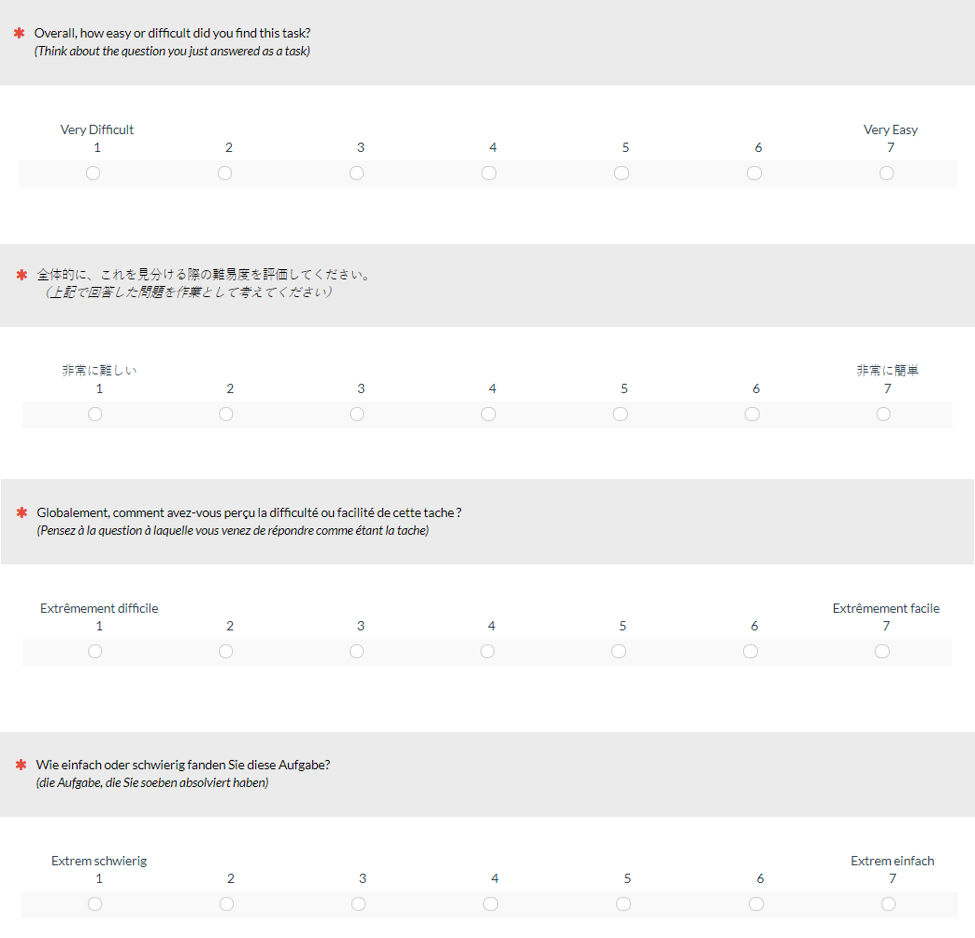 Figure 3: Single Ease Question (SEQ) asked for each of the two Wonderlic items. (Expand each item to view translated versions.)
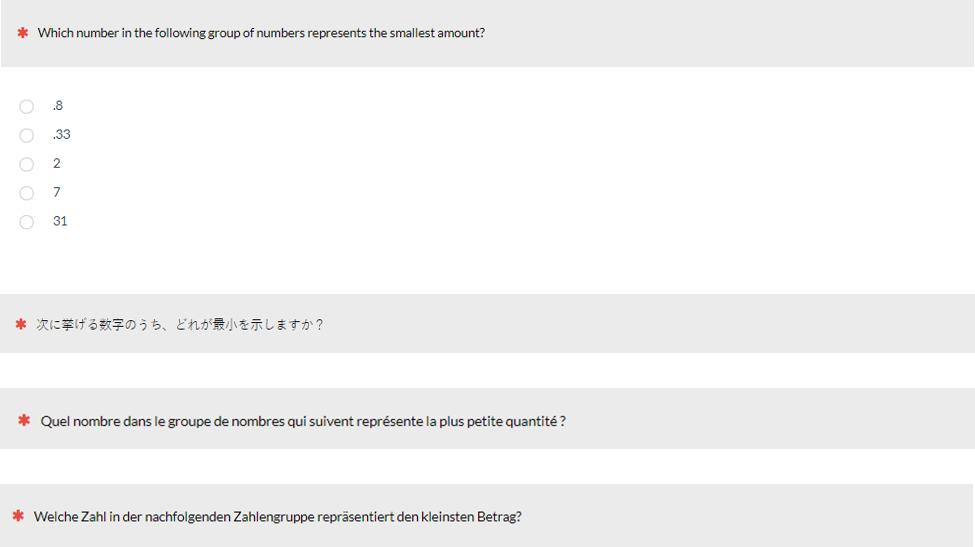
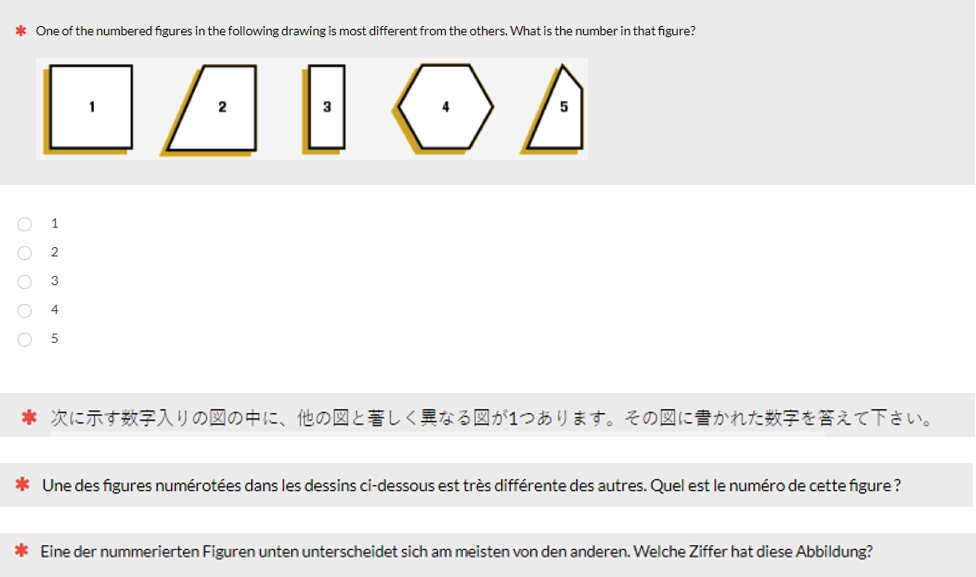 Figure 4: Two items from the Wonderlic pre-hiring assessment. Participants were asked how difficult these were to answer using the SEQ (Figure 3). The correct answers are .33 and 4 respectively.
Study Results
The respondent mix was collected using a convenience sample. There was a mix of gender and age for each country with some variation. Roughly half the sample were men (45% men; 55% women). Of the women, 41% were from Japan, 52% France, 62% Germany, and 66% U.S.
Age was less evenly distributed. Most respondents (72%) were 18–44 across all countries, ranging from 47% in Japan, 70% in France, 74% in Germany, and 93% in the U.S.
We next compared the means and response distribution (top box and neutral response) by country.
Comparing Means
The mean scores are shown in Figures 5 through 7. There were significant differences between the means (by country) on four of the six questions (p < .01). The first ease question and restaurant satisfaction weren’t statistically significant (p = .11; p = .21 respectively).
The differences between countries remained statistically significant when we included age as a predictor (meaning the differences in age didn’t explain the countries’ differences). The interaction between age and country wasn’t statistically significant (p > .05 across all six measures).
One clear pattern seen across all questions is that Japan had consistently lower mean scores across all six items evaluated. The largest differences were between Japan and the U.S./Germany samples. Relative to the U.S., Japanese participant mean scores were between 8% and 15% lower, even on rating the ease of answering two standardized math problems. To a lesser extent, respondents in France also rated lower than U.S. respondents, with means that were lower on four of the six items and were 2% lower overall.
German participants generally provided higher scores compared to French and Japanese participants and often were higher than U.S. participants. Germany had the highest ratings on four out of the six items.
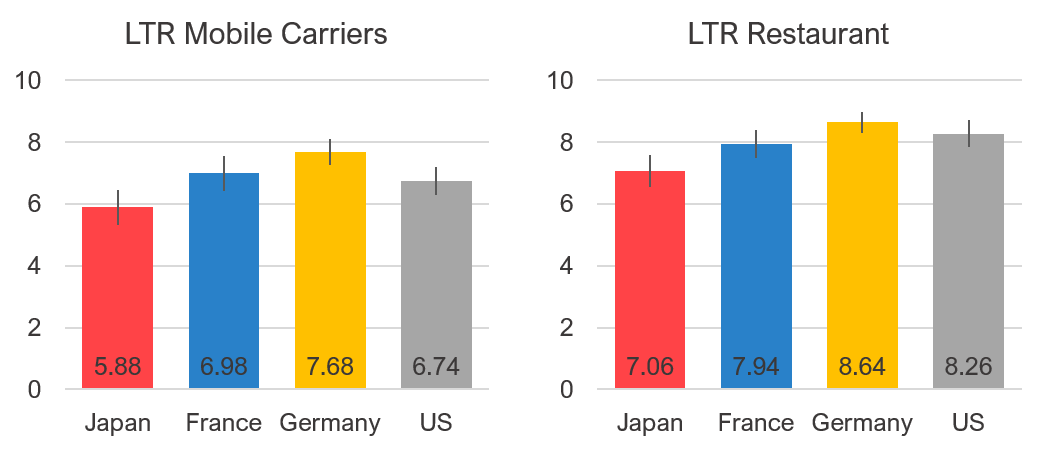
Figure 5: Likelihood-to-recommend scores for mobile carriers (left) and the most recent restaurant experience (right) by country.
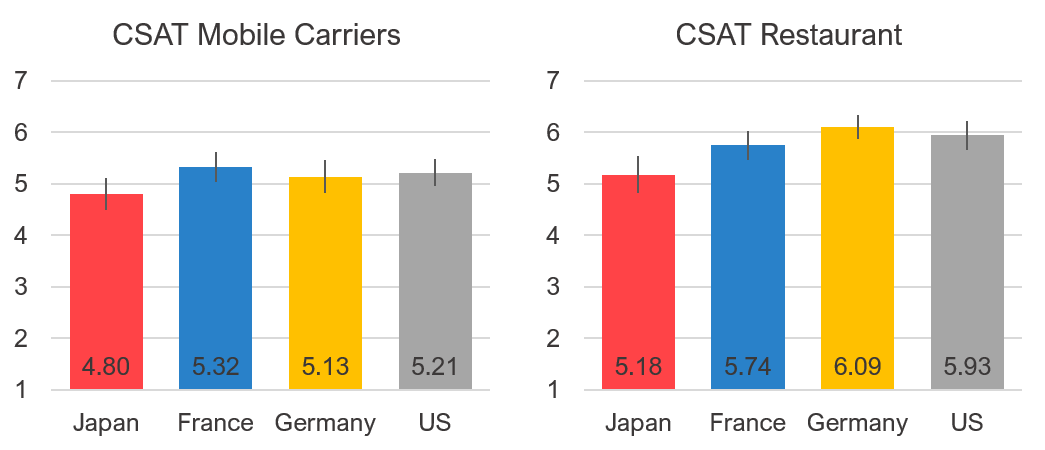
Figure 6: Mean satisfaction scores for mobile carriers (left) and the most recent restaurant experience (right) by country.
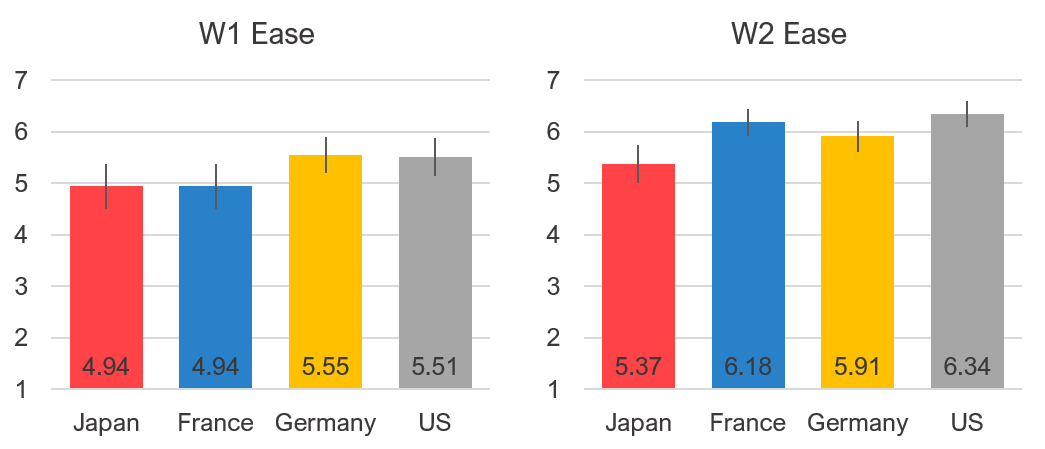
Figure 7: Mean ease ratings for the Wonderlic items.
Comparing Top-Box and Neutral Responses
We next looked at differences in response patterns (top box) and neutral response selections.
Top Box
We compared the differences in response patterns by comparing the percentage of top-box responses (seven on the SEQ and satisfaction and ten on the eleven-point LTR) across countries. (See Figure 8.)
Similar to the pattern with the means, Japan was also least likely to select the top-box scores relative to the other countries (with the exception of only one of the SEQ items). Between 8% and 33% of Japanese participants chose the highest rating on any given rating scale. In contrast, U.S. participants were on average twice as likely to select top-box scores (ranging between 1.7 and 2.5 times). Between 13% and 66% of U.S. participants selected the top-box scores compared to between 8% and 33% of Japanese respondents.
The French respondents’ top-box usage was somewhere between the Japanese low and U.S. high. On average, U.S. respondents selected the top box 33% more than French respondents did, with the French only selecting the top box slightly more when reflecting on their likelihood to recommend their mobile carrier (14% France vs. 13% U.S.).
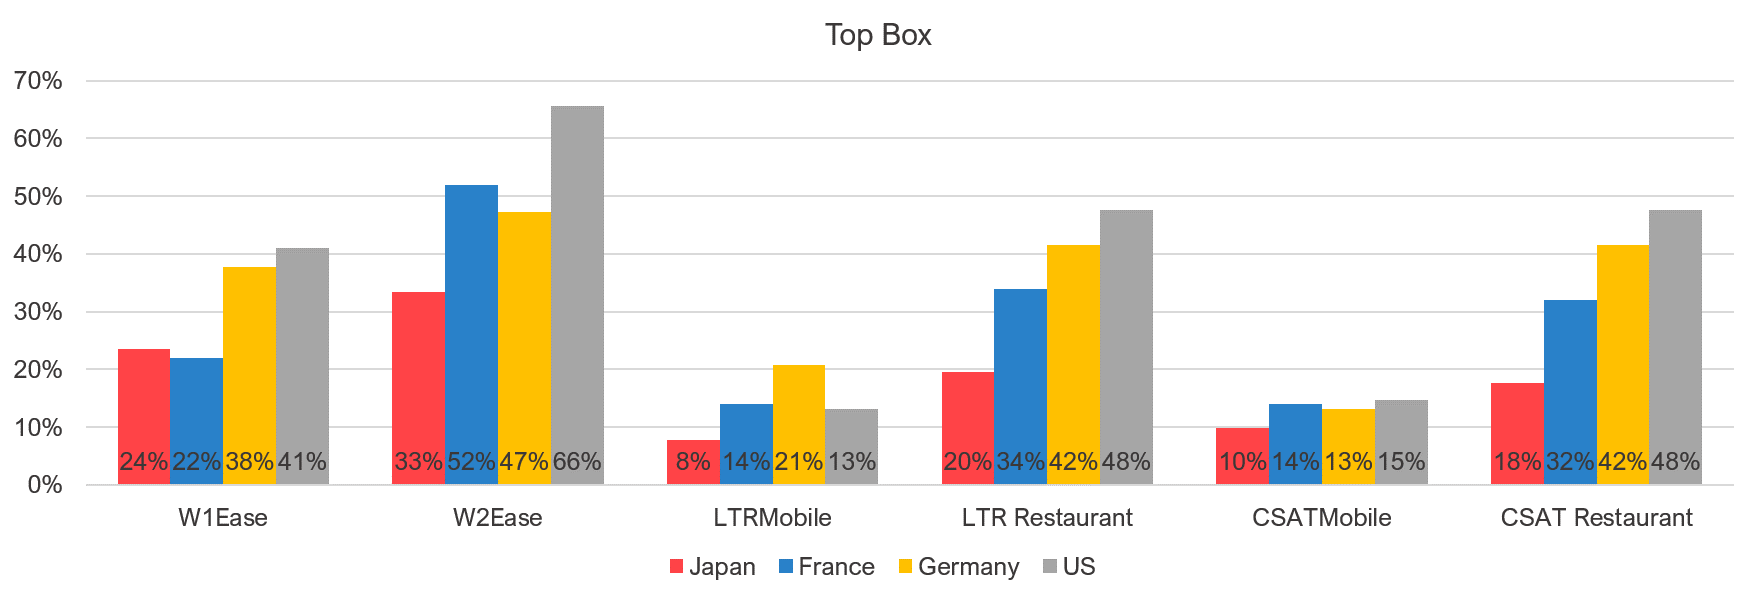
Figure 8: Top box (most favorable response) for each scale compared by country.
Neutral Responses
Figure 9 shows the distribution of neutral responses by country. Japanese participants selected the neutral response at the highest rate relative to the other countries, on average selecting neutral 20% of the time (ranging from 16% to 24%). Japanese participants were on average 2.4 times more likely to select the neutral response (between 1.1x and 4x) compared to U.S.-based respondents.
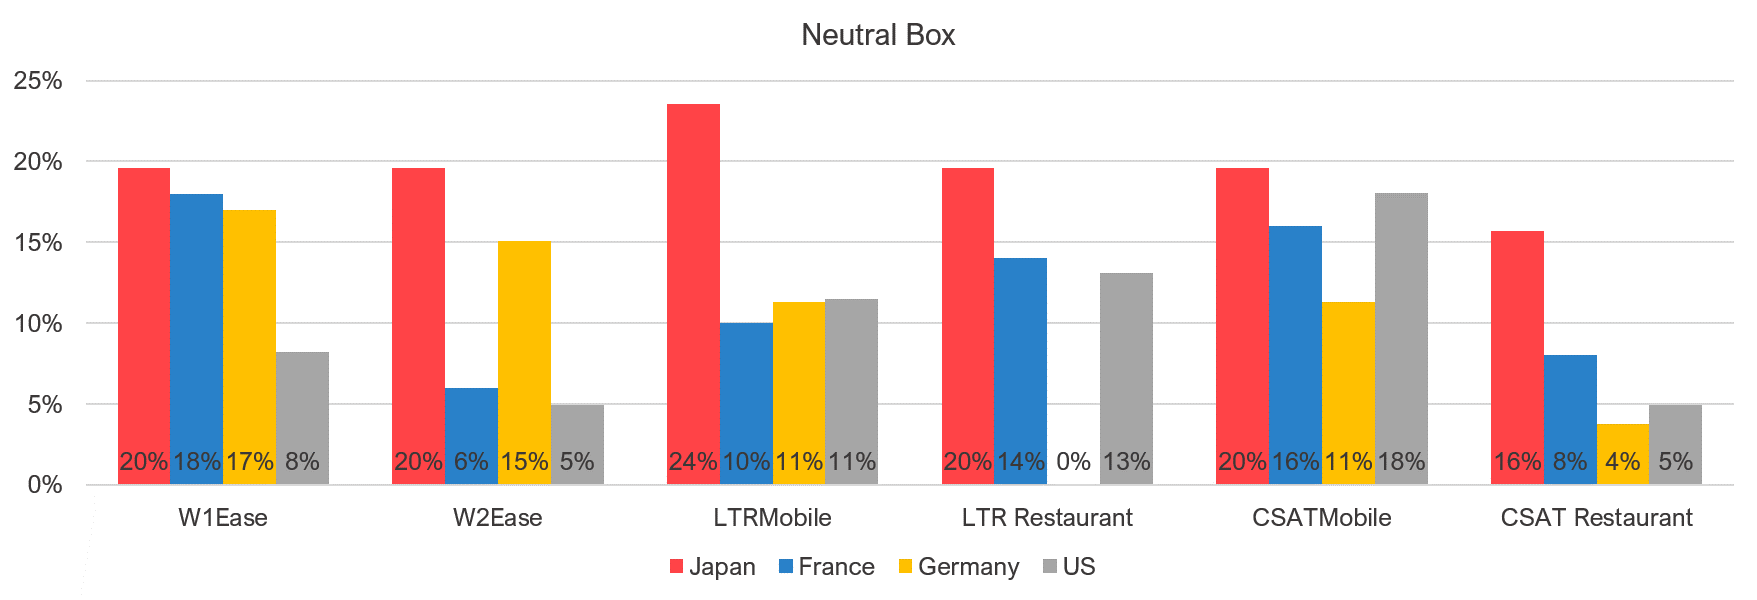
Figure 9: Neutral box response for each scale compared by country.
Germany chose the neutral option the least in the satisfaction item and interestingly didn’t choose the neutral option at all for the restaurant LTR. French respondents’ use of neutral responses didn’t differ systematically compared to the U.S. and Germany.
Summary and Discussion
Our cross-cultural study involving 215 participants from four countries found:
There are relatively large statistical differences for similar experiences. We observed statistical differences in mean scores across all six questions examined (satisfaction, likelihood to recommend, and ease). The size of the difference between U.S. respondents and Japanese respondents was most pronounced, with differences of 10%–15%. These differences are much larger than other differences observed in our earlier scale studies (e.g., from labeling every point, adding colors, or including neutral labels).
Japanese avoid the extreme positive and prefer neutral. Corroborating other research (e.g., Zax and Takahashi), our study also found that Japanese respondents’ lower mean scores were driven by fewer respondents selecting the top box (most favorable responses) and preferring the neutral option. The effect was quite large, with U.S. respondents being twice as likely as Japanese respondents to select the top box and Japanese respondents being 2.4 times more likely to select the neutral response.
Germany rated similar to the United States. Germany had mean scores that were similar to the U.S. and similar response patterns (top box and neutral response selection).
The French rated slightly lower than the United States. French respondents had generally slightly lower means (on four of the six items) and selected the top-box score at a lower rate than U.S. respondents. This corroborates the findings by Yu & Yang (2015).
The differences may be lost in translation. It is also likely that some of the differences in scores are due to translation issues. Certain concepts don’t translate well, or there’s disagreement (or errors) in translation. We’ve provided our translated versions here for others to see and replicate.
Cultural norms may affect response patterns. One possible reason for the systematic differences in response styles from Japanese respondents is different cultural norms. For example, in many Asian cultures it is more important to be modest, so responding cautiously and toward the middle of a scale (rather than the extremes) is an expression of this modesty (see this discussion in Zak and Takahashi, 1967).
Differences in education and experience could be mitigating factors. While we didn’t find significant effects from age or gender, other variables could be confounding our results. We didn’t collect data about education or other levels of experience that may explain some of the cultural differences. Future studies can more closely examine and control for education and experience as confounding effects.
Use caution when comparing responses internationally. If you are making cross-cultural comparisons (such as comparing product scores), especially between the U.S. and Japan, our study and the published research suggest that scores can be significantly affected by regional/cultural effects. While the evidence is strong that Japanese scores will be lower and could possibly be adjusted to equalize to the United States, future research is needed to see how much of a bump is needed. Our study found increasing Japanese respondent scores by roughly 10% may be a conservative approach to compensate for the 8%–15% lower scores obtained for Japanese compared to US respondents.