There’s been a lot of buzz about design thinking. What it means, how to apply its principles, and even if it’s a new concept.
While design thinking is usually applied to more scientific endeavors, scientific thinking can also benefit design. While it may be a less-trendy topic, a scientific approach to design is certainly effective.
Scientific principles lead to better decision making about designs, which ultimately leads to a better user experience. Not through intuition or one’s job title, but through data.
You don’t have to wear a lab coat or have an advanced degree to appreciate and apply scientific thinking to designs. There isn’t an official guide or set of steps in the “scientific method.” Instead, it’s about applying principles and using data. If you had to condense the method into five words, I’d say they are:
- Hypothesize
- Operationalize
- Randomize
- Analyze
- Synthesize
I’ll walk through an example of how to apply scientific thinking to the user experience of a form. It was also the topic I presented at the Boulder UX Meetup.
Hypothesize
Good decisions start with a testable hypothesis. A good hypothesis helps you identify the outcome metrics and variables, and methods you test your hypothesis with later.
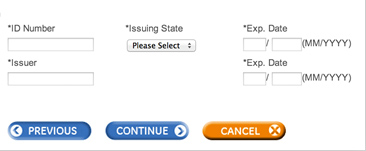
For example, we were working with a client to improve an online form for applying for credit. We suspected the button layout caused problems with users accidentally canceling the forms. For reasons out of the client’s control, the Cancel button needed to stay. Our hypothesis was:
The layout of the buttons (order and color) leads to accidental form cancelling.
A good hypothesis needs to be falsifiable. That is, if you can’t prove something wrong, it’s not science; it’s faith. It also needs to be specific. You can’t boil the ocean with your hypothesis: be specific and measurable.
Operationalize
If you can’t measure it, you can’t manage it. You need to convert (operationalize) your hypothesis into something that can be measured. That means identifying metrics, methods, and usually tasks when measuring behavior. This step is the largest because it involves the bulk of the work. To operationalize, you have to collect the right data in the right manner or the rest of the process suffers.
Metrics
You need a way to quantify outcomes of whatever interface you’re measuring (good and bad outcomes). For measuring the user experience, think in terms of actions and attitudes that are meaningful to the user.
Common UX action metrics include:
Common UX attitude metrics include
- Perceived ease or difficulty (SEQ)
- Satisfaction
- Likelihood to recommend (NPS)
A good experience optimizes both attitudes and actions.
In the case of the buttons on the form, both the effectiveness (completion rate and errors) and efficiency (time to complete) were important. The metrics also matter to the user. We started with errors as our primary outcome metric.
Methods
The metrics often help you select the right method to use. There are many ways to slice and dice methods in UX but you can think of UX methods based on measuring what people say and do.
Measuring what people actually do on the job or at home can be difficult (and creepy). Instead we often rely on simulating actual use. It allows us to control the extraneous variables and isolate our metrics.
Measuring Actual Use
Common ways of measuring actual use include:
- Google Analytics
- Log files
- Direct observation (remote or in-person)
- A/B testing
Measuring Simulated Use
Common ways to evaluate simulated usage include:
Saying Things
While we ultimately care about the actions of users, it’s often the attitudes that affect user actions. If we don’t like a brand, we’re less likely to buy its products. If we don’t think a website is usable, we won’t come back. If we think a form is too difficult to fill out, we abandon it.
To measure attitudes we use a form, survey, questionnaire, or interview participants individually to ask questions interactively.
Tasks
When we simulate usage we ask participants to attempt tasks we hope they do (or would do) naturally. When simulating usage you don’t want people only looking at an interface and telling you how much they like it. You want people to take the same actions as if you weren’t there recording their moves.
Websites and products typically have dozens to thousands of tasks people try to accomplish, such as finding a low cost blender, finding the closest store, or paying a bill. But usually a handful of top tasks account for the majority of reasons why people use and recommend a website or product. Know what these top tasks are and measure them in simulated usage.
For testing the online form we knew we’d have trouble convincing participants to actually submit it because the form contained personally identifiable information. We simulated usage by having 20 participants fill out the form in a moderated usability test. We let them know the data wouldn’t be saved or submitted.
We didn’t tell the participants that we suspected the buttons might cause problems. We didn’t ask them if they liked the colors and layout of the form. Instead, we wanted to see whether there was any measurable evidence that the buttons caused problems while participants were in the mindset of filling out the form.
Randomize
When presenting more than one task or having participants use more than one design, randomize the presentation order. Randomization minimizes unwanted effects that can distort your data, such as participants “learning” an interface or the simple effects of fatigue. In this online form example, we only had one task and one design, so we didn’t have the same opportunity to randomize.
Analyze
Of the 20 participants we observed, 9 participants (45%) moused towards the Cancel button initially, before correcting and clicking the Submit button. We can be 90% confident somewhere between 28% and 63% would also have started toward the Cancel button before self correcting.
Synthesize
We had good evidence that the buttons on the form would cause problems from observing the hesitations. While we didn’t see any cancelations, participants tend to be more careful in a simulated environment with people watching. So we suspect the problem would manifest itself in actual cancelation with enough use (the form is used hundreds of times a day).
We communicated these results to the client and recommended a change in the button layout (among other changes). We thought the new button design would prevent accidental form canceling, but we know that new designs can introduce new problems and also recommended testing alternatives.
Rinse and Repeat the Scientific Process
Quantifying the problem was only the first step. We then repeated the scientific process for identifying a better design solution.
Hypothesis: A new button layout that modifies the color, location, and treatment will reduce the number of hesitations (which lead to errors).
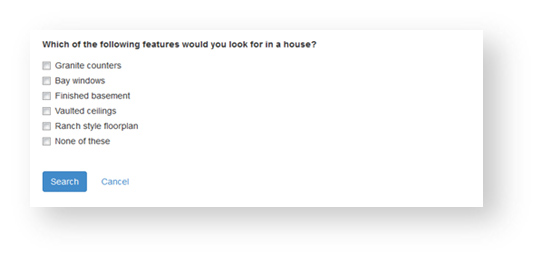
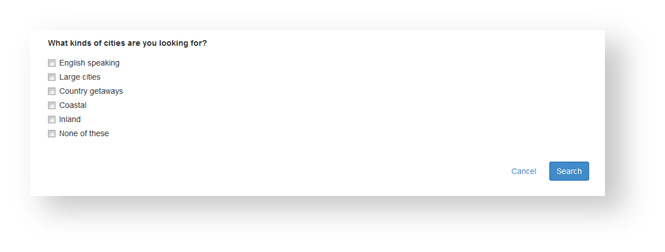
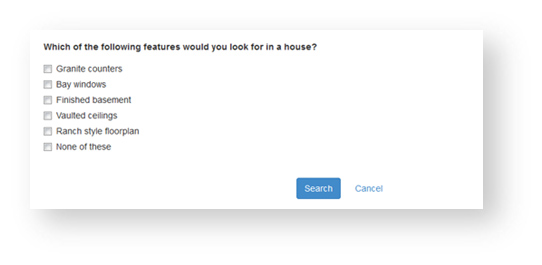
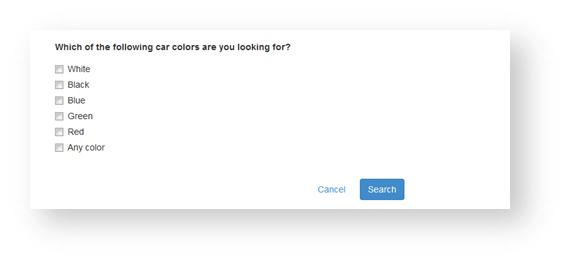
Operationalize: We created four combinations of button layouts that employ what we thought were better design elements. They varied the order of the Cancel and Submit buttons location and treatment in four combinations (versions B and D differ by how far right the buttons are on the form).
 A A |
 B B |
 C C |
 D D |
Metrics
From our moderated sessions with the original form, we saw that hesitations were a good indication of error and used hesitations again as the primary metric.
Methods
We switched to an unmoderated usability study to collect a larger sample in a shorter time using our unmoderated platform, MU-IQ. This platform records the screens of the participants and allows us to view and count the number of hesitations (in addition to the time and number of form cancellations).
Task
We created four similar tasks asking participants to fill out and submit a form. We used different tasks and form elements to help the generalizability of the findings as we knew form elements would change over time.
Randomize
The participants received all four forms in random order and the type of task was also randomly assigned to each form. Through random assignment of tasks and forms, we minimized the unwanted carryover effect where people may make more mistakes over time. We doubled the sample size to 40 participants to increase our ability to differentiate between the new designs and original form.
Analyze
We found the least number of hesitations for the form with the call to action on the right and the alignment on the right (Form B).
Synthesize
There were statistically fewer hesitations on three of the new forms compared to the original form, suggesting we had a measurable improvement in the experience.
Because we randomly assigned participants to different combinations we felt more confident about the optimal combination of button placement and treatment. We knew there might be limitations of our findings but the different tasks and form types helped the generalizability of the buttons. Additional designs can be tested with new forms to continually optimize this design element.
Summary
You don’t need to wear a lab coat to think like a scientist. You can make better design decisions scientifically by remembering these five words:
Hypothesize: Measurable, specific, and falsifiable
Operationalize: Right metrics, methods, and often tasks
Randomize: Alternate the task and design presentation order to minimize unwanted effects
Analyze: Compute and compare, and use the right statistical test (call us if you get stuck)
Synthesize: Communicate the findings and understand the limitations of your data
It takes time to craft the right hypothesis and pick the right method. We provide hands-on experience at our annual UX boot camp to help make your design decisions more scientific.


