 Who can see that photo you just posted on Facebook?
What does the @ sign do on Twitter?
Is my news feed manipulating me?
Is it appropriate to post on political topics on LinkedIn?
Social media is both heavily used and heavily discussed for its effect on society (for better or worse, including the recent media). A lot of money is made displaying ads and promoting products across social media.
To understand the typical user experience of social media, we benchmarked the desktop experience of four common platforms:
We recruited 195 participants in Feb 2018 to reflect on their most recent experience on each of the social media desktop platforms (we’ll cover the mobile experience in future studies). While the sample size isn’t very large relative compared to the millions of people that use social media, it’s large enough to detect patterns both between platforms and about social media usage in general and compared to our historical sample.
Participants in the studies answered the 8-item SUPR-Q (including the Net Promoter Score) and questions about their prior experience. In particular, we were interested in how current users understand features, advertising, and privacy.
Quality of the Social Media Website User Experience: SUPR-Q
The SUPR-Q is a standardized measure of the quality of a website’s user experience and is a good way to gauge users’ attitudes. It’s based on a rolling database of around 150 websites across dozens of industries. Scores are percentile ranks and tell you how a website experience ranks relative to the other websites. The SUPR-Q provides an overall score as well as detailed scores for subdimensions of trust, usability, appearance, and loyalty.
The scores for the four social media websites range from a bit below average to slightly above average. The social media desktop average SUPR-Q is at the 54th percentile (scoring better than 54% of the websites in the database). This average score is somewhat surprisingly low given the high traffic these sites have. Facebook has the lowest SUPR-Q score of the group with a score at the 32nd percentile. LinkedIn and Instagram lead the group with scores at the 68th percentile.
We conducted a similar analysis in 2016 and the results showed scores declined with the exception of LinkedIn, which was nominally higher. The average SUPR-Q score for this group dipped from 67% to 54%. More details are available in the downloadable report.
Usability Scores
Twitter has the highest usability score of the group (at the 82nd percentile) compared to Facebook that has the lowest at the 47th percentile. The usability factor on the SUPR-Q predicts a SUS score; in the case of Twitter, it’s a SUS equivalent score of 79 and for Facebook, 71. The generally high perceptions of usability are likely a function of the high usage each site has. With the exception of LinkedIn, most participants in the study reported using the site at least daily.
Loyalty/Net Promoter Scores
Social media is the epitome of viral growth—the more users each platform has, the more users it gets. All four platforms have millions of daily active users and have historically had high Net Promoter Scores. However, this year, these social media giants have about average Net Promoter Scores at -2% (slightly more detractors than promoters).
Compared to our 2016 data, all Net Promoter Scores are down from an average of 24%. It seems even heavy users of social media are less inclined to recommend the experience to their friends. It could be because people have soured toward social media or quite simply because all their friends already use the site, so they don’t need to recommend it.
Twitter’s Net Promoter Score has remained almost identical since data we collected back in 2012 (-11%), while Facebook has taken a significant hit with this sample of users. Facebook’s NPS declined from 38% to -9%, which might be a function of the heavy users in this sample; another Facebook NPS we recently collected with less-frequent users showed a similar NPS of 29%.
Why People Use Social Media
To understand a bit of the why behind the numbers, we asked participants why they used any social media site, which is shown in Figure 1. Keeping in touch with friends is the most common reason (selected by 63%) of respondents, followed by making new connections (45%), and communicating with specific groups (41%). Interestingly, 34% reported social media helps them keep up with news; this was especially the case on Twitter, where 63% reported using the platform to keep up with news. This is consistent with PEW research, which found that 67% of Americans get at least some news from social media.

Figure 1: Reasons participants stated for using social media.
Privacy & Control
We asked participants how much control they felt they had over who sees their posts (from no control to complete control). Instagram users tend to feel they have the most control and Twitter users the least. Across all four sites, only around half of the participants selected the top two ratings of most control—suggesting even experienced users feel at the mercy of the black-box algorithms these platforms use. This was reflected in their comments:
“They keep changing features, making it harder to figure out privacy settings, and generally making things difficult.”–Facebook User
“I would like more privacy settings.”–LinkedIn User
Advertising
While these platforms continue to find ways to monetize their user base, participants, of course, are turned off by advertising. This was especially the case on Facebook where users disproportionally feel the advertising is too intrusive:
“Too much advertising, political content, and posts on my newsfeed from people I don’t know.”—Facebook User
And to a slightly lesser extent on Twitter:
“Lots and lots of advertisements”—Twitter User
Mood and Self-Esteem Effects
There have been concerns published lately about the potential negative effects of social media on people’s self-esteem.
To quantify those effects and see how they may differ and change over time, we asked participants to reflect on how they feel after using these social media websites and asked questions including:
- Whether the site puts them in a bad or good mood
- Whether they have a negative outlook after using the site
- Whether the site makes them feel bad about themselves
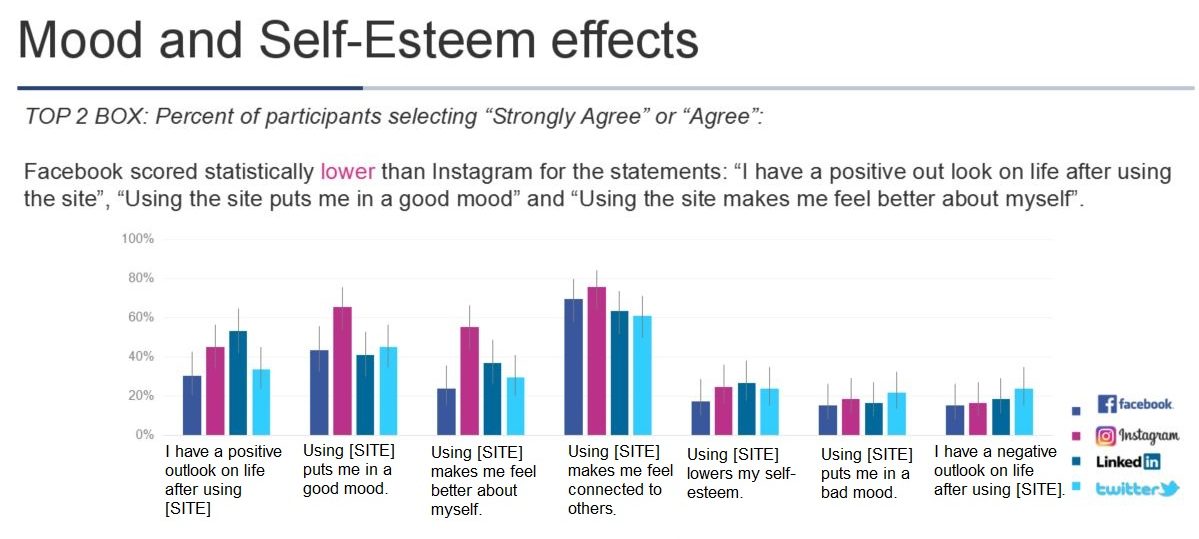
Figure 2: Mood and self-esteem top two box scores across social media sites.
We found that around 20% of participants agreed or strongly agreed with the statement that using the site put them in a bad mood. In general, Facebook scored lower on positive statements such as:
- Facebook makes me feel better about myself.
- Facebook puts me in a good mood.
- I have a positive outlook on life after using Facebook.
Political Content on Social Media
During the U.S. election, many people were overwhelmed with the amount of political content, which led many to unfollow or disconnect from the platforms. With some time that has passed since the election, we asked participants their attitudes toward political content. In general, users are not too keen on sharing or seeing political content. Only 34% agree or strongly agree that political content should be shared. However, users of Facebook and Twitter are likely to think political content is more appropriate than on Instagram and LinkedIn (43% vs. 26%). Still, more respondents aren’t crazy about it:
“It just incites the mob mentality and agitates others.”—Facebook User
“I think some things don’t need politics and social media is one of them. There are too many opposing opinions and too many chances for disagreements and negativity.”—Facebook User
“I’m not going to display information like that because a potential employer could judge me on it. And political opinions are asinine to begin.”—LinkedIn User
“LinkedIn is a networking site, not a place to discuss policies or candidates.”—LinkedIn User
“I don’t think Instagram is the right platform to express political views; there are better platforms elsewhere. Instagram, to me, is supposed to be a fun place to connect with others.—Instagram User
“It helps get the idea spread across a wide area.”—Twitter User
“It’s the one thing I hate about Twitter. The political stuff.”—Twitter User
Distrust Remains
Part of the reason for less enthusiasm over political content is the impression that it’s manipulated or “fake news.”
While the largest percentage of participants (43%) agree that Facebook and Twitter are more appropriate to share political content on, interestingly, users are least likely to trust the political content posted on these sites. On Facebook and Twitter, only 14% reported fully trusting the political content. So while users report using these platforms for news, including political content, few seem to strongly trust the news they get.
While it may seem like this strong distrust is a recent phenomenon, we collected social media attitudes in 2012. That data from six years ago shows about the same very low levels of trust for Facebook. Both Facebook and Twitter scored at around the 10th percentile in 2012 and haven’t moved statistically since—Facebook 7% and Twitter 11% in 2018.
Understanding How to Use Social Media
Despite the generally limited functionality of Twitter, people often express their confusion of how to use it. But confusion over what symbols like the at (@) symbol and hashtag (#) do on each of these platforms confuses even experienced users. And that’s not too surprising because it is even hard for us to determine their functionality!
For example, the @ symbol is now functional across all sites, which allows users to tag or mention another user. However, only about half of users on each platform report knowing this and only 40% on LinkedIn did.
On Twitter, users in the study know the @ symbol has functionality, but its exact function seems inscrutable. Only 2% of Twitter participants know that users must follow both the sender and receiver of a message to view it.
The hashtag seems better understood as more than 80% of users know that it allows you to categorize social media content on a certain topic on Twitter and Instagram. Fewer people (around 60%) understand that it serves the same function on Facebook and LinkedIn.
Summary
An analysis of the user experience of social media websites found:
- Social media is ubiquitous and influential. With multiple platforms, people use social media for a variety of tasks to connect with others as well as a primary source for news.
- Political posts are tolerated (except on LinkedIn). Most respondents tolerate other people’s occasional political posts on Facebook and Twitter, even though they are less inclined to want to contribute. The exception is LinkedIn, where participants agree politics isn’t appropriate on this job-focused site.
- Distrust remains. High usage doesn’t mean high trust. Users generally still distrust social media platforms, especially Facebook and Twitter, and have concerns over privacy and who sees what.
- Social media probably makes many feel bad. A substantial number of participants report feeling worse about themselves after using social media.
- Current users still struggle to understand core functionality. While the @ and # symbols have effects on all four sites, users don’t always know this and even those who do, don’t fully understand what they do and how they work.

")
")