 Measurement is at the heart of scientific knowledge.
It’s also key to understanding and systematically improving the user experience.
But numbers alone won’t solve all your problems. You need to understand what’s driving your metrics.
While taking the pulse or blood pressure of a patient will provide metrics that can indicate good or poor health, physicians need more to understand what’s affecting those numbers. The same concept applies to UX research.
We advocate and write extensively about UX metrics such as SUS, NPS, task times, completion rates, and SUPR-Q. Using these measures is the first step, but understanding what’s affecting them—“the why” behind the numbers—is the essential next step to diagnose and fix problems in the experience. Here are five approaches we use to understand the “why.”
1. Verbatim Analysis
In surveys, website intercepts, and unmoderated usability tests, there are (and should be) open-ended comments for participants. They’re a good place to start understanding the why. If a respondent in a survey provides a low likelihood to recommend score (a detractor), a question immediately following this closed-ended question can examine his or her reasons.
You can evaluate responses systematically by sorting and coding them. However, even a quick reading of a subset of what participants are saying will give you some idea about what’s driving high or low scores. For example, participants in our business software benchmarking study reflected on their likelihood to recommend the products they used. We asked participants to briefly explain their ratings, which can be particularly helpful for low scoring responses. One respondent gave the Learning Management System (LMS) software Canvas a score of 5 on an 11-point scale (a detractor) and said
“Although Canvas allows you to connect with students on a more personal level than email… it still has a large amount of issues present. The layout of Canvas is horrid, and users should have an option to collapse the menu found on the left-hand side of the screen. Although it’s an adequate LMS program, it isn’t better than Blackboard.”
There’s a lot packed into that one comment. It doesn’t mean you immediately start redoing the software but it does mean it’s likely worthy of further investigation.
2. Log Files & Click Streams
For measuring the website user experience, looking at where users click, how long they spend on a page, and how many pages they visit can give you some idea about why tasks might be taking too long or reasons for low task completion rates.
Log files also allow you to quickly see whether participants are getting diverted to the wrong page, either unintentionally (through following a link) or intentionally (browsing Facebook while attempting a task.) (The latter case would be a good reason to exclude the participant’s responses.)
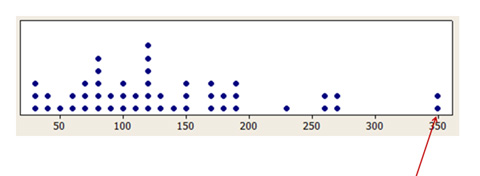
For an unmoderated benchmark of the budget.com website a few years ago, we had a hard time understanding why one user’s task time was so long (a key measure of efficiency). An examination of the log files and clicks revealed the user was actually intercepted with a separate website survey.

Figure 1: Distribution of task times from a Budget.com benchmark study. An analysis of log files revealed one of the long task times came from a participant being intercepted by another survey.
3. Heat & Click Maps
If you’re conducting an unmoderated usability study, knowing where people click can tell you a lot about reasons for task failures and longer task times. In general, the first click is highly indicative of task success.
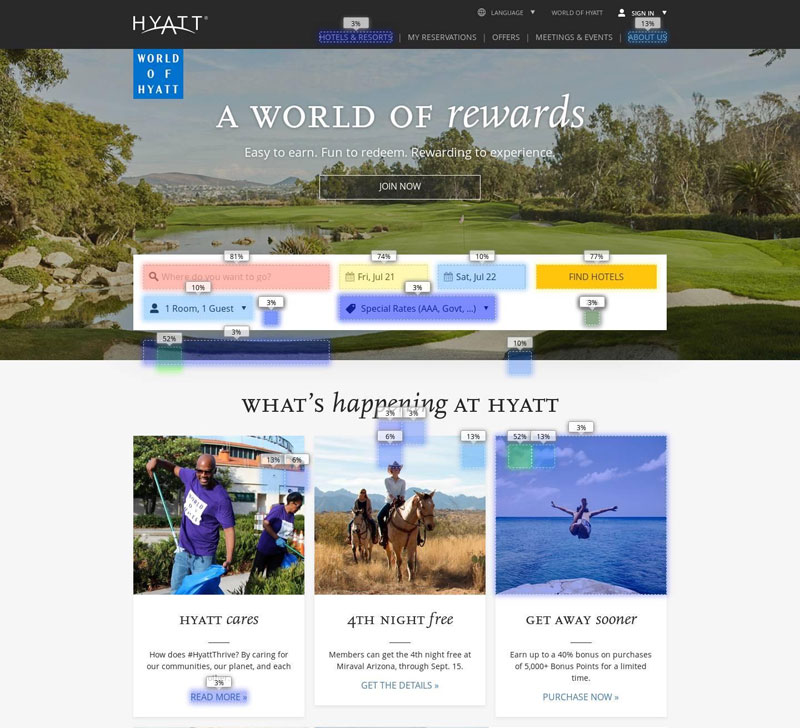
You can check first clicks to some extent using Google Analytics or Clicktale, which visualizes the log files for you. Click maps can also show you where users click. The click map from MUIQ (shown in Figure 2) provided us a better idea about why some participants had trouble with the task of reserving a hotel. Heat maps and click maps are particularly helpful when testing prototypes that have a finite set of pages, as these early interactions on a prototype are predictive of behavior on a fully functioning product.

Figure 2: Click map for participants attempting to make a reservation on Hyatt.com
4. Videos & Session Recordings
While a picture can speak a thousand words (click maps and heat maps), a recording of what participants are doing can maybe tell at least 10,000 words. For unmoderated studies, not being with a participant makes it difficult to assess task completion and understand why other metrics might be higher or lower.
One of the best features to help understand the why behind the numbers is to have a video of what participants were doing while attempting tasks. Session recording software like our MUIQ research platform provides this capability. While it’s unreasonable to review hundreds or thousands of videos (something you’ll get with a 5-task study that has 150 participants), strategically selecting a few videos to understand the root cause is sufficient and revealing.
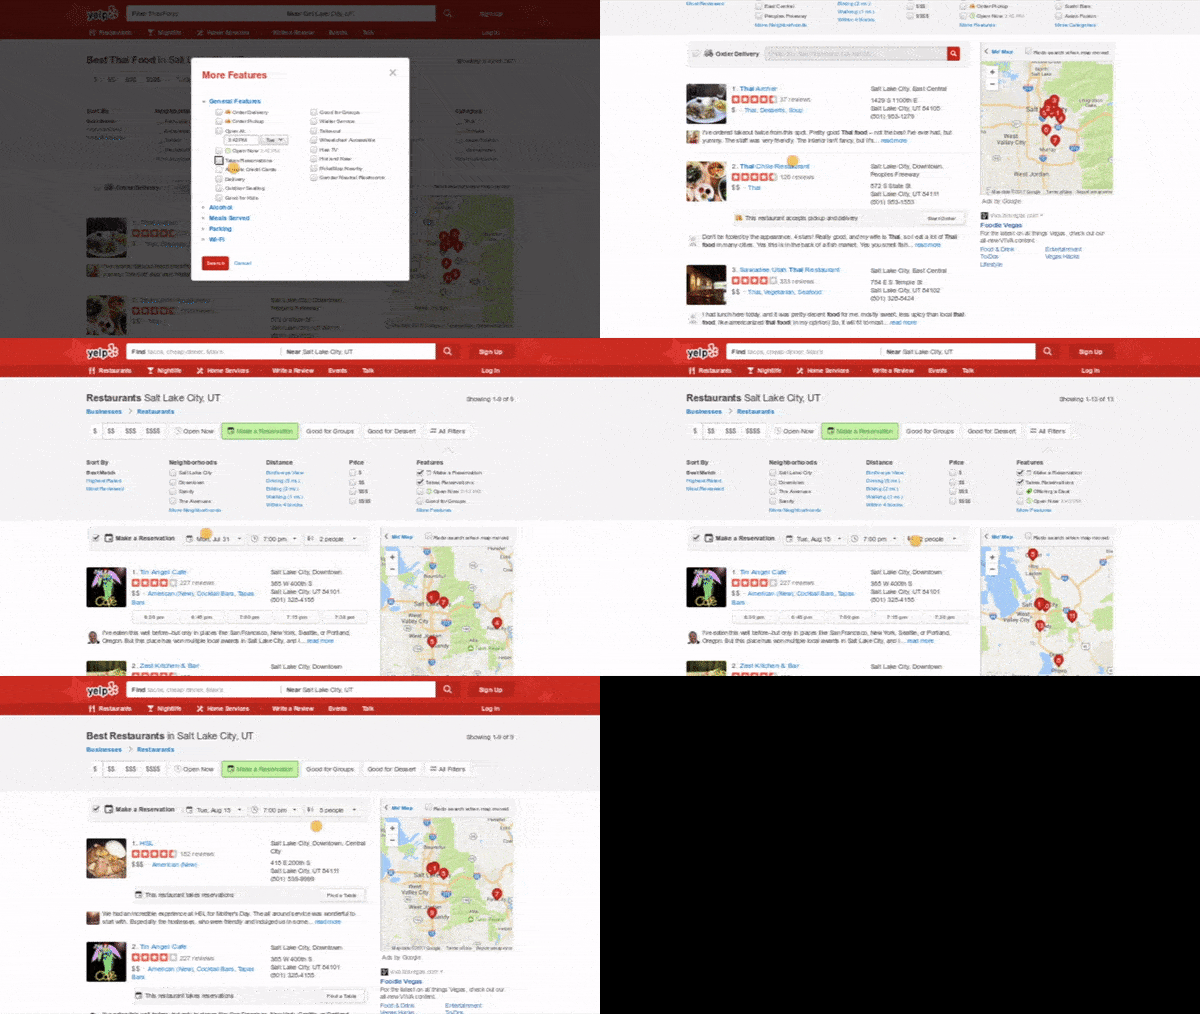
For example, the video below comes from MUIQ taken during a benchmarking study we ran on the Yelp website as part of our SUPR-Q data collection. While Yelp has been a popular website for restaurant reviews, they’ve been expanding their reservation system to compete with websites like OpenTable.
We asked participants in an unmoderated study to find a Thai restaurant in Salt Lake City. Only 49% completed the task successfully. To understand why half couldn’t, we examined some of the session videos and found a few users struggling with the filters. The example below is 30 seconds from a 2.5 minute session video.

Note: Video compressed from original resolution & size
Summary of clip:
- The participant searches for “Thai Food” restaurants in Salt Lake City and selects the “Takes Reservations” filter. The problem is this option shows all restaurants that accept reservations in general and not just ones that accept reservations via the Yelp reservations website.
- The participant then (correctly) selects the “Make a Reservation” option but doesn’t realize selecting this option erases his original search criteria. Now all restaurants in Salt Lake City that accept Yelp reservations (not just Thai restaurants) are shown.
- The participant then searches for “Thai Food” again, which in turn removes the “Make a Reservation” option—back to square one.
- Finally, the participant selects the “Make a Reservation” option again, which again erases his original “Thai Food” search and the participant ends the task (likely frustrated by the experience as indicated by his low post-task SEQ rating).
The end result using this method is we now have both a measure of the experience (a low completion rate) and what to fix to improve it (the filtering interactions).
5. Moderated Follow-Ups
Probably one of the most effective ways to understand why people behave or act the way they do on a website and software is to ask them. While what people do and what they say isn’t always the same, it often is and can usually answer a lot of questions about why the metrics are the way they are.
We’ve had a lot of success getting at the why by simply asking participants who participated in surveys and unmoderated studies whether they’re willing to participate in a follow-up study. In the moderated follow-ups (usually conducted remotely), we ask participants to revisit the study and have them get back in the mindset they were in while they were answering questions or attempting tasks.
This process allows participants to more easily explain and articulate their thoughts by leveraging the power of thinking aloud. The obvious disadvantage with this approach is that it takes time to run the sessions, adds time to the study because you’re adding a step, and consequently adds cost. But time permitting, we find it’s a small price to pay for the rich understanding of the why behind the numbers.


