Five Critical Quantitative UX Concepts

If you’re in User Experience, chances are you probably didn’t get into the field because of your love of math. As UX continues to mature it’s becoming harder to avoid using statistics to quantify design improvements. One of my goals is to help make challenging concepts more approachable and accessible. Last week Jim Lewis and

Read More »

What Statistical Test do I Use?

What do you think the most common question in statistics is? Several times a year I teach a statistics course for UX professionals and get asked this question a lot. We’re offering the class this fall at the LeanUX Denver conference and a portion of it is available for download. Some attendees have had statistics

Read More »

6 Proportions to Compare when Improving the User Experience

One of the simplest ways to measure any event is a binary metric coded as a 1 or 0. Such a metric represents the presence or absence of just about anything of interest: Yes/ No,  Pass/ Fail, Purchase/No Purchase, On/Off. Fundamentally the binary system is at the heart of computing as we know it. It

Read More »

Nine Misconceptions About Statistics and Usability

There are many reasons why usability professionals don’t use statistics and I’ve heard most of them. Many of the reasons are based on misconceptions about what you can and can’t do with statistics and the advantage they provide in reducing uncertainly and clarifying our recommendations. Here are nine of the more common misconceptions. Misconception 1:

Read More »

5 Examples of Quantifying Qualitative Data

There is an erroneous perception in the UX community that if your method is qualitative, then numbers somehow cannot or should not be used. These perceptions come from an informal practice that stems back to the beginning of the usability profession and continues through training programs and some UX experts. Unfortunately, this perception is misguided

Read More »

Should You Care If Your Rating Scale Data Is Interval Or Ordinal?

It’s fine to compute means and statistically analyze ordinal data from rating scales. But just because one rating is twice as high as another does not mean users are really twice as satisfied. When we use rating scales in surveys, we’re translating intangible fuzzy attitudes about a topic into specific quantities. Overall, how satisfied are

Read More »

Were most Software Millionaires born around 1955?

If you’ve read a book by Malcolm Gladwell then you know how he has a knack for making the mundane meaningful through drama-filled story telling. In his book, Outliers, he makes a convincing case that birthday matters for success in hockey. Being born as close to the year-end cut-off provides a developmental advantage. According to

Read More »

How Should You Display Links To PDF Files?

I’m always gathering and looking at data. One consequence of this is having to reconcile conflicting data-points—say data from users who express different perspectives on an issue. For example, one of my articles was recently tweeted with the note:  “any website with the name usability in it should let you know you’re clicking on a

Read More »

Margins of Error in Usability Tests

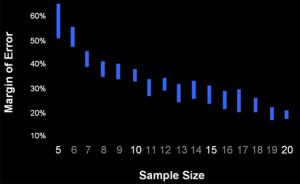
How many users will complete the task and how long will it take them? If you need to benchmark an interface, then a summative usability test is one way to answer these questions. Summative tests are the gold-standard for usability measurement. But just how precise are the metrics? Just as a presidential poll uses a

Read More »
0
    0
    Your Cart
    Your cart is emptyReturn to Shop
    Scroll to Top