 Over half of U.S. households have a pet. And for many people, they are more than pets; they are family.
But pets are also a big business. It’s estimated that pet related products and services account for $70BB annually in the U.S. alone. And a lot of that spending happens online.
To better understand the pet website user experience, we conducted two studies. The first was a retrospective benchmark on four popular pet websites:
The second was a remote think-aloud study with twenty participants on PetSmart and PetMeds using our MUIQ platform.
Study and Participant Details
In July of 2019, we asked 213 participants who had visited or purchased on one of the four pet supply websites in the past year to reflect on their most recent experience. We then asked 20 additional participants who reported recently purchasing on one of the four pet websites to attempt two tasks (scheduling a grooming appointment and finding dental chews for a 60 lb. dog) on both PetSmart and PetMeds using our MUIQ platform in October and November 2019.
Participants in the study answered questions about their prior experience, and desktop users answered the eight-item SUPR-Q and the likelihood-to-recommend item. We were interested in visitors’ attitudes toward the site, problems they had with the site, and reasons they used the website.
Full details are available in the downloadable report. Here are the key takeaways.
Measuring the Pet Supply Website UX: SUPR-Q
The SUPR-Q is a standardized measure of the quality of a website’s user experience and is a good way to gauge users’ attitudes. It’s based on a rolling database of around 150 websites across dozens of industries.
Scores are percentile ranks and tell you how a website experience ranks relative to the other websites. The SUPR-Q provides an overall score as well as detailed scores for subdimensions of trust, usability, appearance, and loyalty. Its ease item can also predict an accurate SUS equivalent score.
The scores for the four pet supply websites (desktop versions) in the perception study are above average at the 77th percentile (scoring better than 77% of the websites in the database, but about what we’d expect for high-traffic retail websites). SUPR-Q scores for this group ranged from the 57th percentile (PetMeds) to the 96th percentile (chewy.com).
Value Seeking
We found that participants visited the websites to find a good deal (value driven). Comparing prices and looking for deals were found to be top tasks on the pet supply websites. Across the sites, 72% of participants in the study agreed that the pricing is competitive while 78% thought they could find good deals and discounts. Only 64% of Petco users thought the website offered competitive pricing, and 63% of PetSmart users thought they could easily find a good deal on the site.
Brand Loyalty and Appearance
The average Net Promoter Score for these websites was 20%. Participants were most likely to recommend Chewy.com (40%) and least likely to recommend PetSmart (0%). While PetMeds had the worst SUPR-Q score, it was actually the second most recommendable website with an NPS of 24%.
The two lowest scorers in the study, PetMeds and Petsmart, both fell short in the Appearance category. PetMeds was in the 26th percentile for Appearance while PetSmart scored just above average (53%). Participants who used the PetMeds website said it looked dated (see Figure 1).
“It looks dated and overall unattractive looking.” — PetMeds user
“I think it’s not the prettiest or the most modern.” — PetMeds user
“The site looks a bit out of date.” — PetMeds user
While appearance may seem like a cosmetic detail, poor appearance scores can play a role in reducing trust, brand appearance, and even the usability score. All of these may impact likelihood to repurchase and recommend.
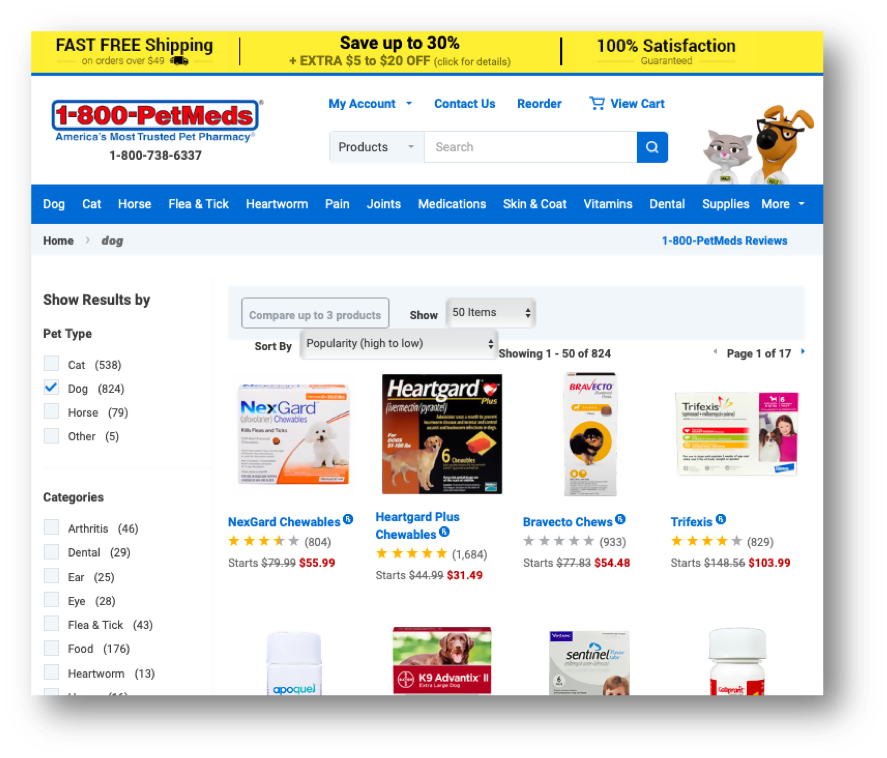
Figure 1: The product pages on the PetMeds website was called outdated and less attractive compared to the other websites.
In contrast, Chewy.com had the highest Appearance score in the group, falling in the 96th percentile. Participants said the chewy.com design was bright, clean, and easy to navigate.
“It is bright and appealing. It makes me want to browse the website to see product categories and special features such as videos…” — Chewy.com user
“The site is clean, images are clear, and the pages do not feel cluttered.” — Chewy.com user
“The thumbnail pictures are large, bright, clear, and easy to read / see the packaging pictured. Makes it easy to see what things are at a glance.” — Chewy.com user
“The website is cleanly constructed and easy to navigate.” — Chewy.com user
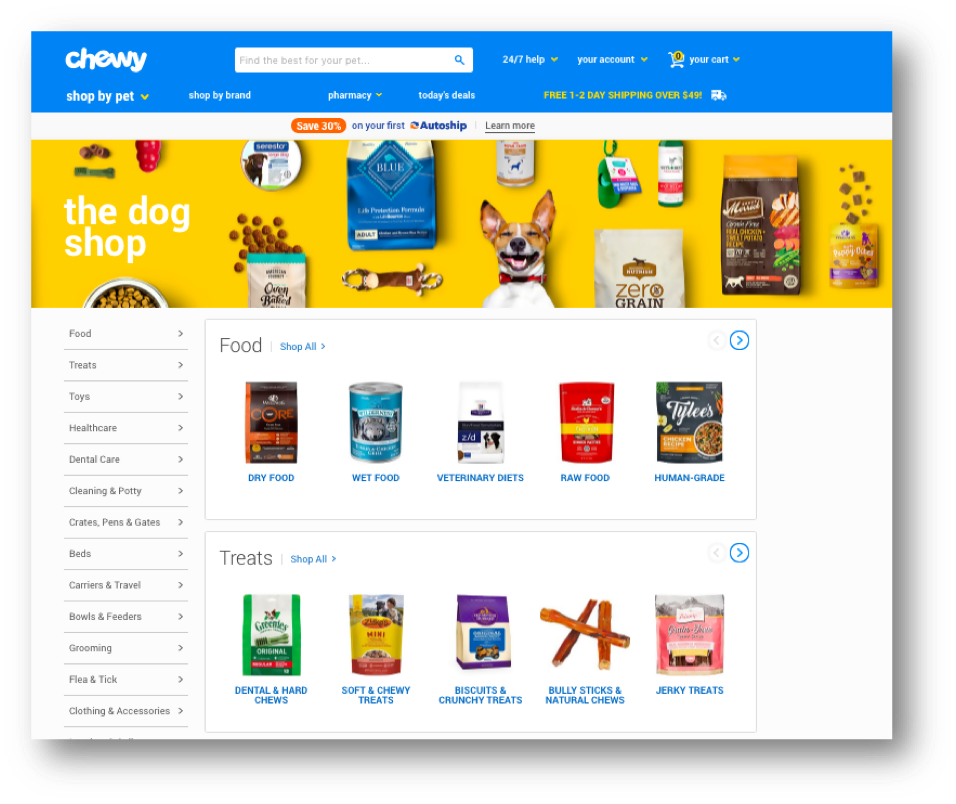
Figure 2: Chewy.com had the highest Appearance score in the group. Participants liked the overall design of the website, especially the large photos, bright colors, and easy navigation.
Scheduling Services Online Can Be a Challenge
Scheduling in-store services such as grooming and training is a feature on the Petco and PetSmart websites. However, participants didn’t think it was easy to go through the process of booking an appointment. On Petco, only 42% of participants agreed with the statement “It’s easy to schedule services for my pet online,” and only 37% of PetSmart users thought so.
“I’ve had a bit of difficulty booking a grooming appointment.” — PetSmart user
“Sometimes available grooming spots are not shown on the site and you have to call.” — PetSmart user
To better understand the scheduling challenge, we focused on online grooming scheduling on PetSmart in our follow-up moderated study (a benefit of a mixed-methods services). We found the online booking form for the grooming salon proved to be problematic for some participants as shown in the example video below.
Video 1: Troublesome Forms. The participant fills out the form in the wrong order, first selecting age and then selecting dog/breed. When the participant selects “dog” the age is automatically deselected. The participant then tries to check the prices and book without selecting a store. Finally, the participant wrongly selects a specialty haircut instead of a basic haircut because it is at the top of the grooming salon menu. Note: Explicit permission was granted to use this video online.
Key Drivers of UX: Premium Products and Filtering
We conducted a key driver analysis to understand what aspects have the biggest impact on the perception of the quality of the website user experience.
The most impactful key driver for the pet supply website user experience was brand attitude. This element explained 24% of the variance in SUPR-Q scores. Chewy.com had the most favorable brand attitude as well as the highest SUPR-Q scores.
The second most impactful key driver was a large selection of products on the website (explaining 12% of the variance in SUPR-Q scores). Overall, participants thought the websites had a good selection of pet products, with an average agreement rate of 92%. However, some participants on PetMeds and Chewy.com did mention a poor selection of items on the website.
“Lack of items for animals besides cats and dogs.” — PetMeds user
“They haven’t had certain medications I’ve needed.” — PetMeds user
“A lot of the things I needed just weren’t there.” — Chewy.com user
“They don’t sell my food and cat litter brands.” — Chewy.com user
To further dig into the issue with poor product selection we had participants look for a product (dental chews for a 60 lb. dog) on the PetMeds website in the remote think-aloud study.
We observed one participant having trouble because of confusing product pictures and descriptions. The participant noted that they couldn’t tell if “large” treats meant that it was intended for large dogs or if this was the package size. Ultimately the participant did not select this item because he was looking for a product for a 60-pound golden retriever and the product picture said “petite.”
Video 2: Unclear Product Descriptions. The participant in this video from MUIQ got confused whether “large” treats meant that it was intended for large dogs or if this was the package size.
The ability to easily narrow down search results to find products was also a key driver of the pet website user experience, explaining 11% of the variance in SUPR-Q scores. Overall, 87% of participants agreed that “I can easily narrow search results down to what I’m interested in.” Fewer PetSmart users agreed, and some of the verbatim comments support this sentiment:
“The filters don’t always pull up the right things. Like if I went to the wet cat food category, sometimes I can’t find all the brands that would be considered wet cat food. Even if I use the brand filter. But if I search for the name, I can find it.” — PetSmart user
“When you use the filters, they don’t work quite right. For example, if you filter by color, I’ve noticed that the items with that color aren’t all there. It’s like the tags aren’t quite right.” — PetSmart user
Improving the filtering process on PetSmart would improve the quality of experience for users who are interested in finding a specific product (and likely improve the sites’ SUPR-Q scores).

Figure 3: Key drivers of the pet supplies retail website user experience (R-Sq = 63%).
Other key drivers for the pet supplies user experience included “The website has premium food products” (11%) and “The reviews are helpful” (6%).
Product reviews are known to be very important for the retail user experience (as we also found in the outdoor retail website study). Overall, 80% of participants agreed that the reviews on the pet websites were helpful. PetSmart had the lowest agreement rate, but 75% still thought the reviews on the website were valuable.
“Not really a problem but I wish there were more reviews on more products and that the reviews were a bit more detailed and focused on the product vs what items their cat likes and other irrelevant stuff.” — Chewy.com user
“There is lots of information on each product. There are reviews and helpful pet advice.” — PetMeds user
Platform Access and Visit Intent
Most browsing happens on the desktop, but a substantial 69% reported accessing the website on their mobile device. Much fewer (20%) accessed the pet supplier’s native app, likely for lack of function and differentiation from the mobile web experience:
“Same as what I do on my PC. Browse, look at any new items and educate myself on what pet products are out there…” — PetMeds user
“I think the app is filled with a lot of useless stuff that people might not want to see.” — PetSmart user
Popular reasons for visiting the pet supply websites included browsing for products (47%), making purchases (19%), checking or comparing prices (16%) and looking for deals (7%).
We also asked participants whether they were able to accomplish their task on the last visit to the website. Accomplishment rates were fairly high across the sites, the lowest being PetMeds (82%) and the highest being Petco (96%).
The top reason for low task success on PetMeds was not being able to find the right medication or product for a reasonable price. Participants also mentioned difficulty with submitting prescriptions for their pet’s medication.
“They had what I wanted but I felt the prices were too high. There was also one item that the website said I would need to have a prescription faxed over for before they would ship. At that point for that specific item, I decided to just make the drive to the vet’s office.” — PetMeds user
Summary
An analysis of the user experience of four pet supply websites found:
- Chewy.com leads and PetMeds lags. Recent users of four pet supply websites reported an above average experience (SUPR-Q scores falling at the 77th percentile). Chewy.com had the highest relative scores at the 96th percentile, with PetMeds scoring the lowest at the 57th percentile. PetMeds fell behind due to an outdated design, high prices, and a clunky process for submitting prescriptions for medication. Chewy.com had the highest NPS (40%) while PetSmart had the lowest (0%).
- Scheduling services online can be a challenge. Scheduling in-store services such as grooming and training is a helpful feature on the Petco and PetSmart websites. However, participants had trouble with the process of booking an appointment. Booking forms were found to be a bit clunky (an area for improvement).
- Product selection impacts UX scores. The second most impactful key driver of SUPR-Q scores after brand attitude was a large selection of pet products on the website. Overall, participants thought the websites had a good selection of pet products with an average agreement rate of 92%. However, some participants on PetMeds and Chewy.com did mention a poor selection of items on the website. Having premium pet products was also found to explain 11% of the variance in SUPR-Q scores.