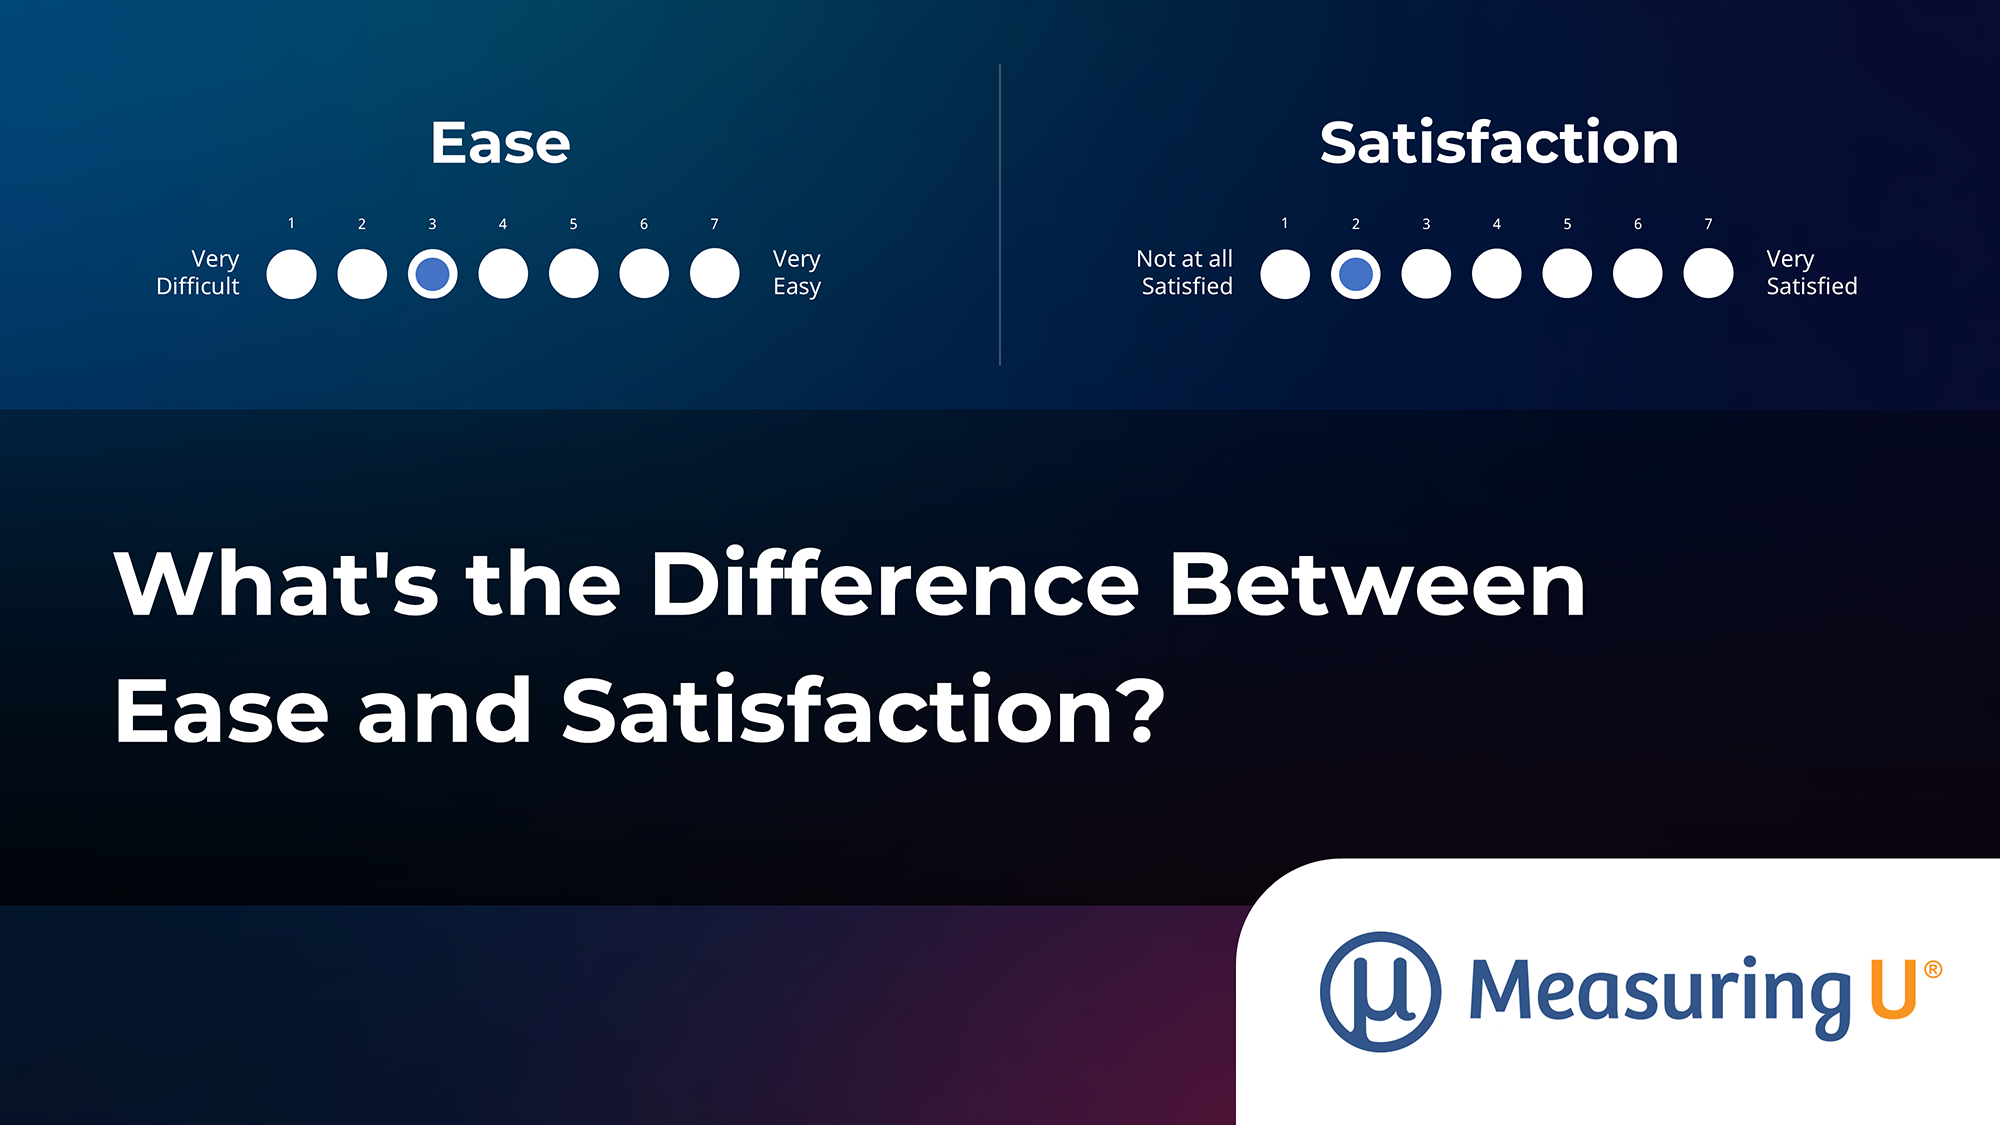
 “Satisfaction” is used rather broadly in vernacular speech.
We can feel satisfied with a meal, a movie, or a moment.
Our feeling of satisfaction blends utility (it fed me), affect (I enjoyed it), and expectation (it lived up to or exceeded what I wanted).
The dessert, the movie ending, or the moment can all be satisfying or unsatisfying. And we apply that same idea to measuring satisfaction in consumer and user research.
Customer or consumer satisfaction has a rich history going back almost a century. In the 1940s, satisfaction was used as a marketer’s goal for meeting consumer needs and wants (e.g., Duddy and Revzan, 1947, where they described “Dissatisfaction … because of defects in manufacture or design”).
Day (1977) and his colleagues began a modern tradition of research aimed at understanding satisfaction and related post-choice constructs.
The historical focus of UX research, in contrast, has been more on ease of use than on general satisfaction because ease is a key experiential driver of the broader construct of satisfaction.
However, because modern UX research often overlaps with traditional market research, UX research professionals may need to measure or at least consider customer satisfaction in testing efforts such as benchmarks or surveys.
In this article, at a conceptual level, we discuss the measurement of satisfaction and perceived ease of use in UX research at the study (overall) level and as post-task metrics.
Study Level
At the study level, measuring one or both of overall satisfaction and ease of use is fairly common, but market research emphasizes satisfaction and UX research emphasizes ease of use.
Study-Level (Product) Satisfaction
Satisfaction can be measured in anything: a brand, a product, a feature, a website, or a service experience. Consequently, it can be referred to as CSAT (customer satisfaction) or product satisfaction.
In our taxonomy of UX metrics, satisfaction is most commonly collected at the study level (Figure 1), meaning it’s collected only once to assess the overall product experience. It can be measured using a simple seven- or eleven-point scale or one of the industry metrics, such as the Microsoft Net Satisfaction score (NSAT) or the American Customer Satisfaction Index (ACSI, which is a proprietary mix of three aspects of satisfaction).
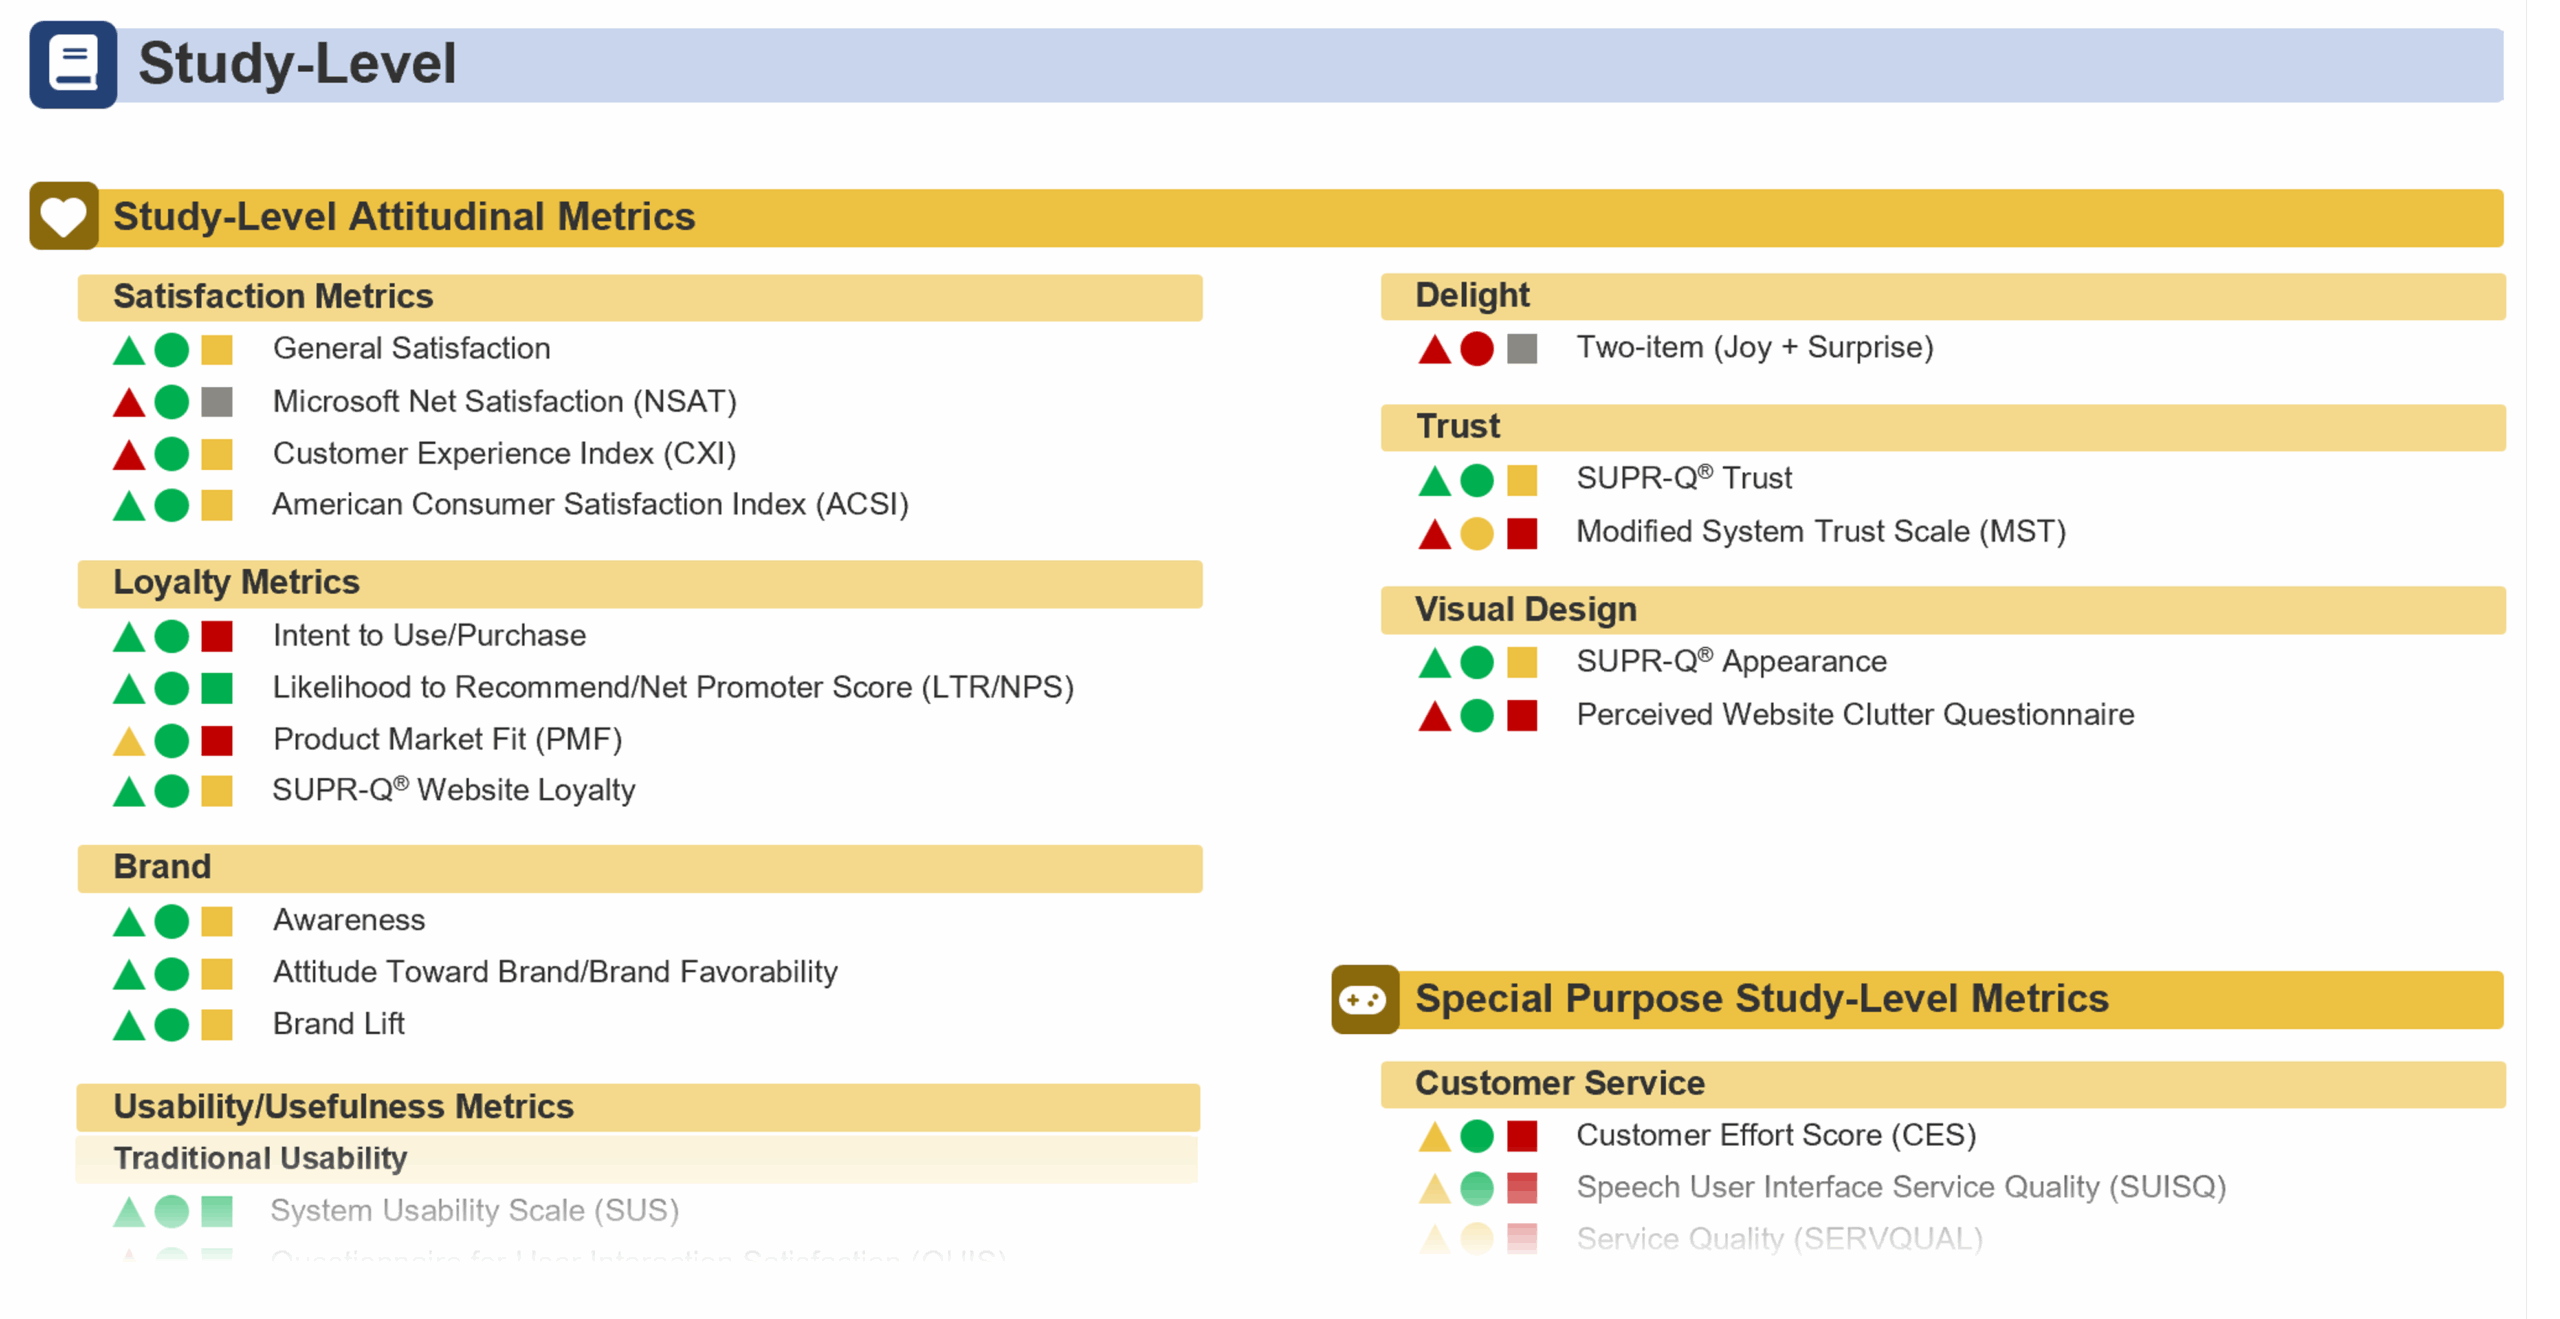
Figure 1: Study-level metrics from the MeasuringU taxonomy of UX metrics include four measures of satisfaction.
Study-Level Ease
Perceived ease of use can also be measured at the product level. We have written extensively about the many ways of measuring ease. Most major standardized UX questionnaires designed to assess user experiences at the study level (e.g., SUPR-Q®, SUS, PSSUQ, UX-Lite®, and TAM) have at least one item (and sometimes more) dedicated to measuring perceived ease (Figure 2). However, satisfaction with a product conceptually involves more than just finding a product easy to use. Product usefulness, pricing, integration, and support are some of the other common constructs that can affect satisfaction, but ease is a fundamental driver.
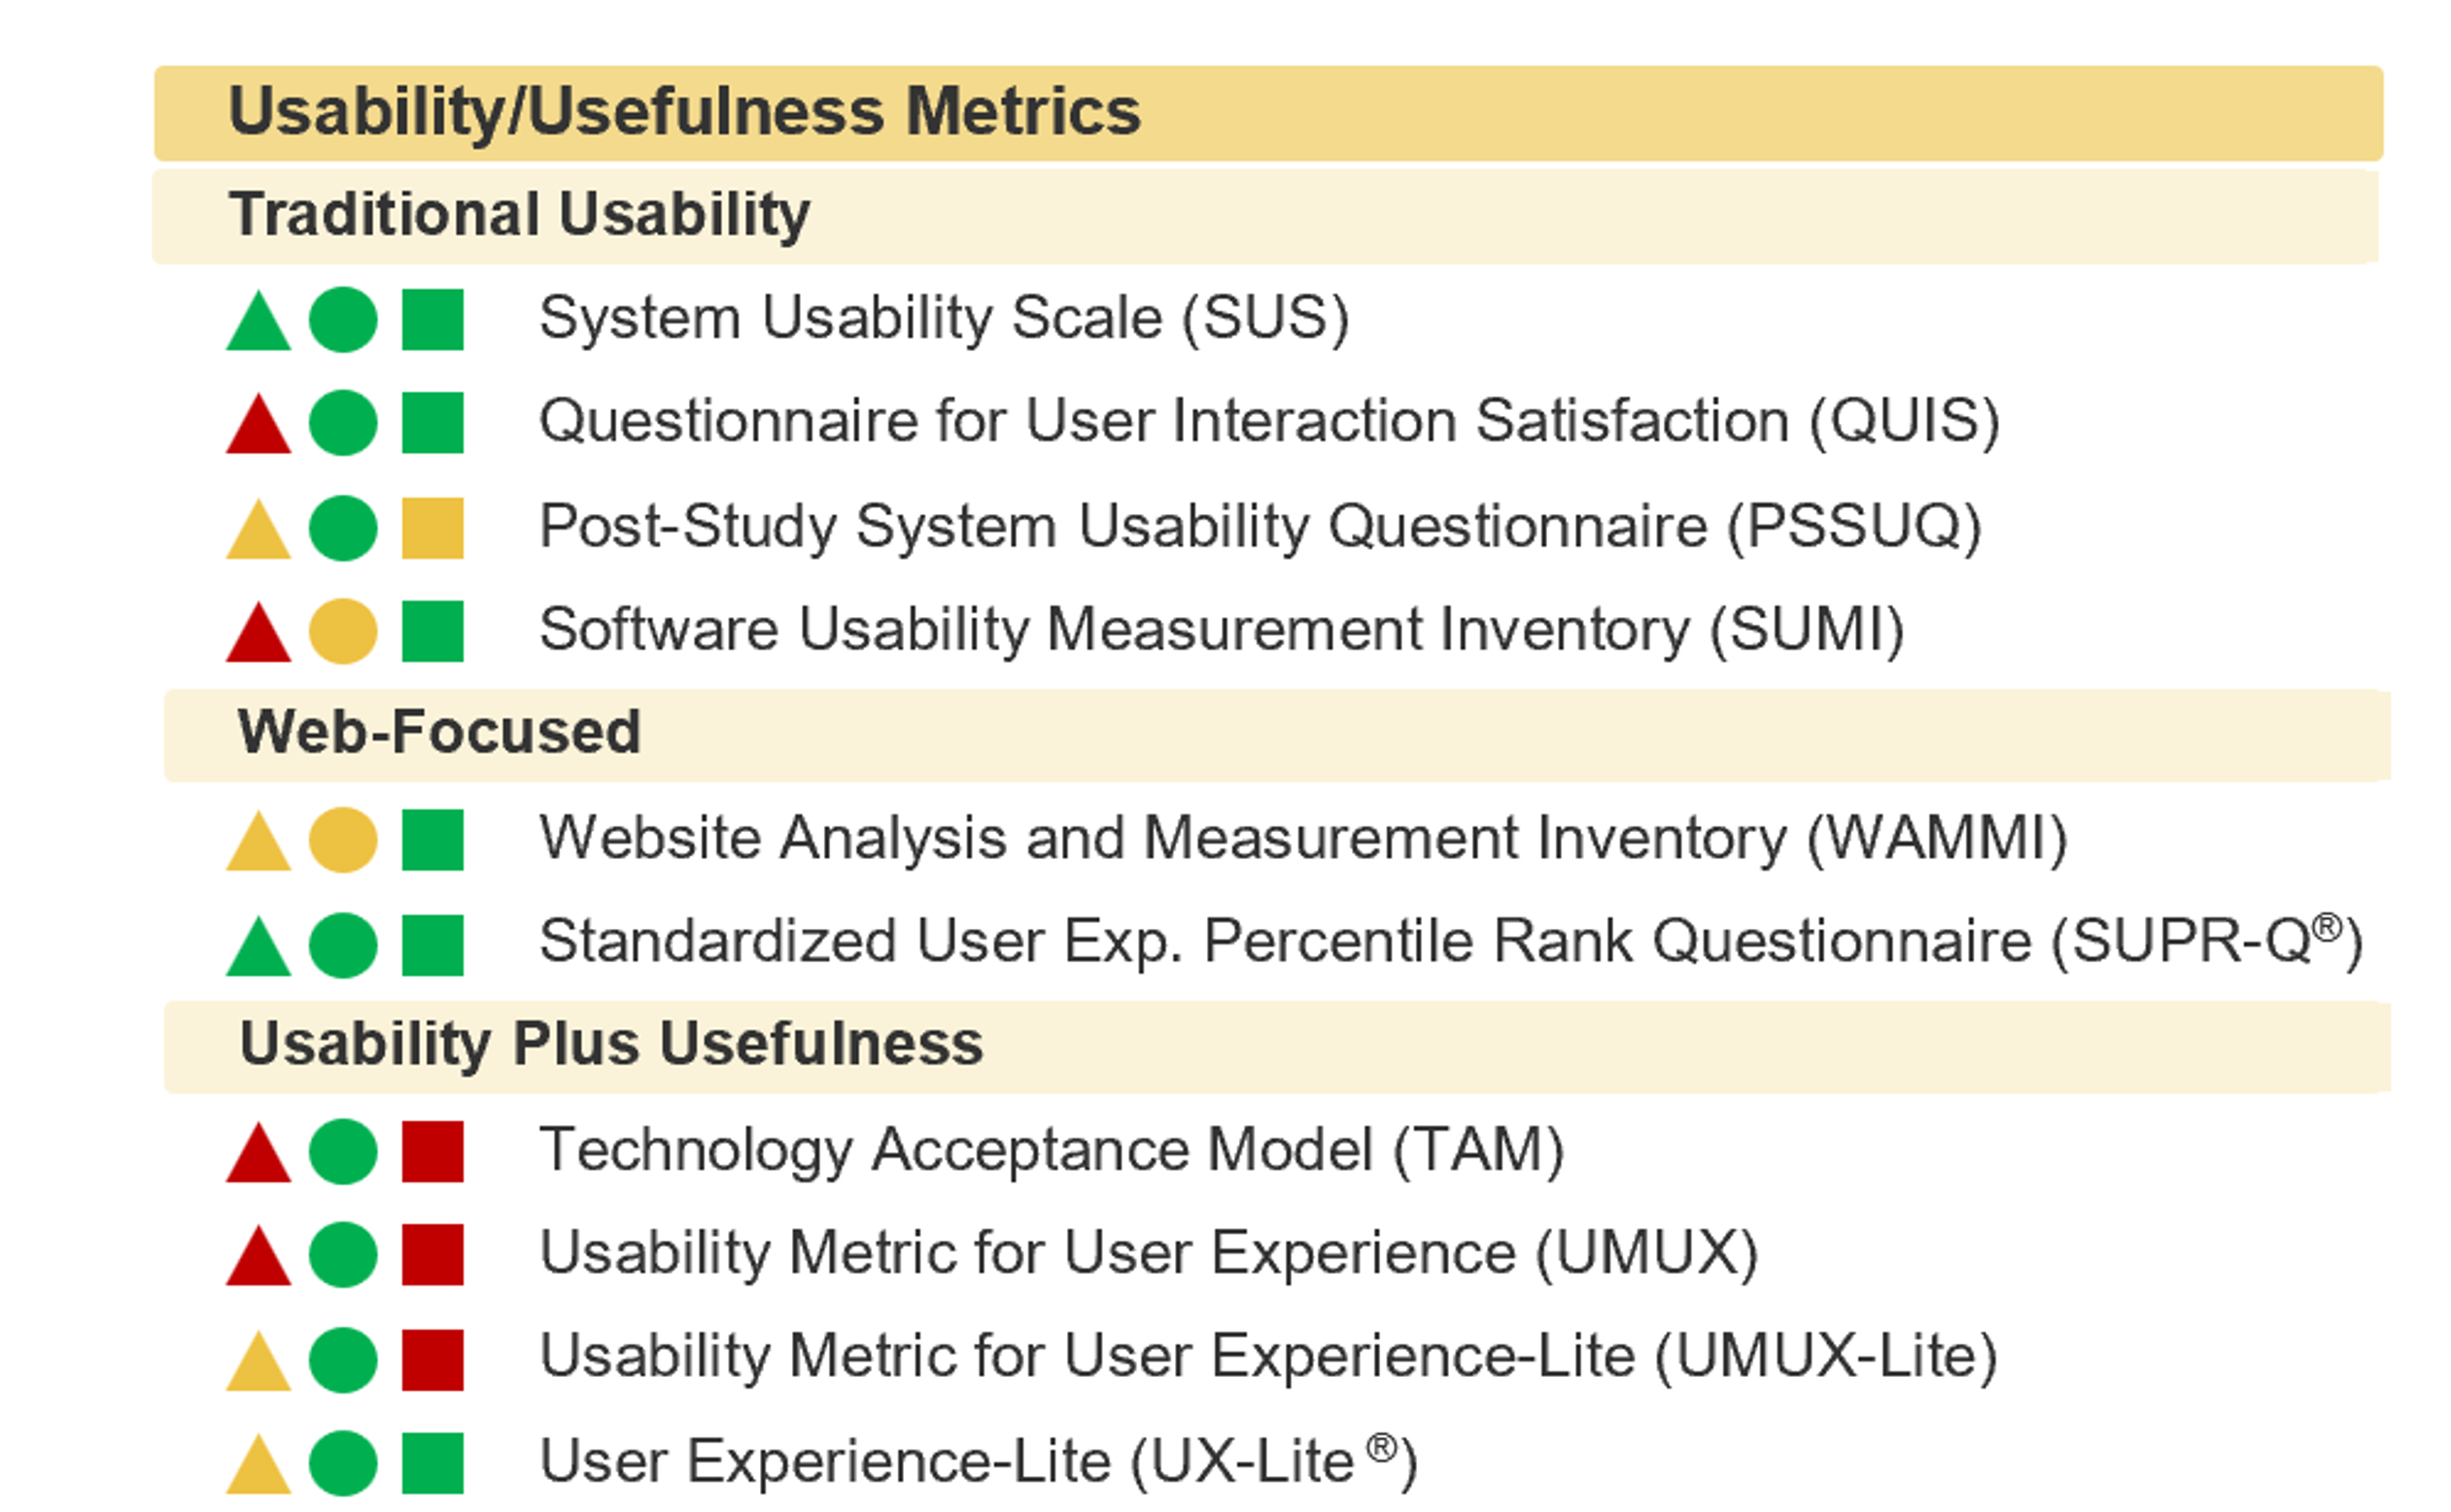
Figure 2: Study-level metrics from the MeasuringU taxonomy of UX metrics include numerous standardized questionnaires that measure perceived ease (e.g., SUS, PSSUQ, SUPR-Q, TAM, UMUX, UMUX-Lite, UX-Lite).
Task Level
At the task level, measuring task ease is more common than measuring task satisfaction, largely because task-level evaluation, as conducted in usability studies (a key UX activity), is relatively rare in market research. That said, nothing prevents researchers from including an item to assess task satisfaction in addition to the perceived ease of task completion. We now include both in our taxonomy of UX metrics at the task level (Figure 3).
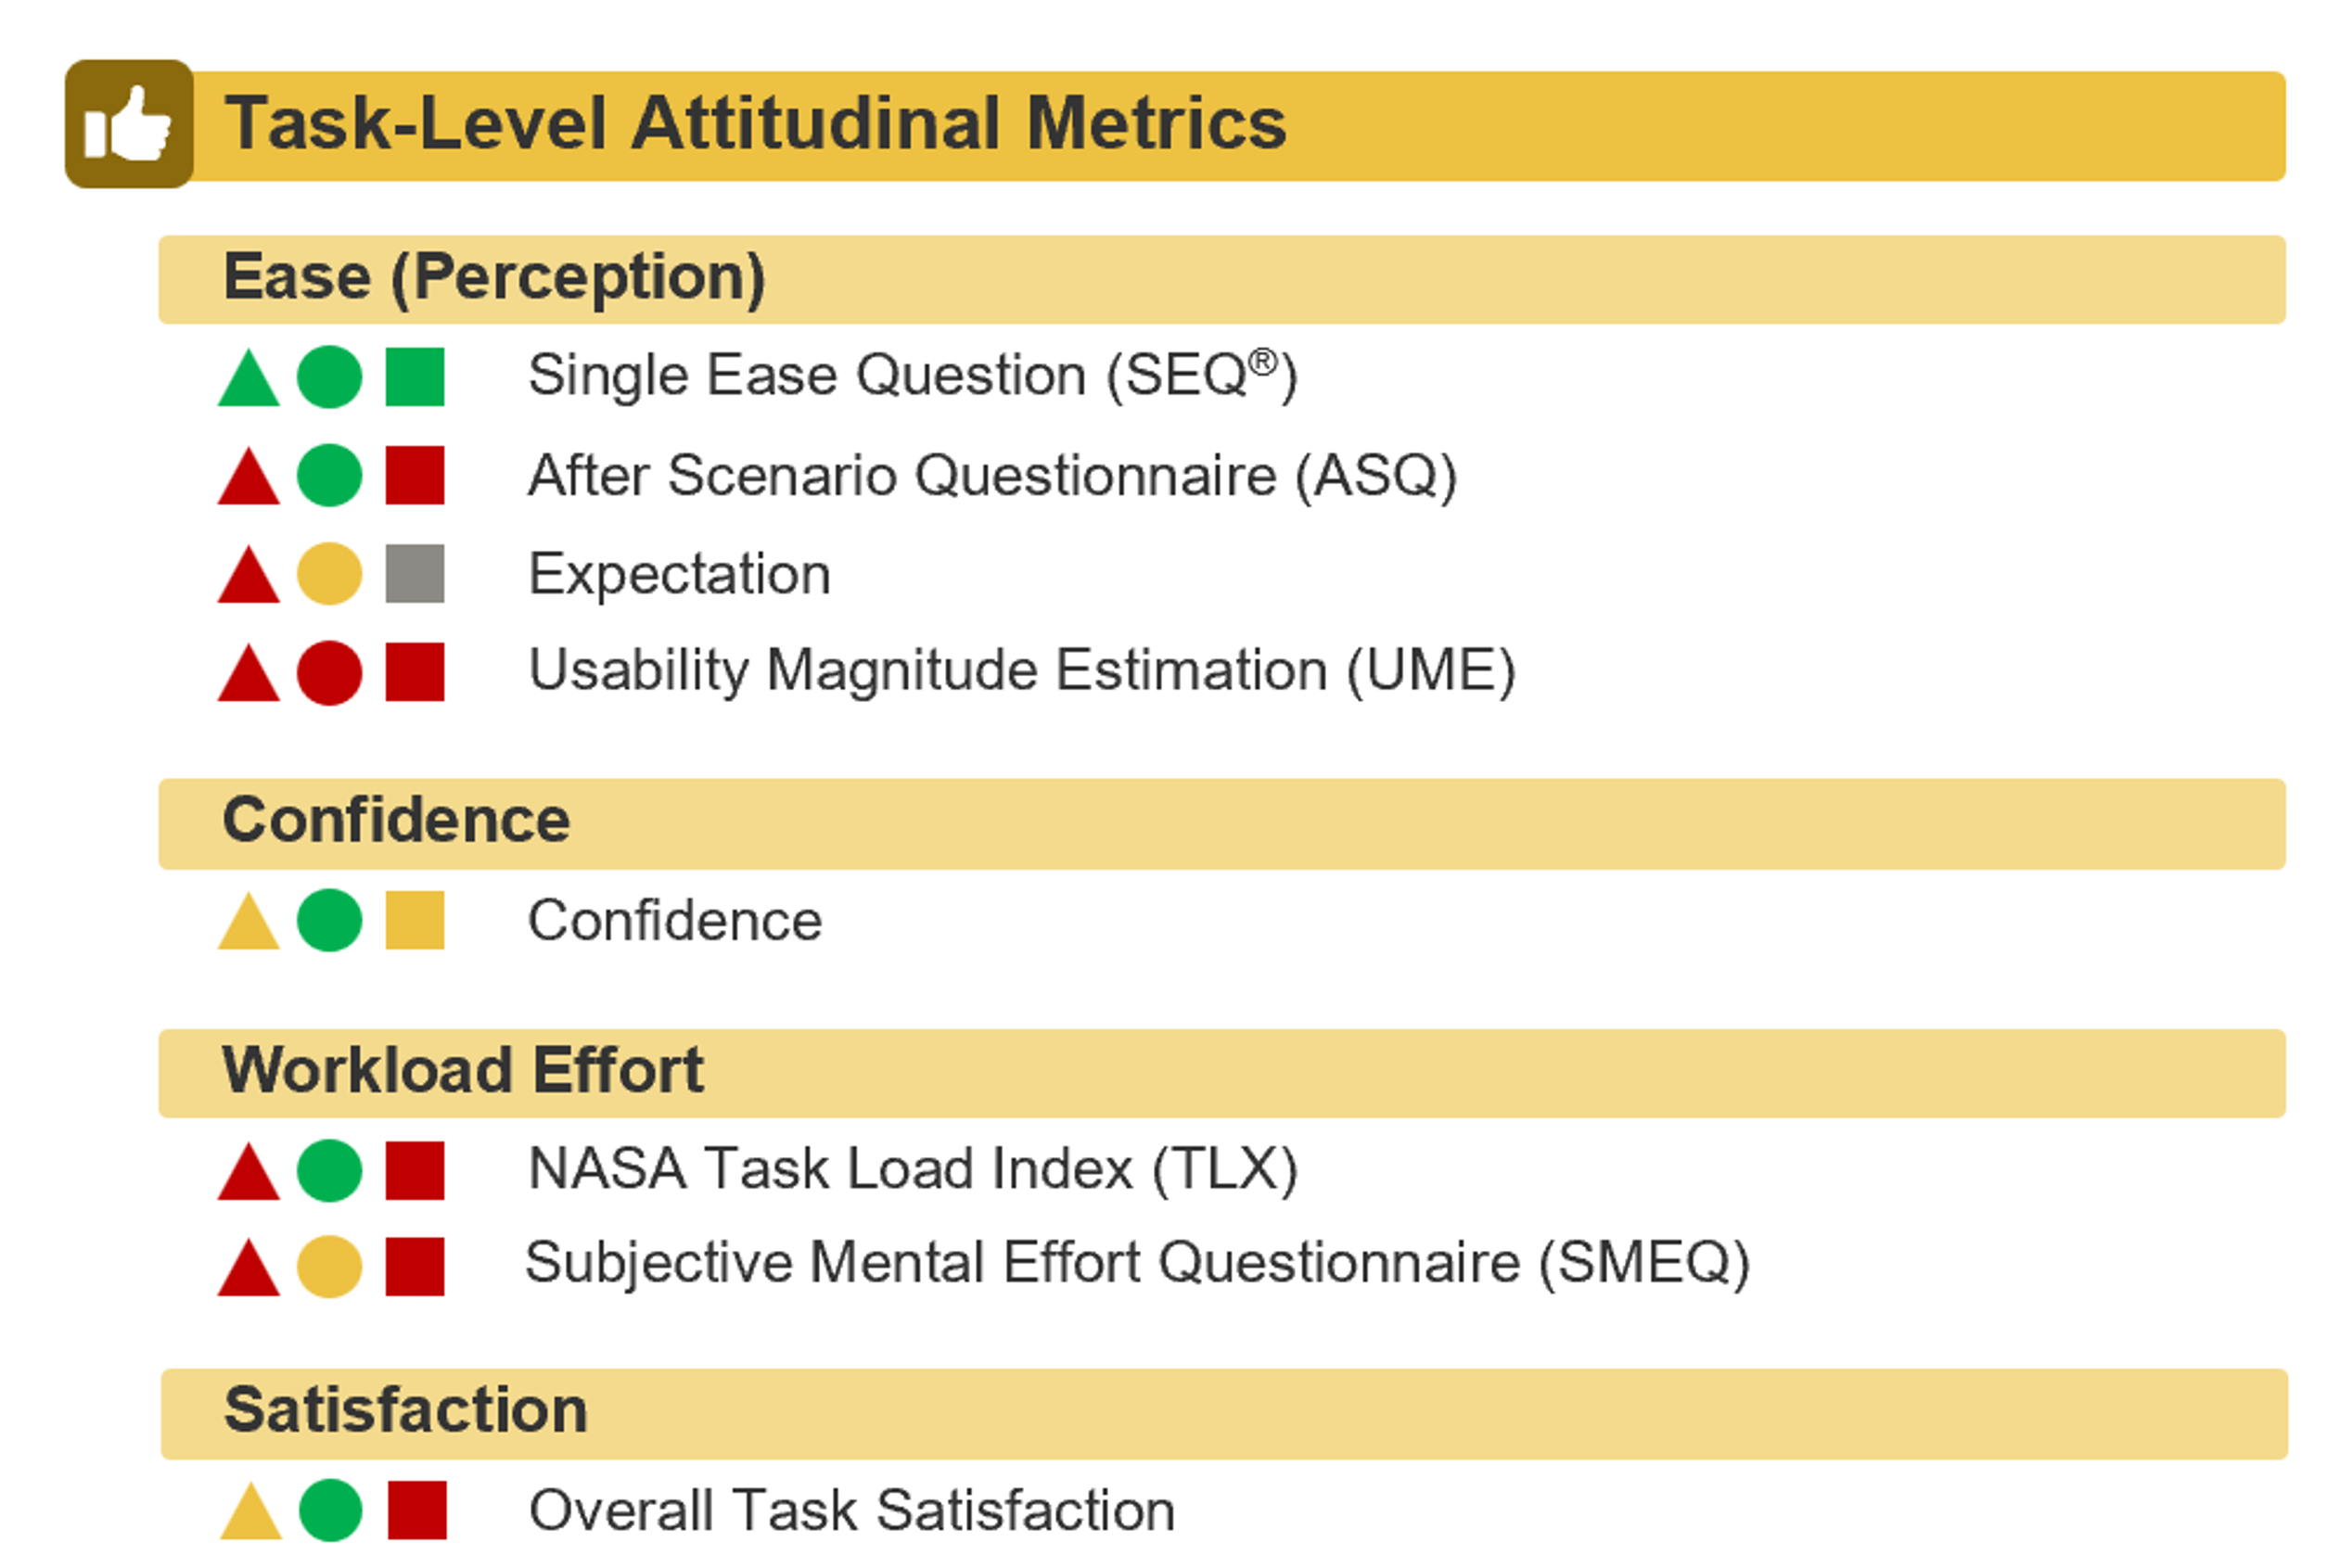
Figure 3: Attitudinal task-level metrics from the MeasuringU taxonomy showing measures of perceived ease and general satisfaction (along with confidence and workload effort).
Task-Level Satisfaction
While less common than ease ratings, satisfaction ratings can also be collected at the task level. After a participant attempts a task, they can be asked how satisfied they are with the website, the app or product, or a specific functional area.
Task-Level Ease
The Single Ease Question (SEQ®) is the most commonly used post-task measure of ease (with over 600 citations). This single-item scale provides a reliable and sensitive measure of the perceived ease or difficulty of a task experience.
Satisfaction vs. Ease
At both the study and task level, conceptually, satisfaction is a broader construct than ease. We often depict satisfaction as a consequence of several variables along with ease, including, to name a few, usefulness, price, and quality. Under this broader construct, people can be satisfied with a product or experience but not necessarily think it’s easy to use. Higher satisfaction scores would have to come from other aspects of the product than ease, such as great features, low price, or wide availability. While the two differ conceptually, we’ll explore qualitatively how much measures of satisfaction and measures of ease actually differ in a future article.
Historical Role of Satisfaction in UX Research
Although satisfaction is often considered a primary measure for market researchers, it also played an early and fundamental role in the definition of UX metrics, reflected in the high-level constructs of the first international usability standard, ISO-9241 Part 11. In that standard, the specified components of usability were effectiveness, efficiency (objective metrics), and satisfaction (a subjective metric).
The use of these constructs was common before the publication of the ISO standard in 1998, dating back to at least the early 1980s. The first draft of the standard appeared in 1988, and specific metrics were investigated in the European MUSiC project.
ISO-9241 Part 11 and other early UX standards specified measurement of satisfaction but did not usually require specific metrics. The definition of satisfaction from ISO-9241-11 was “freedom from discomfort and positive attitudes towards the use of the product.” Regarding the measurement of satisfaction, the 2001 ANSI standard Common Industry Format for Usability Test Reports stated (p. 11):
A variety of instruments are available for measuring user satisfaction of software interactive products, and many companies create their own. Whether an external, standardized instrument is used or a customized instrument is created, subjective rating dimensions such as Satisfaction, Usefulness, and Ease of Use should be considered for inclusion, as these will be of general interest to customer organizations. A number of questionnaires are available that are widely used. They include: ASQ, CUSI, PSSUQ, QUIS, SUMI, and SUS. While each offers unique perspectives on subjective measures of product usability, most include measurements of Satisfaction, Usefulness, and Ease of Use.
So, in the early days of UX research and measurement, especially in the context of usability testing, the concept of satisfaction was broad and included measures of ease of use as proxies of satisfaction.
The After-Scenario Questionnaire (ASQ)
While the Single Ease Question (SEQ) has become the industry standard for measuring post-task ease, prior to its development, we used the After Scenario Questionnaire (ASQ).
The three-item ASQ was developed by Jim Lewis and colleagues in 1988 as part of an IBM Research system usability metrics project (Figure 4). Although the item format is completely different from the standard SEQ (a lower rating indicates better experience, agreement rather than item-specific endpoints, and satisfaction-based wording), it contains a single-item seven-point measure of perceived ease.
Consistent with the emerging definition of usability at the time of its development, all the items of the ASQ, including the ease item, were framed in the context of satisfaction but were directed at potential drivers of satisfaction at the task level. Over time, the focus in UX practice shifted away from this nod to satisfaction and streamlined the wording of items to focus on their distinctive content (e.g., the SEQ).
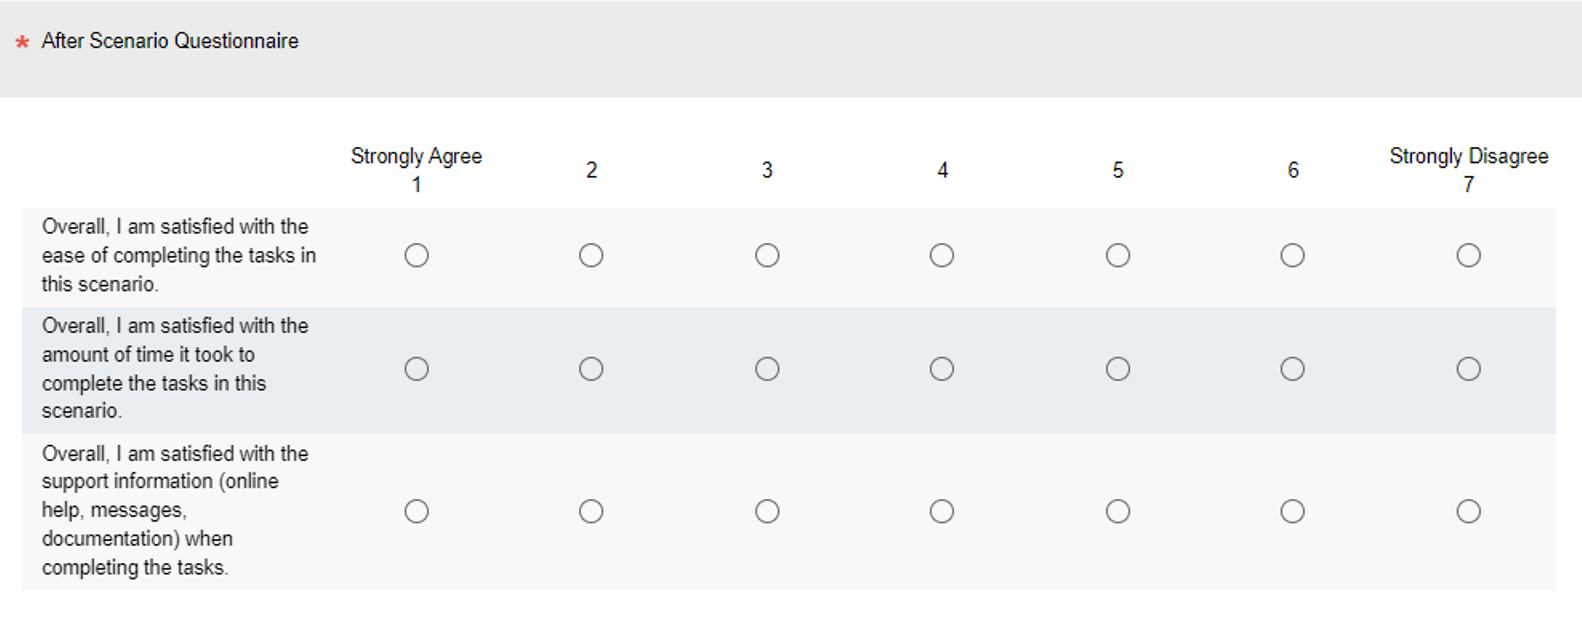
Figure 4: The ASQ (from 1990).
Satisfaction and the Single Usability Metric (SUM)
When we wrote about the Single Usability Metric (SUM) in 2005, we incorporated satisfaction into our model along with objective metrics such as task completion rates and times. Our original three-item measure of satisfaction was based on the ASQ, retaining ratings of task ease, task completion time, and overall task satisfaction, then averaging the three ratings for a composite satisfaction score. That’s another broad use of satisfaction as a measure of users’ attitude toward the experience, consistent with the guidance in ISO 9241-11 and other usability standards of the time.
Future Role of Satisfaction in UX Research
As we consider the future of satisfaction in UX research, we see an opportunity for UX researchers not to feel like they should avoid satisfaction because it’s historically been a metric tracked by another department. We recommend, when appropriate, including general satisfaction (e.g., CSAT) in their battery of subjective metrics, at least at the study level (and possibly at the task level).
Whether or not ratings of satisfaction and perceived ease of use have a high correlation and correspondence (which we are investigating and plan to report in future articles), outside of UX, they are conceptually distinct. Ease is influential in UX research; satisfaction is influential in CX and market research. This is likely due to the logic that perceived ease affects satisfaction rather than the reverse.
UX research tends to focus on the precursors to satisfaction because these precursors are closely related to the specific designs of products or services. CX and market research tend to focus on satisfaction as a driver of important business metrics (e.g., behavioral intentions such as likelihood to repurchase, actual repurchasing behavior, or profit).
Including the measurement of satisfaction in UX research (when appropriate) would enable the quantification of the extent to which perceived ease of use (and other UX metrics such as perceived usefulness, appearance, and trust) drives satisfaction, a major step in bridging the gap between UX and business metrics.
Summary and Takeaways
Customer satisfaction is a key metric in market research and business.
Historically, a particular conceptualization of satisfaction has also been important in UX research, but the business and UX conceptualizations are not the same.
From the early days of usability testing to the later development of international usability standards, the UX conceptualization of satisfaction has been any attitude toward a product. Of the various attitudes people might have toward a product, ease of use is a major one.
In this article, we’ve discussed the measurement of satisfaction and ease of use at study and task levels and have presented an argument for measuring both in UX research (at least at the study level) to provide a quantitative connection between UX and business metrics.
Note: Our taxonomy is a living document. Like anything else, the popularity of metrics can rise and fall, new methods make formerly difficult metrics easier to collect, and metrics that do not have benchmarks this year might have some next year. We plan to update this infographic over time, so in the future, you can click here for the latest version.