 Do researchers agree on what the problems are in an interface?
And will researchers group the problems into the same categories?
When coding open-ended comments in a survey, will different researchers classify the comments differently?
These discovery and classification activities are quite common in UX research, but they are often conducted by a single person who uses their sole judgment.
Having just one researcher on an industrial project is common because of the need to make rapid decisions and iterate designs quickly. But when the stakes are higher (and especially in academic research), you’ll want to include more researchers. The additional perspective helps get to a more repeatable process by measuring and improving interrater reliability among different researchers.
At MeasuringU, we commonly use multiple researchers to provide more perspectives on activities like finding and classifying usability problems, PURE evaluations, and when coding themes in open-ended comments.
But how do you measure reliability? Typically, researchers reconcile differences in judgment before presenting findings to stakeholders. But to assess reliability, researchers need to work independently and then get together to quantify the extent to which their judgments are similar using different reliability measures before consensus discussion.
In this article, we’ll go over the two most common measures of reliability used in UX research: kappa (for classification studies) and any-2 agreement (for discovery studies).
Kappa (Classification)
Kappa is a commonly used measure of interrater reliability that corrects for chance agreement in classification. It’s used widely in academic and applied research. For example, it was the most common measure of interrater reliability reported in our literature review of usability problem classification frameworks.
Kappa can take values between −1 and 1 and is often interpreted with the Landis and Koch guidelines (poor agreement: ≤ 0, slight: 0.01–0.20, fair: 0.21–0.40, moderate: 0.41–0.60, substantial: 0.61–0.80, almost perfect agreement: 0.81–1.00).
The setup for the simplest version of kappa is a 2×2 table like the one shown in Table 1.
Table 1: 2×2 table for assessing interrater agreement (counts).
Across a series of n classification judgments:
- Cell a is the number of judgments where the evaluators agree that the object or event being classified is a member of the specified class.
- Cells b and c are the counts where the evaluators disagree (b: No from Rater A and Yes from Rater B, c: Yes from Rater A and No from Rater B).
- Cell d is the number of judgments where the evaluators agree that the object or event being classified is NOT a member of the specified class.
The values in the cells add up to n. Table 2 shows the arrangement in which cells a through d are proportions (the count of each cell divided by n), and the table includes marginal totals (e.g., pa + pb = p2). For a table like this, the overall proportion of agreement, po, is the sum of pa and pc.
Table 2: 2×2 table for assessing interrater agreement (proportions).
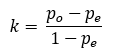
The chance-expected agreement for the overall proportion of agreement, pe, is the sum of p1 × p2 and q1 × q2. Once you have po and pe, you can compute kappa using the simple formula:
The standard error of kappa for a 2×2 table (derived from Fleiss, 1981) is:
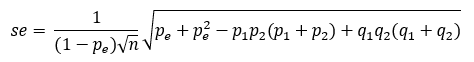
The standard error can be used to test whether kappa is significantly different from 0 and to construct confidence intervals.
The test of significance is a simple z-test using z = k/se. To get the margin of error for a confidence interval, multiply the standard error by the value of z for the desired level of confidence (common values are 1.96 for 95% confidence and 1.645 for 90% confidence). That’s a daunting formula for the standard error, so here are some examples to make this more concrete.
Example 1
Suppose two UX researchers independently used a 50-item yes/no assessment form to rate the usability of a software product (such as a guideline review). Table 3 shows the number of their agreements and disagreements. Table 4 shows the proportions needed to compute kappa and its standard error.
Table 3: Data for hypothetical comparison of two raters.
Table 4: Proportions from Table 3.
For this analysis, the observed proportion of agreement is .80 and chance-expected agreement is .52, so kappa is .58 (moderate agreement), the standard error is .1414, kappa is significantly greater than 0 (z = .52/.1414 = 4.12, p = .00004), the 95% margin of error is ± .28 (95% confidence interval ranging from .31, fair agreement, to .86, almost perfect agreement). In other words, our best estimate of kappa (.58) indicates moderate agreement, and the confidence interval indicates that the lowest plausible level of agreement is .31 (fair agreement).
Example 2
We used kappa in a study of interrater agreement of the classification of user comments collected in a retrospective UX survey that were rated by multiple UX researchers and ChatGPT-4 runs, averaged across multiple human and machine classifications. We estimated the mean kappa for human coders was .704, for ChatGPT runs was .684, and for all possible pairs of human coders and ChatGPT runs was .632.
Tables 5 and 6 show the data and kappa analysis for two human coders classifying 52 comments as referring or not referring to the appearance of an office supplies website.
Table 5: Ratings of two UX researchers whether user comments were about website appearance (Yes if they were; No if they weren’t).
Table 6: Proportions from Table 5.
The observed agreement from Table 5 was high (.96) because for 47 of the 52 comments the researchers agreed that the content was not about website appearance. For the remaining comments, Rater B thought five comments referred to appearance, while Rater A classified only three comments this way. With this distribution of judgments, the chance expected agreement was also high (.86). Kappa was .73 (substantial agreement) with a standard error of .1335—significantly greater than 0 (z = 5.47, p < .00001) and with a 95% confidence interval ranging from .47 (moderate) to .99 (almost perfect).
Any-2 Agreement (Discovery)
The second reliability measure is the average any-2 agreement rate, which was developed by Hertzum and Jacobsen (2003) to assess the consistency in the number of usability problems uncovered between all pairs of evaluators in their groundbreaking research on the evaluator effect. They considered using kappa as a measure but found that it wouldn’t work for this type of analysis because the meaning of the counts in the cells of a 2×2 discovery table is different from those in a classification table, even though they have a similar appearance (Table 7).
Unfortunately, no one has published a standard error specifically for any-2 agreement rates, so the use of the metric is limited to computing the rates from all possible pairs of evaluators and taking the mean to get the average any-2 agreement rate for a study.
In the following discussion, we focus on problem discovery in usability testing, but the computational methods apply to any discovery process (e.g., discovery of themes in content analysis of interviews).
Table 7: 2×2 table for assessing any-2 agreement (counts).
In a discovery study (e.g., a usability study), cell a is the number of critical events (e.g., usability problems) identified by both evaluators, cell b is the number of critical events identified by Evaluator B only, cell c is the number of critical events identified by Evaluator A only, and cell d will always be 0 because the sum of the counts in cells a, b, and c is necessarily equal to the number of critical events discovered by the two evaluators. The standard formula for any-2 agreement for this type of 2×2 table is a/(a + b + c).
It is also possible to conceptualize these results as a Venn diagram in which one circle represents all the problems discovered by one evaluator (A), the other circle represents all the problems discovered by the other evaluator (B), and their intersection is the number of problems discovered by both (C). With this conceptualization (see Figure 1), the any-2 agreement is the intersection (C) divided by the union (A + B − C).
Example 1
We computed any-2 agreement rates in our examination of the evaluator effect in unmoderated usability testing. Table 8 shows the pattern of usability problem discovery by two evaluators (Y and C).
Table 8: Example from a usability problem (discovery) study.
Evaluator Y identified 14 usability problems, and Evaluator C identified 17 usability problems, 10 of which were identified by both. Using the standard formula for any-2 agreement, this would be 10/(10 + 7 + 4) = 10/21 = 48%. The result is the same using the Venn diagram conceptualization shown in Figure 1 (10/(14 + 17 − 10) = 10/21 = 48%).
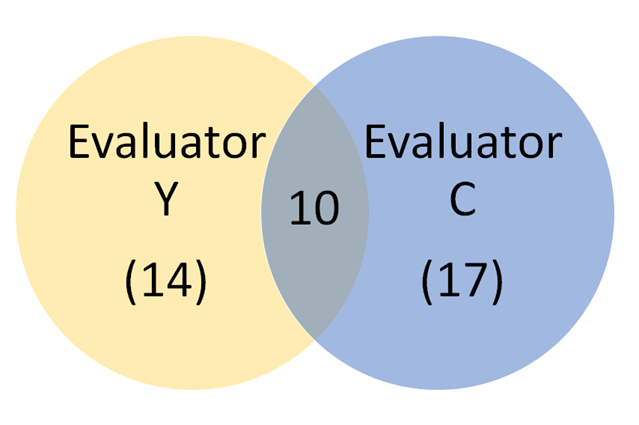
Figure 1: Venn diagram of problem discovery overlap by Evaluators Y and C.
Table 9 shows the any-2 agreement rates for the four evaluators in this study. With four evaluators, there are six possible pairs (this representation of the results is essentially a summary of six Venn diagrams). The any-2 agreement averaged across all pairs of evaluators in this study was 41%.
Table 9: Any-2 agreement rates for four evaluators. The diagonal shows the number of issues discovered by the indicated evaluator. The numbers below the diagonal are the number of issues in common for the pair of evaluators, and the percentages above the diagonal are the any-2 agreements for each pair of evaluators.
Example 2
Table 10 shows the results of a study of any-2 agreement among four evaluators who identified usability problems that occurred in a set of 24 videos in which participants attempted a task on the United Airlines website without thinking aloud (no recorded sound). The agreement between Evaluators Y and C was 44% (8/(10 + 16 − 8)). Across the six pairs of evaluators, the average any-2 agreement rate was 34%.
Table 10: Any-2 agreement for problem discovery by four evaluators reviewing 24 silent task videos.
Discussion and Summary
Two fundamental UX research activities are classification and discovery. Even though they both produce data that can be organized in 2×2 tables, their interpretation and analysis are different (Table 11).
| Type of Study | Interpretation of 2x2 Table | Analyze With |
|---|---|---|
| Classification | Two evaluators (A and B) classify a set number of items into groups with four possible outcomes: (1) agreement that the item is a member of the group, (2) agreement that the item is not a member of the group, (3) A assigns the item to the group but B does not, (4) B assigns the item to the group but A does not. | Kappa |
| Discovery | Two evaluators (A and B) create lists of discovered items such that some items are discovered only by one evaluator, but others are discovered by both. | Any-2 agreement |
Table 11: Summary of interpretation and analysis of classification and discovery data.