 The seven-point Single Ease Question (SEQ®) has become a standard in assessing post-task perceptions of ease.
We developed the SEQ over a decade ago after our research showed it performed comparably to or better than other single-item measures. It is an extension of an earlier five-point version that Tedesco and Tullis (2006 [PDF]) found performed best relative to a few alternatives.
Since the SEQ’s inception, we have collected data from thousands of task experiences to generate a normalized database of scores with an average ease score of about 5.5. We have also established its strong correlation to task completion and task time.
Other than changing the number of points, we have also wanted to understand the impact of other slight variations on the presentation of the scale, including numbering, labels, and orientation (polarity).
Consider the two SEQ items shown in Figure 1.

The only difference is in the polarity of the endpoints. The standard version has Very Difficult on the left, and the alternate version has Very Easy on the left.
It seems like measures taken with these two formats might be systematically different, but then again, maybe not.
In this article, we describe why the formats may or may not produce different outcomes and the results of an experiment to estimate the magnitude of the difference.
Why Is the Standard Format Standard?
Although there has been variation in this aspect of rating scale design over the years, the more common current practice is to put the endpoint associated with a poorer experience or less agreement on the left. The System Usability Scale (SUS) has the negative pole on the left, as do the SUPR-Q®, QUIS, and SUMI. In contrast, the Post Study System Usability Questionnaire (PSSUQ) has the positive pole on the left.
The rationale for using the standard format includes pragmatic and theoretical elements. Pragmatically, it’s generally easier to interpret results when larger numbers indicate a better outcome. Theoretically, putting the negative-tone endpoint on the left has been hypothesized to strike some balance between two potential response biases: left-side bias (tendency to select the leftmost response option) and acquiescence bias (tendency to be agreeable or positive).
So, the hypothesis is that putting Very Difficult on the left and Very Easy on the right splits the biases between the endpoints. On the other hand, putting Very Easy on the left might artificially increase the likelihood of its selection because it would attract both types of bias, manipulating the response distribution to a more favorable outcome.
How Strong Are Left-Side and Acquiescence Biases?
For these theoretical arguments to be compelling, there would need to be evidence that the effects of these biases are consistent and strong.
We recently conducted a critical literature review on the left-side bias. In that review of six research papers, only four reported credible effect sizes for a bias (three on the left side, one on the right), averaging 0.6% of the range of the rating scales used in the studies.
A consistent and strong effect of acquiescence bias has also been elusive. According to Nunnally (1978, p. 669), “The overwhelming weight of the evidence now points to the fact that the agreement tendency [acquiescence bias] is of very little importance either as a measure of personality or as a source of systematic invalidity in measures of personality and sentiments.” For example, despite claims that acquiescence bias has more effect on response to items with agreement endpoints (Likert-type items) than item-specific endpoints, Lewis (2018) found a nonsignificant mean difference of just 0.5% of the scale range in the direction expected for an acquiescence bias.
In summary, the research literature indicates that if there are left-side and acquiescence biases, they are neither consistent nor strong.
Based on this reading of the literature, it is plausible that data collected with the two SEQ formats illustrated in Figure 1 would be very similar. To test this possibility, we conducted an experiment.
Experimental Design: SEQ Standard vs. Alternate Formats
Using our MUIQ® platform for conducting unmoderated remote UX studies, we set up a Greco-Latin experimental design to support a within-subjects comparison of standard and alternate versions of the SEQ in the contexts of attempting easy and difficult tasks.
- Easy task: Find a blender on the Amazon website for under $50. Copy or remember the name of the blender brand.
- Difficult task: Please find out how much the monthly cost of an iPhone 12 with 64GB of storage with service for one line is on the AT&T website. Copy or remember the monthly cost (including all fees).
We collected data from 301 participants (sampled in February and March 2022 from a U.S. panel provider). After attempting each task, participants completed either the standard or alternate version of the SEQ, following the experimental design. After completing both tasks, they indicated whether they preferred the standard or alternate format.
In this experimental design, there were three independent variables:
- Item Format: standard or alternate, as shown in Figure 1
- Rating Context: easy or difficult task
- Order of Presentation: the Greco-Latin design had four orders of presentation (standard/easy then alternate/difficult; standard/difficult then alternate/easy; alternate/easy then standard/difficult; alternate/difficult then standard/easy)
Participants were randomly assigned to one of the four orders of presentation. Across the experiment, this controls for the “nuisance” variables of Rating Context and Order of Presentation, although, in this experiment, we were also interested in the interaction between item format and task difficulty.
Results
Because the most common way to analyze SEQ scores is with the mean, that’s our focus in this article. We will analyze the response distributions, especially top- and bottom-box scores, in a future article.
Due to the item format manipulation used in this experiment, we reversed the SEQ scores collected with the alternate format, so for both formats, a higher score indicates a better (easier) user experience.
Did Participants Rate the Difficult Task as More Difficult?
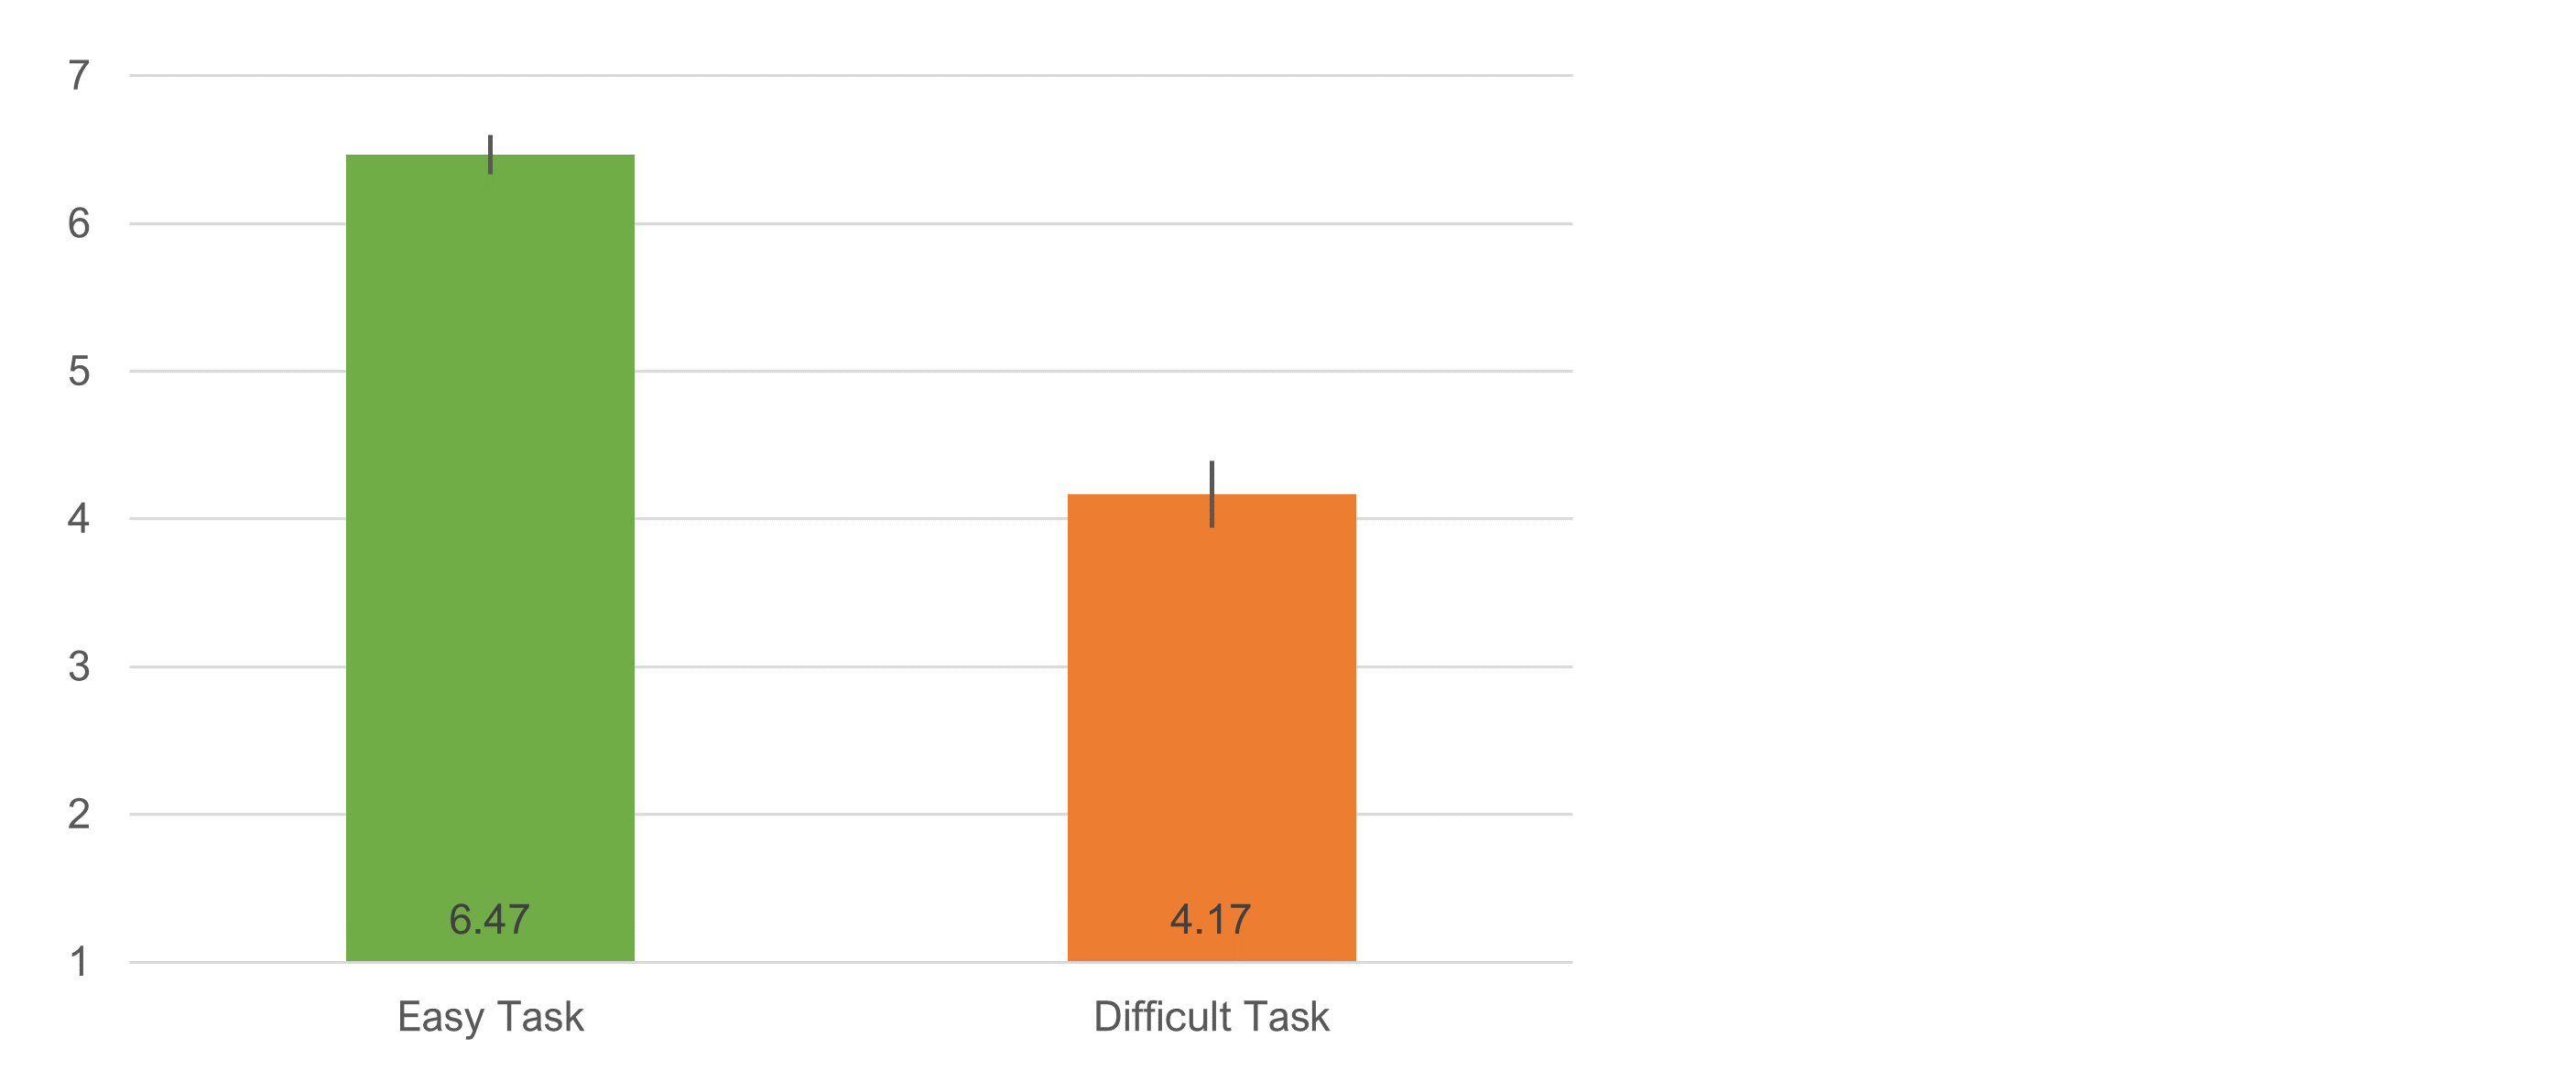
We designed the tasks to be different in their levels of perceived ease, so the first thing we checked was whether there was an overall significant difference in mean SEQ for the two tasks. As expected, the difference was statistically significant (t(300) = 18.3, p < .0001). As shown in Figure 2, the mean difference was 2.3 (a substantial 38.3% of the SEQ’s seven-point scale, with a 95% confidence interval ranging from 2.05 to 2.55).
Using our database of tasks, the easy task is ranked at the 90th percentile (easier than 90% of all tasks in the database) and the hard task at the 13th percentile (harder than 87% of tasks). It was quite hard to find the monthly cost of the iPhone plan.
Across the Experiment, Did Item Format Make a Difference?
Figure 3 shows the overall difference in SEQ means as a function of format (averaged across the two tasks and four orders of presentation). The difference was not statistically different (t(300) = .255, p = .80). The mean difference was .05 (standard higher), which corresponds to 0.8% of the range of the SEQ’s seven-point scale (with a 95% confidence interval around the mean ranging from −.31 to .41).

We also checked whether the difficulty of the tasks affected the mean differences for the item formats, with the results shown in Figure 4. The means for both formats were high when the task was easy and low when the task was difficult. The differences due to item format were not significant for either level of task difficulty.
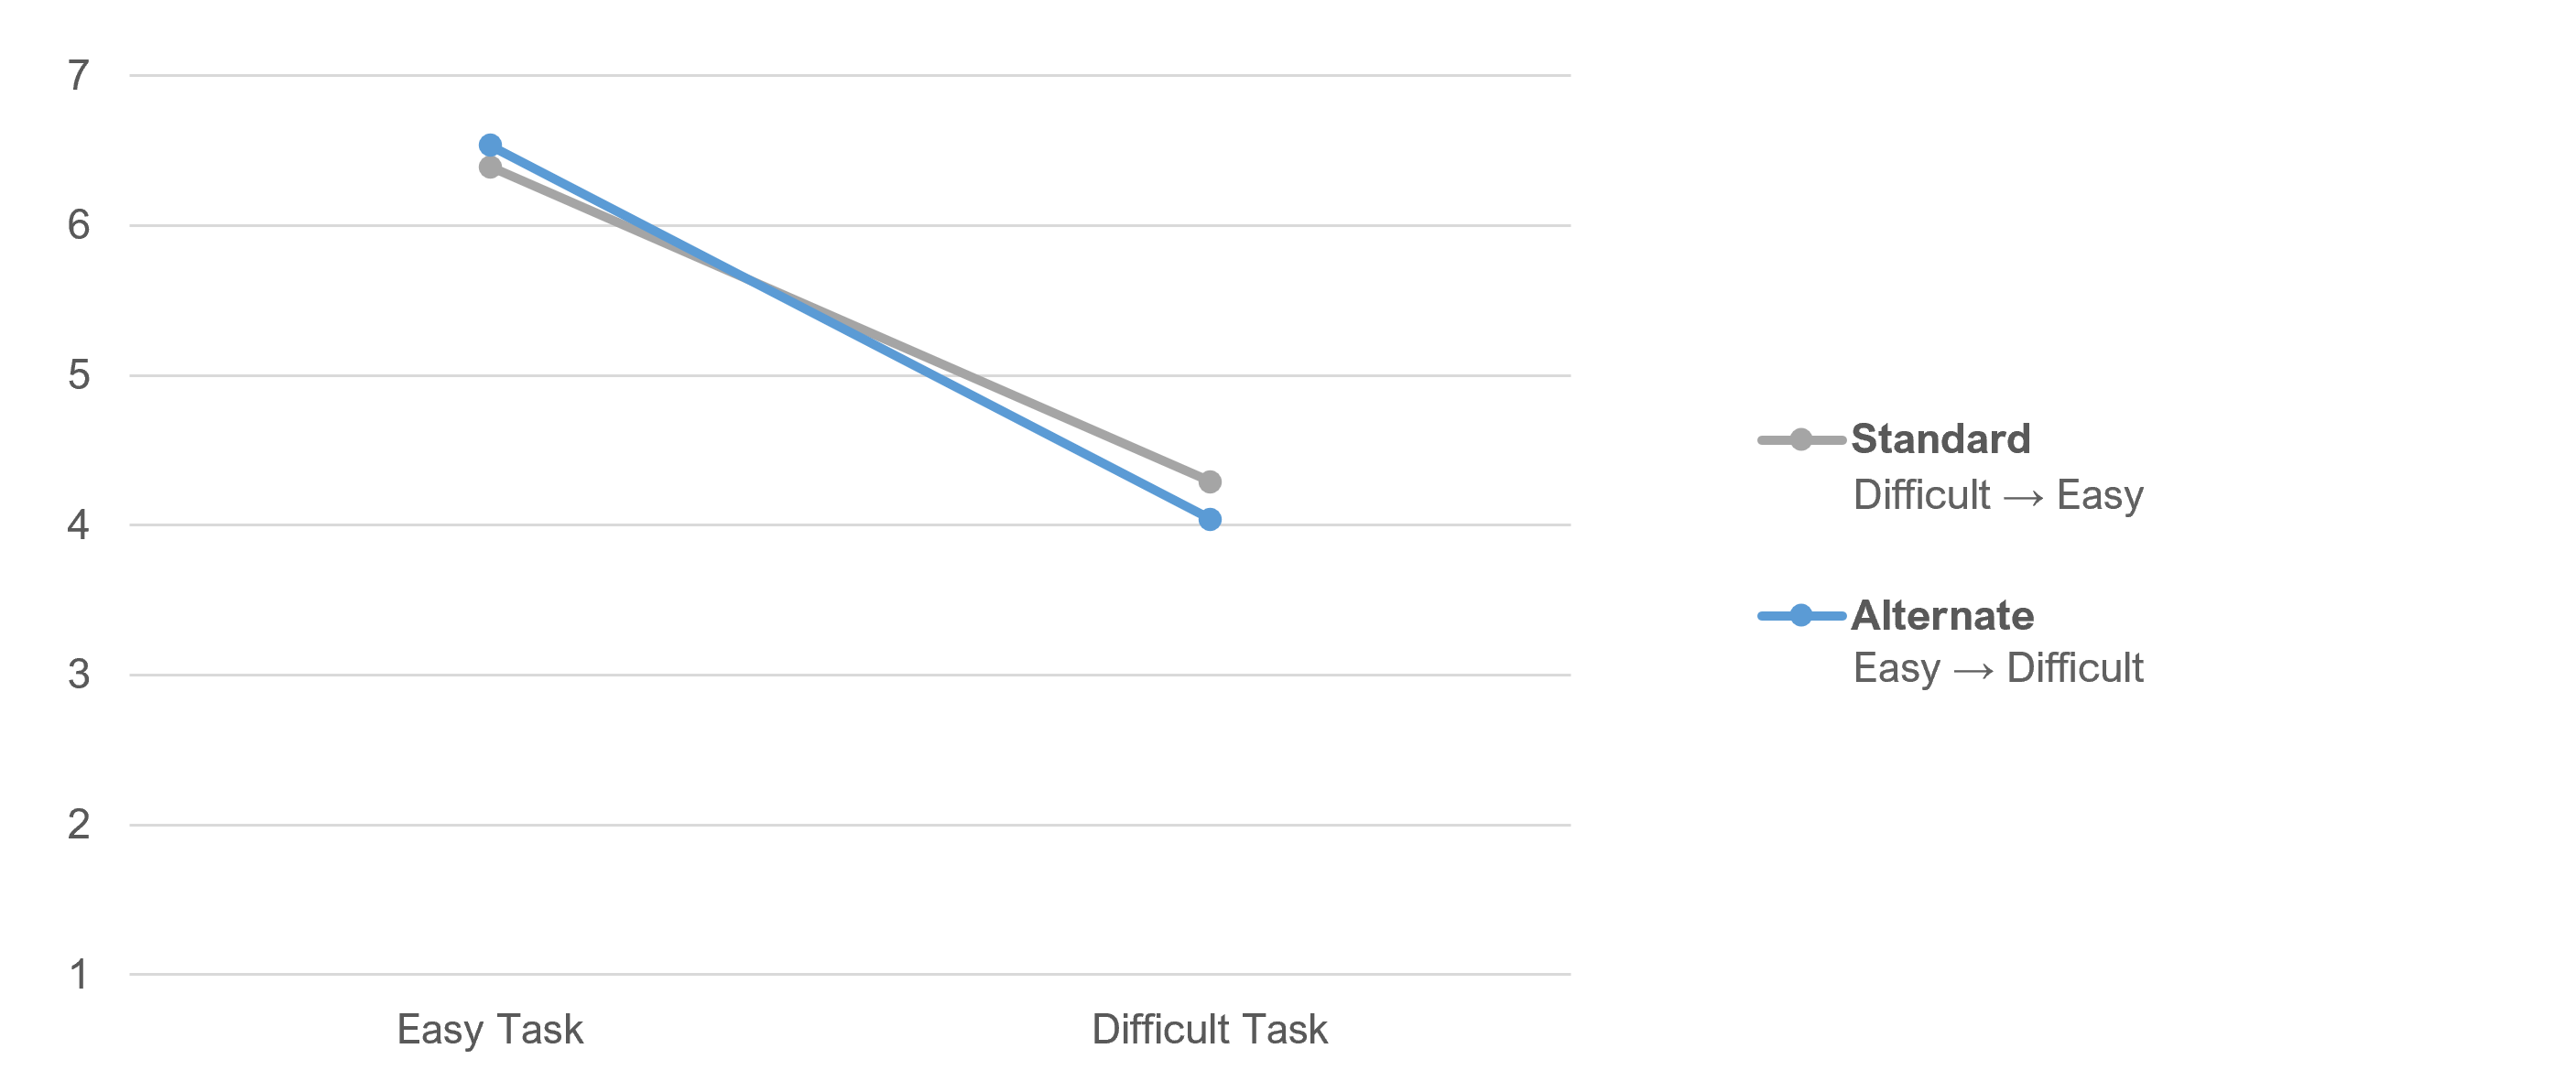
For the easy task, the alternate format had a slightly higher mean (d = .14, 2.4% of the range of the SEQ, t(299) = 1.05, p = .29, 95% confidence interval around difference ranged from −.12 to .41).
For the difficult task, the standard format had a slightly higher mean (d = −.25, 4.2% of the range of the SEQ, t(299) = 1.1, p = .27, 95% confidence interval around difference ranged from −.70 to .20).
To summarize, none of the SEQ differences due to item format were statistically significant. The overall difference was very small, with the standard slightly higher than the alternate format. When separately analyzed for easy and difficult tasks, the alternate was slightly higher for the easy task and slightly lower for the difficult task.
Were Results Different When Focusing on Participants’ First Tasks?
Inside every within-subjects experimental design is a between-subjects design defined by the first task experienced by the participants. Focusing on the first task results in the loss of half the data in this experiment, but enables analysis of the effects of interest without the possibility of asymmetric transfer from the first to the second task across the Greco-Latin experimental design.
Figure 5 shows the overall difference in SEQ means as a function of format for the first task participants experienced (half easy, half difficult). The difference was not statistically different (t(299) = .90, p = .37). The mean difference was .20 (standard higher), which corresponds to 3.3% of the range of the SEQ’s seven-point scale (with a 95% confidence interval around the mean ranging from −.23 to .63).

Figure 6 shows the interaction between item format and task difficulty. The pattern is similar to Figure 4 (all data), with higher scores and a smaller difference between formats for the easy task. The differences due to item format were not significant for either level of task difficulty.

For the easy task, the alternate format had a slightly higher mean (d = .04, 0.7% of the range of the SEQ, t(149) = .30, p = .76, 95% confidence interval around difference ranged from −.24 to .33).
For the difficult task, the standard format had a slightly higher mean (d = −.45, 7.6% of the range of the SEQ, t(148) = 1.4, p = .15, 95% confidence interval around difference ranged from −1.08 to .17).
Consistent with the within-subjects analyses, none of the SEQ differences due to item format were statistically significant. Nominally, the overall difference between subjects (.20, 3.3%) was a bit larger than within-subjects (.05, 0.8%), with a higher mean for the standard SEQ in both analyses. When separately analyzed for easy and difficult tasks, the alternate was again slightly higher for the easy task and lower for the difficult task.
Which Format Did Participants Prefer?
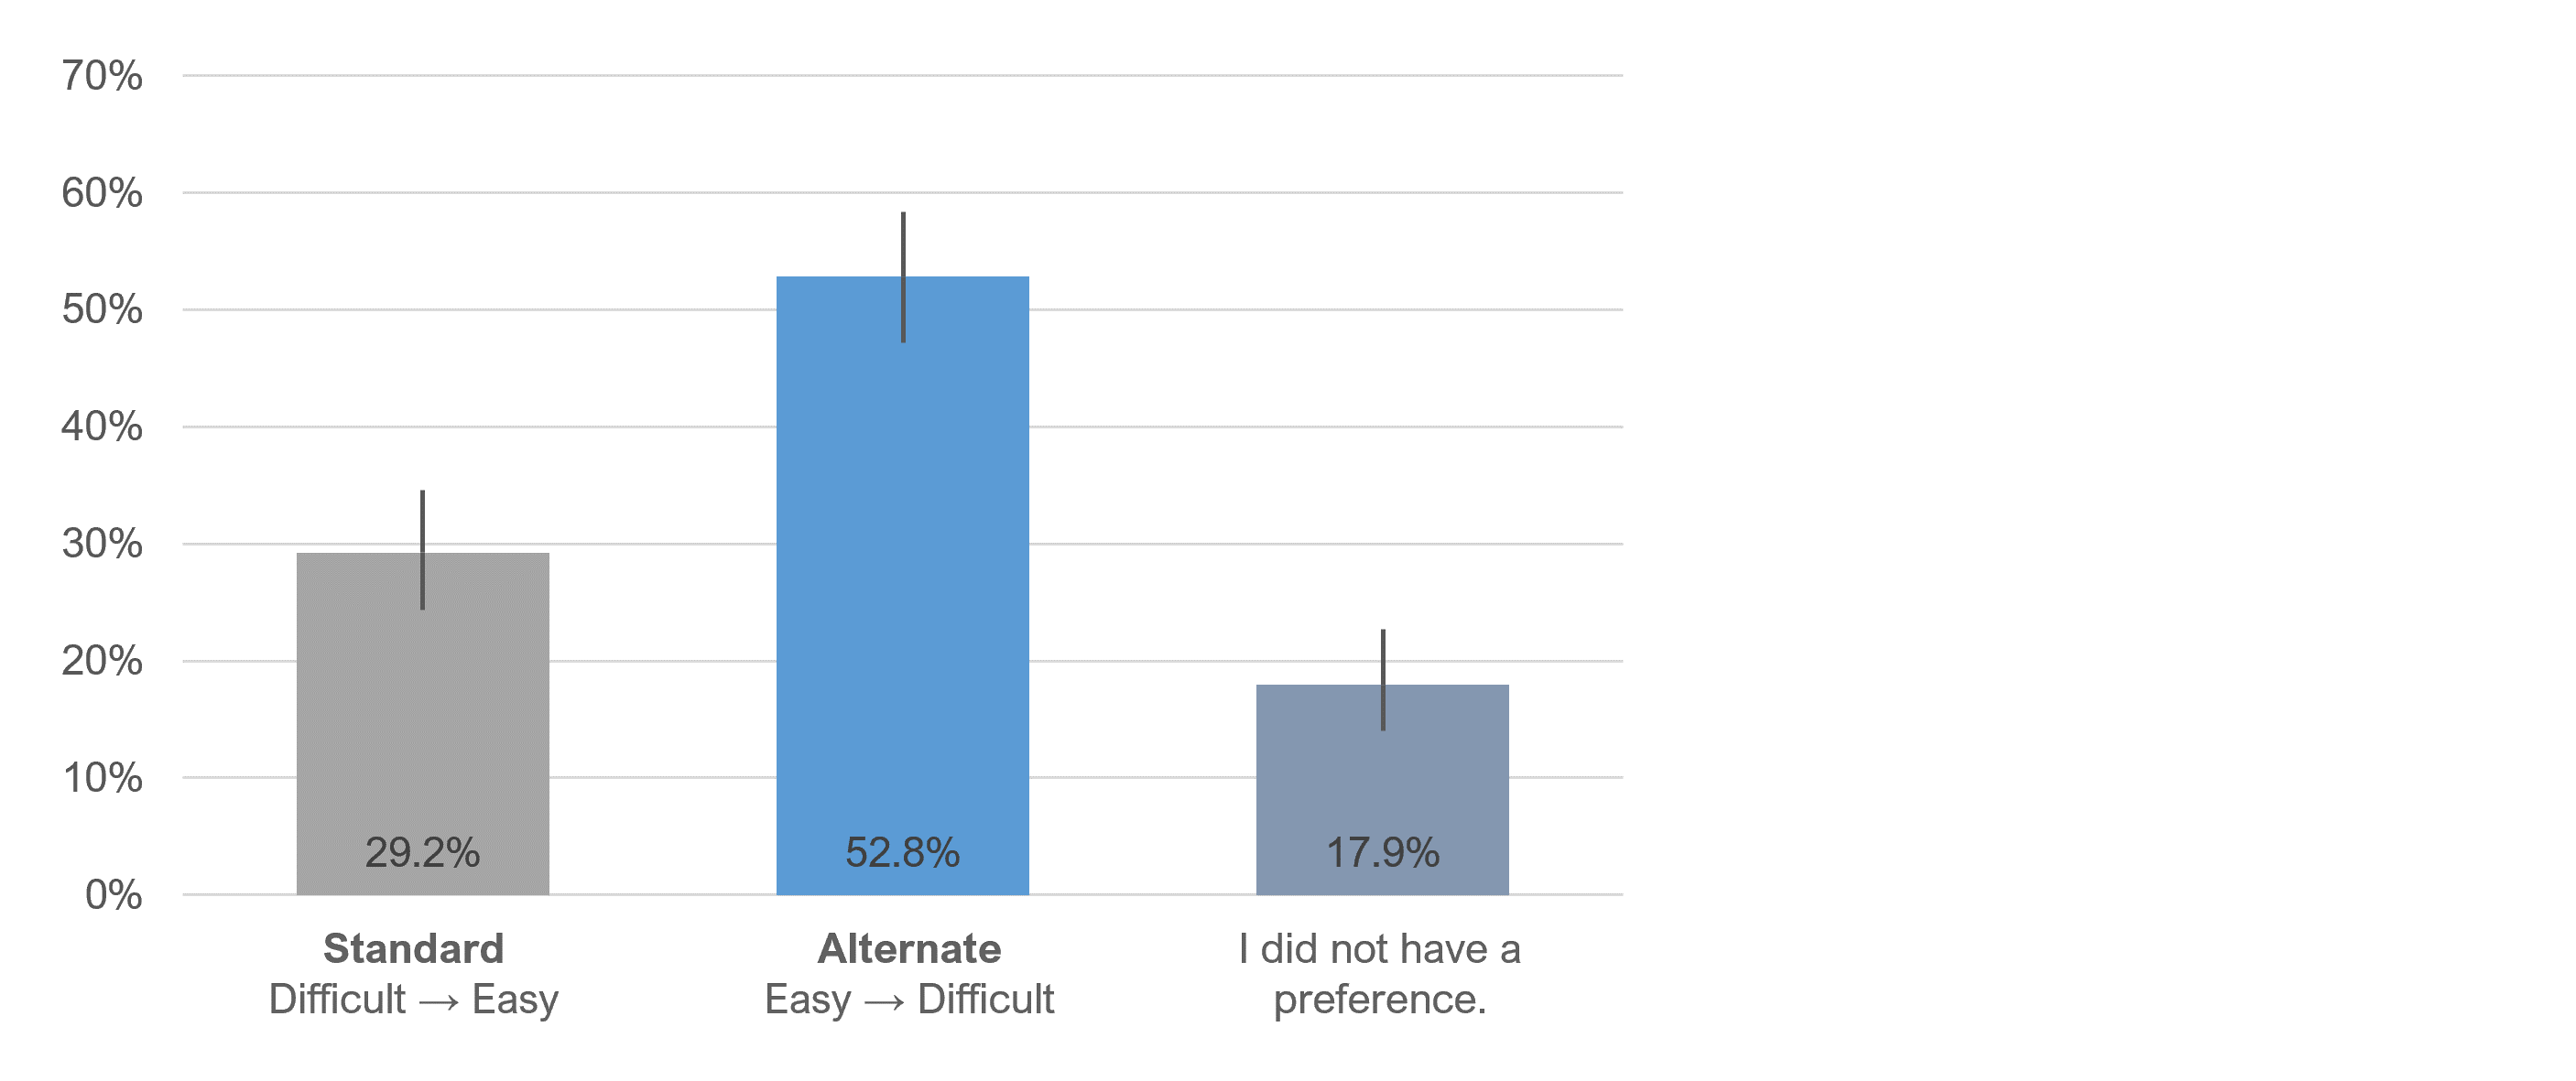
To our surprise, participants preferred the alternate to the standard SEQ format almost 2 to 1, as shown in Figure 7. Inspection of the 95% confidence intervals shows that the three percentages in Figure 7 are significantly different from one another (p < .05).
Comments from those favoring the standard format were that it made sense and was what they were used to seeing. For example,
“Going from very difficult to very easy seems more natural to me, that is, going from left to right where on the right the more positive response is listed.”
“I am way more used to seeing bad/negative/difficult on the left-hand part of the scale and easy/good/positive on the right. It just makes sense to me to do it like that.”
Comments from those favoring the alternate format were also that it made sense and was what they were used to seeing. For example,
“I think for English in general, left to right is the norm. Easy to hard is also the norm. So the choice I picked accommodates both of these in a logical and intuitive order.”
“That is just the order I expect it to go in and what I am used to.”
Summary and Takeaways
To explore the potential combined effects of left-side and acquiescence bias, we conducted a Greco-Latin study that varied the format of the SEQ (Standard: Very Difficult to Very Easy; Alternate: Very Easy to Very Difficult) and task difficulty (Easy and Difficult).
If the biases were present and of reasonable magnitude, we would expect them to inflate the SEQ means collected with the alternate format relative to those collected with the standard format.
What we found, however, was that the differences in SEQ format did not significantly or consistently affect SEQ means overall or when analyzed by task difficulty for either within- or between-subjects analyses.
Because participants in the experiment used both formats during the task sessions, we asked them which they preferred. By a ratio of almost 2 to 1, those who had a preference preferred the alternate format (Very Easy on the left).
We plan to follow up these mean analyses with analyses of the overall response distributions, including top- and bottom-box scores, to see whether we can find effects indicative of left-side or acquiescence bias on those metrics even though they were not apparent in the analyses of means.
Takeaway 1: UX practitioners who use the SEQ should continue using whichever format they have historically used because the difference in formats had no consistent effect on mean ratings.
Takeaway 2: UX practitioners who are planning to use the SEQ should use the standard format. Even though participants in this experiment preferred the alternate format, the format had no appreciable effect on mean ratings, and we know from experience that it is easier to communicate with stakeholders when higher numbers represent a better outcome.