 The standard deviation is the most common measure of variability. It’s less intuitive than measures of central tendency such as the mean, but it plays an essential role in analysis and sample size planning.
The standard deviation is a key ingredient when building a confidence interval and can be easily computed from a sample of data obtained in a study or survey. But for computing sample sizes when planning a study, you need the standard deviation (or a good estimate of it) before you collect data. It’s a bit of a chicken or egg problem because, in most UX research, if you had enough data to compute the standard deviation you probably wouldn’t need more data!
Fortunately, there are some good ways of estimating the standard deviation for sample size planning without having to collect a sample. For rating scale data, it’s possible that the same or very similar items have already been used in comparable contexts (one of the benefits of using standardized questionnaires).
For example, we have a solid estimate of the typical standard deviation of the System Usability Scale (SUS) based on data from thousands of people’s SUS scores across hundreds of datasets and contexts. In our article on the sample sizes for SUS scores, we showed how we settled on an estimated standard deviation of 17.7.
If you aren’t using a standardized questionnaire such as the SUS, are there alternatives? Fortunately, for rating scale data, there are four options: using binary data, using a fraction of the range, using analyses of known distributions (normal and uniform), and using published historical data.
In this article, we discuss the pros and cons of the first three approaches and contrast them with our published historical UX rating scale and UX questionnaire data to provide additional guidance for UX researchers. In an upcoming article, we’ll apply these approaches to compute sample sizes for rating scales.
Using Binary Data at Maximum Variance
When your study has a focus on binary data (e.g., task completion rates, purchase conversion rates), your sample size estimates should be based on binomial formulas. Unless you strongly expect very low or very high rates, you should assume a rate of 50% because that’s where binary data has maximum variance, which maximizes sample size estimations. This method essentially guarantees a sufficient sample size for UX research studies.
With these assumptions, we’ve published sample size estimation tables to make it easy to just look up the sample size you need. However, the standard deviation of binary data when assuming a rate of 50% (because of the coarseness of having only two equally likely values) is a lot higher than that for rating scale data, so the sample sizes in the tables are overly conservative (unnecessarily large) when your primary focus is on rating scales.
Using a Fraction of the Range
When data follow a normal curve, 95% of values fall within two standard deviations of the mean (two above and two below = four standard deviations). This is the basis for a common guideline for approximating the standard deviation—dividing the range of a scale by four. The risk in using this approach is that it assumes the distribution is roughly normal. When that is not the case, the actual standard deviation could be larger or smaller, depending on the shape of the distribution. Note that some researchers recommend dividing the range by five or six when distributions are not normal (and most UX rating scale distributions are not normal).
Estimating Based on Analysis of Normal and Uniform Distributions
One of the properties of rating scale data is that responses have boundaries. For example, on a five-point scale, you can’t rate higher than 5 or lower than 1. Some data, such as task-time data or monetary amounts, have lower bounds of 0 but no upper bound, making it harder, although not impossible, to estimate a standard deviation from the potentially infinite range.
With rating scale data, the standard deviations are correlated with the number of points—the more points, the higher the standard deviation. We can take advantage of these fixed boundaries to estimate the standard deviation if we also make some assumptions about the shapes of the distributions.
One attempt to do this comes from the Market Research literature. Iacobucci and Churchill (2022) published a table proposing likely ranges for the variances of rating scales (the standard deviation is just the square root of the variance). They based their estimates on the analysis of two well-defined distributions, normal and uniform. Table 1 shows their estimated standard deviations for rating scales with these distributions and various numbers of points, along with the standard deviation midway between the normal and uniform estimates.
| # of Points | SD Low (Normal) | SD Mid | SD High (Uniform) |
|---|---|---|---|
| 4 | 0.84 | 0.99 | 1.14 |
| 5 | 1.10 | 1.25 | 1.41 |
| 6 | 1.41 | 1.57 | 1.73 |
| 7 | 1.58 | 1.79 | 2.00 |
| 10 | 1.73 | 2.19 | 2.65 |
Table 1: Estimated standard deviations for normal and uniform distributions derived from Iacobucci & Churchill (2022).
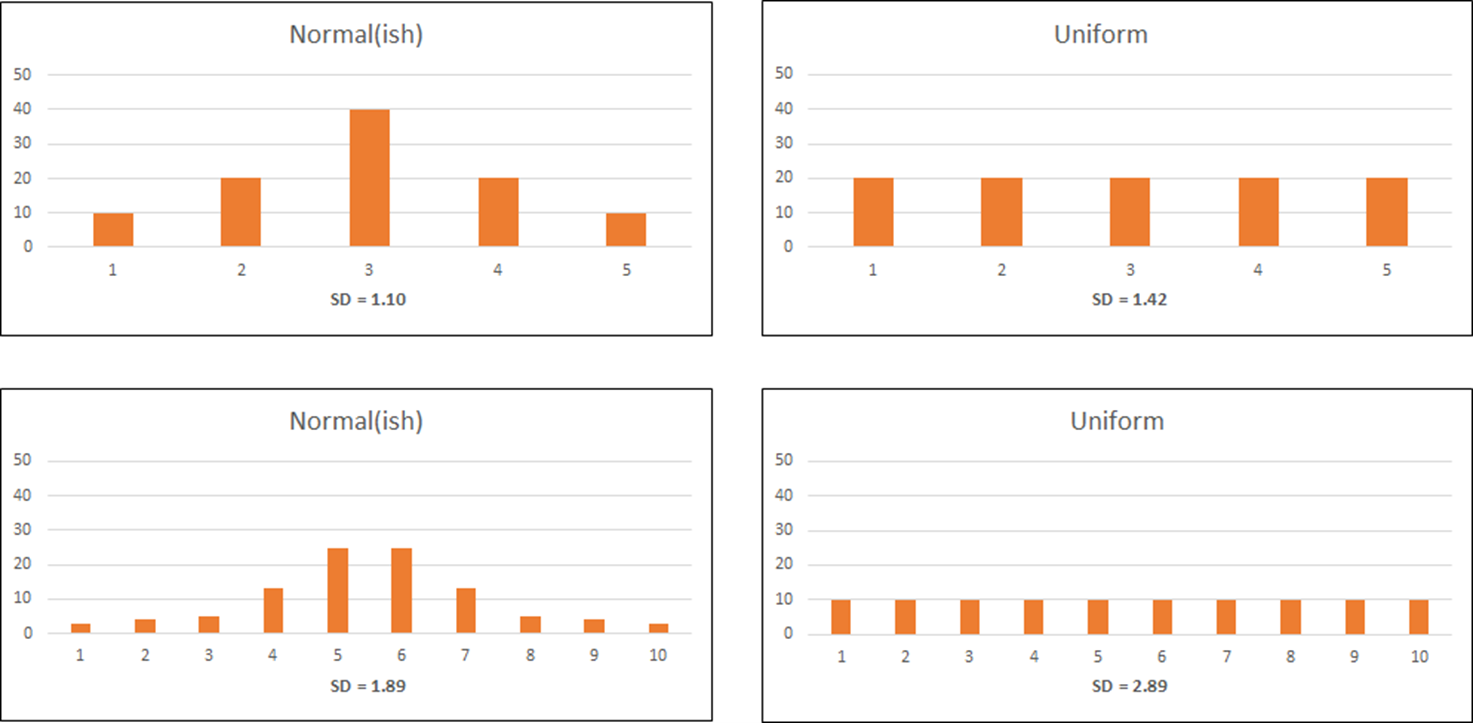
To check the values in Table 1, we set up hypothetical data for five- and ten-point scales for uniform and roughly normal distributions, shown in Figure 1.

As shown in Table 2, the standard deviations in Figure 1 correspond well with those in Table 1.
| Points | Distribution | Table 1 | Figure 1 | Difference |
|---|---|---|---|---|
| 5 | Normal | 1.10 | 1.10 | 0.00 |
| 5 | Uniform | 1.41 | 1.42 | 0.01 |
| 10 | Normal | 1.73 | 1.89 | 0.16 |
| 10 | Uniform | 2.65 | 2.89 | 0.24 |
Table 2: Correspondence of standard deviation estimates from Table 1 (Iacobucci & Churchill, 2022) and Figure 1.
The Iacobucci and Churchill estimates provide a starting point for UX researchers, but they did not include estimates for eleven-point scales (0 to 10) that are commonly used in UX and CX measures of behavioral intentions (e.g., Net Promoter Score, intent to purchase), so we set up hypothetical data to get our own estimates (Figure 2).

We were also curious about the relationship between Iacobucci and Churchill’s estimates for normal distributions and the guideline for dividing the range by 4, 5, or 6 to estimate standard deviations. Table 3 shows that dividing the range by 4 gives the closest estimate for four-, five-, six- and seven-point scales, but dividing by 5 works better for ten- and eleven-point scales. Note that the maximum possible range for rating scales is the difference between the maximum and minimum response options (e.g., for a five-point scale from 1–5, the maximum range is 4, and for a seven-point scale from −3 to +3, the maximum range is 6).
| # Points | Range | Normal SD | Range/4 | Range/5 | Range/6 | Normal— Range/4 | Normal— Range/5 | Normal— Range/6 |
||
|---|---|---|---|---|---|---|---|---|---|---|
| 4 | 3 | 0.84 | 0.75 | 0.60 | 0.50 | 0.09 | 0.24 | 0.34 | ||
| 5 | 4 | 1.10 | 1.00 | 0.80 | 0.67 | 0.10 | 0.30 | 0.43 | ||
| 6 | 5 | 1.41 | 1.25 | 1.00 | 0.83 | 0.16 | 0.41 | 0.58 | ||
| 7 | 6 | 1.58 | 1.50 | 1.20 | 1.00 | 0.08 | 0.38 | 0.58 | ||
| 10 | 9 | 1.73 | 2.25 | 1.80 | 1.50 | 0.52 | 0.07 | 0.23 | ||
| 11* | 10 | 2.10 | 2.50 | 2.00 | 1.67 | 0.40 | 0.10 | 0.43 |
Table 3: Correspondence of standard deviation estimates for normal distributions from Iacobucci and Churchill (2022) and fractions of a range (* indicates our estimate from the hypothetical eleven-point distribution in Figure 2).
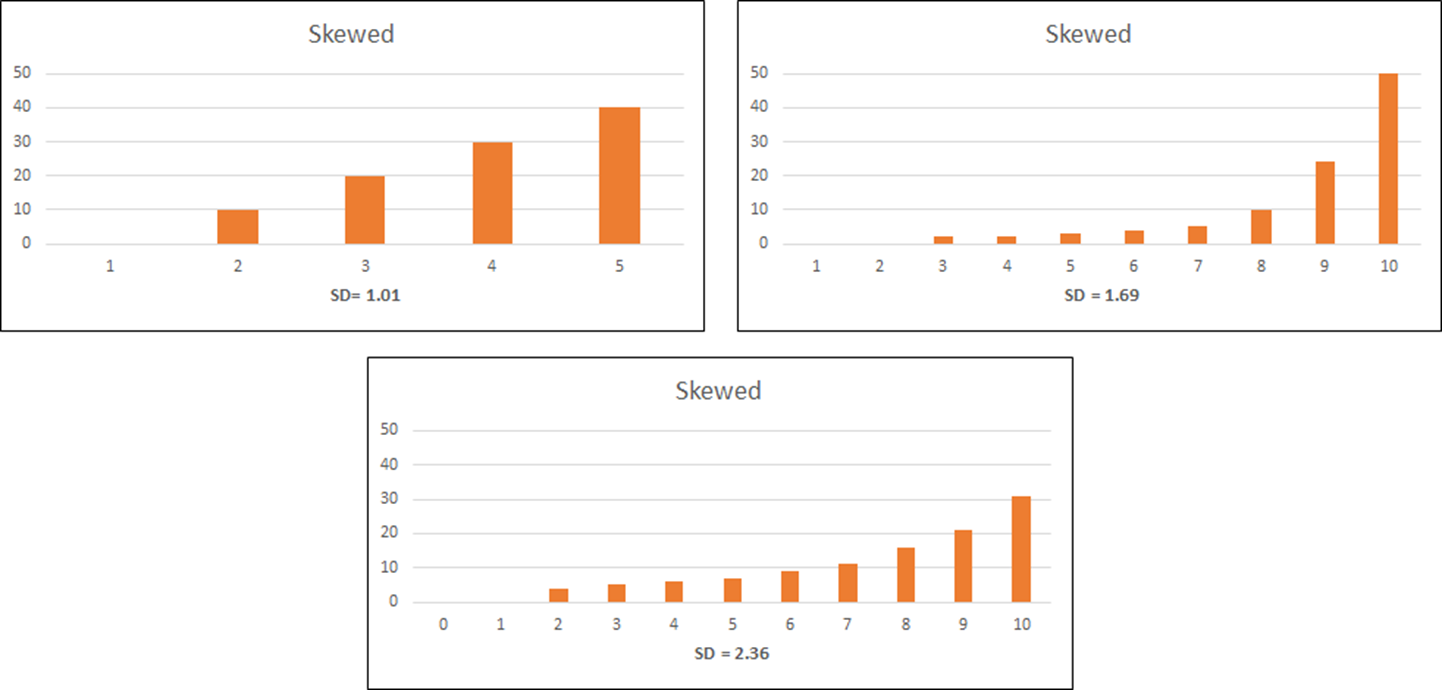
Iacobucci and Churchill did not provide estimates for the kind of skewed distributions that are much more common than uniform or normal distributions in UX research. That’s understandable because, unlike uniform and normal distributions, there are many different types of skewed distributions. No matter the type, we can anticipate that standard deviations for the kind of skewed distributions we usually see in UX research can be different from those for normal distributions. For example, in Figure 3, the skewed distributions for five- and ten-point scales have smaller standard deviations than the Iacobucci and Churchill estimates for normal distributions (8.2% smaller for the five-point scale; 2.3% smaller for the ten-point scale), but for our sample eleven-point scale it’s 12.4% larger.

Fortunately, because we’re in the business of collecting UX and CX data, we have a trove of five-, seven-, and eleven-point distributions from our research that we analyzed to provide more targeted guidance for UX researchers.
Using Historical UX Rating Scale and Questionnaire Data
When the data are available, the best approach is to use historical data for metrics collected in the same or similar context. In an earlier article, we described the large dataset we created by aggregating data from five-, seven-, and eleven-point items collected in common UX research scenarios (4,048 items).
We found the average standard deviation was roughly 25% of the range of the scale for the five-, seven-, and eleven-point items we analyzed (Table 4). A lower quartile (25th percentile) estimate of standard deviations was about 20% of the range for eleven-point scales. An upper quartile (75th percentile) estimate was roughly 28% of the range for five-point scales, making that a reasonable estimate for items expected to have larger-than-normal standard deviations.
| Points | Mean | Median | Mean % of Max Range | 25th | 25th %ile of Max Range | 75th | 75th %ile of Max Range |
|---|---|---|---|---|---|---|---|
| 5 | 1.01 | 0.960 | 25.3% | 0.824 | 21% | 1.125 | 28% |
| 7 | 1.46 | 1.479 | 24.3% | 1.274 | 21% | 1.614 | 27% |
| 11 | 2.39 | 2.295 | 23.9% | 2.007 | 20% | 2.634 | 26% |
Table 4: Percentages of scale ranges for mean, 25th percentile, and 75th percentile standard deviations.
Table 5 shows the correspondence between our estimates of standard deviations for UX-related five-, seven-, and eleven-point items and the various schemes that have been suggested for taking a fraction of the range to estimate standard deviations. For five- and eleven-point items, the closest correspondence was achieved when dividing the range by 4, even though the distributions were not normal. For seven-point items, dividing by either 4 or 5 achieved about the same correspondence.
| # Points | Range | UX SD | % of Max Range | Range/4 | Range/5 | Range/6 | UX SD— Range/4 | UX SD— Range/5 | UX SD— Range/6 |
||
|---|---|---|---|---|---|---|---|---|---|---|---|
| 5 | 4 | 0.960 | 24% | 1.00 | 0.80 | 0.67 | 0.03 | 0.17 | 0.30 | ||
| 7 | 6 | 1.479 | 25% | 1.50 | 1.20 | 1.00 | 0.17 | 0.13 | 0.33 | ||
| 11 | 10 | 2.295 | 23% | 2.50 | 2.00 | 1.67 | 0.18 | 0.32 | 0.65 |
Table 5: Correspondence of our estimates of standard deviations for UX-related five-, seven-, and eleven-point items with various fractions of the scale ranges.
Table 6 shows the results of similar analyses that we published for standardized UX questionnaires. All multi-item questionnaires we analyzed, even those with only two items, had standard deviations that were smaller than the five-, seven-, and seven-point items in Table 4. We found the standard deviation for these questionnaires as a percent of the maximum score range varied from a low of 9% to a high of 22%, with a median across questionnaires of 19%. Except for the SUPR-Qm, the only questionnaire in this group developed using Rasch analysis, the closest rule for estimating unknown standard deviations for these standardized questionnaires is to divide the maximum range by 5.
| Standardized Questionnaire | Max Range | Mean | Median | % of Max Range | 25th %ile | 25th %ile Over Max Range | 75th %ile | 75th %ile Over Max Range |
|---|---|---|---|---|---|---|---|---|
| CSUQ | 100 | 20.6 | 21.0 | 21% | 19.03 | 19% | 21.87 | 22% |
| SUS | 100 | 17.5 | 17.0 | 17% | 15.63 | 16% | 18.88 | 19% |
| SUPR-Q | 4 | 0.7 | 0.7 | 17% | 0.57 | 14% | 0.74 | 18% |
| UMUX | 100 | 21.9 | 22.4 | 22% | 21.40 | 21% | 23.30 | 23% |
| UMUX-Lite | 100 | 21.9 | 22.1 | 22% | 20.88 | 21% | 24.03 | 24% |
| UX-Lite | 100 | 19.3 | 19.3 | 19% | 16.61 | 17% | 21.27 | 21% |
| SUPR-Qm | 4 | 0.4 | 0.4 | 9% | 0.30 | 7% | 0.41 | 10% |
Table 6: Standard deviations for seven standardized UX questionnaires showing the percentage of standard deviations divided by the maximum range of the scales.
Summary and Discussion
We reviewed three methods for estimating unknown standard deviations of rating scales:
- Binary data at maximum variance: A simple method that guarantees an adequate sample size but is likely to be larger than needed when the primary research focus is on rating scales.
- Fraction of the range: Given a normal distribution, dividing the range by 4 is a common rule for estimating unknown variances (but UX data is rarely normal), and there is not a firm consensus in the literature on whether dividing by 4, 5, or 6 produces more accurate estimates.
- Normal and uniform distributions: These are well-known distributions, making it relatively easy to determine likely standard deviations, but UX data are rarely normal and almost never uniform.
Comparison of these methods with analyses of a large historical dataset of five-, seven-, and eleven-point items used in CX and UX research results in several takeaways:
It’s OK if you don’t have historical data (but it’s better if you do). In the absence of historical data, there are some reasonable general guidelines based on the number of rating scale points and types of distributions. For the most part, however, we expect the distributions of UX rating scale responses to be skewed rather than normal (and never expect a uniform distribution). Because the widely known guidelines (e.g., Iacobucci & Churchill, 2022) do not assume skewed distributions, UX researchers should ideally keep track of the standard deviations of their metrics so they can use them when estimating sample sizes for future research.
Of various proposed fractions of scale ranges to estimate standard deviations, dividing by 4 worked reasonably well for single UX items. Dividing by 4 worked best for five- and eleven-point items and worked reasonably well for seven-point items. Dividing by 6 consistently underestimated the standard deviations of UX items, which would lead to an underestimation of sample size requirements, which would, in turn, lead to underpowered studies (so we don’t recommend it).
For most standardized UX questionnaires, dividing the maximum range by 5 is a reasonable guideline. The exception was the SUPR-Qm, which was developed with Rasch analysis rather than classical test theory, so it has a relatively large number of items focused on a single construct, which may be why its standard deviation is so much smaller than the others.
Rather than using a general guideline, UX researchers can use our sample estimates. It’s fine to use “divide by 4 for items” and “divide by 5 for multi-item questionnaires” for quick estimates of standard deviations, but for more precise estimates of unknown standard deviations, we encourage UX researchers to use the results of our large sample analyses.
Future direction: In future articles, we’ll use these standard deviations to build sample size tables for different point rating scales and contrast them with binary, NPS, and SUS estimates.


