 In an earlier article, we examined a large dataset of rating scale data. After analyzing over 100,000 individual responses from 4,048 multipoint items across 25 studies, we reported the typical standard deviations for five-, seven-, and eleven-point items.
We found that the average standard deviation tended to be around 25% of the maximum range of the scale for these multipoint items (Table 1). For example, a typical five-point item (with a range of four points) had a standard deviation of 1 (25% of max range). The 25th percentile (a smaller-than-average standard deviation) was about 21% of the range, and the 75th percentile (a larger-than-average standard deviation) was 28% of the range. These percentages tended to be just a bit lower for items with more points.
| Mean | 25th Percentile | 75th Percentile |
|---|---|---|
| 25% | 20% | 28% |
Table 1: Typical percentages of standard deviations divided by maximum scale range for single items.
We did that analysis on single items. It’s quite common, however, for UX and CX surveys to use multi-item questionnaires, especially standardized questionnaires, which tend to have more desirable psychometric properties. Multi-item questionnaires tend to be less variable and more reliable than single-item questions: the redundancy in questions provides both more points of discrimination and additional items to converge on an abstract construct such as “ease.”
In this article, we’ll look at the variability and reliability of seven commonly used standardized UX questionnaires and their implications for sample-size calculations.
Seven Standardized Questionnaires
Similar to our investigation of single items, we analyzed data collected across 25 surveys and UX studies that included seven multi-item standardized questionnaires.
Table 2 shows the questionnaires, the number of items, how many constructs/factors they measure, their item tone, the number of points per item, and the maximum range of the overall scale.
| Questionnaire | Points | ||||
|---|---|---|---|---|---|
| CSUQ | 7 | ||||
| SUS | 101 | ||||
| SUPR-Q® | 5 | ||||
| UMUX | 101 | ||||
| UMUX-Lite | 101 | ||||
| UX-Lite™ | 101 | ||||
| SUPR-Qm® | 5 |
Table 2: Key characteristics of seven standardized UX questionnaires with links to more scale info. * The SUPR-Q includes seven five-point items and one eleven-point item (0–10, divided by 2), typically reported as a percentile from 0 to 100%, but for these analyses, we used the raw score.
Standard Deviations
Table 3 shows the standard deviations as a percent of the range for the seven standardized questionnaires. The differences between the mean and median standard deviations were trivial so either can be used as a measure of the average. The average standard deviation (mean or median) ranges across questionnaires from a low of 9% for the SUPR-Qm to a high of 22% for the UMUX/UMUX-Lite. The unusually low variability for the SUPR-Qm is is because of its being a one-factor measure with sixteen positive-tone five-point items selected with Rasch analysis. In contrast, the UMUX has only four seven-point items—two with negative tone—measuring two constructs. The UX-Lite has remarkably low variability given its two items that, with one item each, measure the constructs of perceived ease and perceived usefulness (plus its demonstrated ability to map to future tech usage).
| Standardized Questionnaire | Max Range | Mean | Median | % of Max Range | 25th %ile | 25th %ile Over Max Range | 75th %ile | 75th %ile Over Max Range | Number of Datasets |
|---|---|---|---|---|---|---|---|---|---|
| CSUQ | 100 | 20.6 | 21.0 | 21% | 19.03 | 21.87 | |||
| SUS | 100 | 17.5 | 17.0 | 17% | 15.63 | 18.88 | |||
| SUPR-Q | 4 | 0.7 | 0.7 | 17% | 0.57 | 0.74 | |||
| UMUX | 100 | 21.9 | 22.4 | 22% | 21.40 | 23.30 | |||
| UMUX-Lite | 100 | 21.9 | 22.1 | 22% | 20.88 | 24.03 | |||
| UX-Lite | 100 | 19.3 | 19.3 | 19% | 16.61 | 21.27 | |||
| SUPR-Qm | 4 | 0.4 | 0.4 | 9% | 0.30 | 0.41 |
Table 3: Standard deviations for seven standardized UX questionnaires showing percentage of standard deviation divided by the maximum range of the scales.
Given the ranges we see in the standard deviations, it’s hard to create a simple guideline as we did with single-item scales. However, one clear takeaway is that even the highest mean or median standard deviation (the UMUX at 22%) is lower than the mean or median standard deviation for single items. The distribution is also tighter, as the 25th and 75th percentiles are closer to the average at 21% and 24% respectively. The difference is even greater when compared with the median values of the seven questionnaires (see Table 4).
| Type | Max Range | Max Range |
|
|---|---|---|---|
| Single Item | |||
| Standardized Multiple Items (highest values) | |||
| Standardized Multiple Items (median values) |
Table 4: Standard deviation percentage of maximum range for single items, multiple items (highest values across questionnaires), and multiple items (median values across questionnaires). * Because the differences between means and medians in Table 3 were trivial, we refer to both as the average.
Reliability (Coefficient Alpha)
Lower variability at the item level is associated with higher reliability at the multi-item scale level. As shown in Figure 1, the most common measure of a questionnaire’s reliability is coefficient alpha (also called Cronbach’s alpha after its developer), which specifically assesses the internal consistency of a standardized multi-item metric with a computation based on the number of items (k), the sum of the variability of each item (numerator of the last ratio in Figure 1), and the variability of the sum of the items (denominator of the last ratio in Figure 1).
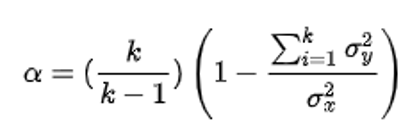
Figure 1: Formula for coefficient alpha.
Coefficient alpha measures how consistently participants respond to a set of items. You can think of it as a sort of average of the correlations between items. When items are positively correlated, the sum of their individual variances will be smaller than the variance of their sum, increasing reliability. Coefficient alpha ranges from 0.0 to 1.0 (a negative alpha means you probably need to reverse some items that have negative correlations, usually due to negative tone). Since the late 1960s, the minimally acceptable measure of reliability for research purposes has been 0.70.
When the items in a multi-item scale correlate with one another, the more internally reliable the instrument (when the items are uncorrelated, coefficient alpha will be 0). One way to increase low reliability is to add more related items to your questionnaire. However, this needs to be balanced with the goal of having no more items than necessary for efficient measurement.
Table 5 shows that for these seven questionnaires, the reliability ranges from a low of .75 for the two-item UX-Lite to a high of .97 for the sixteen-item CSUQ, so the reliabilities of all seven questionnaires exceed the typical minimum criterion of 0.70, even for the questionnaires with just two items. As expected, the correlation between the number of items in a questionnaire and its reliability is high and statistically significant (r(5) = .90, p < .01).
| Questionnaire | Alpha | (By Person) |
||
|---|---|---|---|---|
| CSUQ | ||||
| SUS | ||||
| SUPR-Q | ||||
| UMUX | ||||
| UMUX-Lite | ||||
| UX-Lite | ||||
| SUPR-Qm |
Table 5: Reliabilities of seven standardized UX questionnaires.
Impact on Sample Size Planning
As shown in Figure 2, the standard deviation (s) of a metric is a direct driver of sample size requirements (n) of a specified difference (d) and level of confidence (t) for a confidence interval. This is also the case for the somewhat more complex applications of testing against a benchmark or comparing two means. All other things being equal, the larger the standard deviation, the larger the sample size requirement. UX researchers can use our historical estimates of the standard deviations of these questionnaires when planning sample sizes for research studies.

Figure 2: Formula to estimate the sample size requirement for a confidence interval.
The relationship between reliability and sample size requirement is less direct, but in general with all other things being equal, metrics with higher reliability have lower sample size requirements. For these seven questionnaires, the correlation between standard deviation and reliability was −0.37 (negative because lower standard deviations were associated with higher reliability). Using Cohen’s guidelines for interpreting the strength of correlation, this would be a medium effect, but with just seven data points, the sample size is too small to support a claim of statistical significance.
Discussion and Summary
Our analysis of seven standardized UX questionnaires collected across 25 surveys and UX studies found
The typical standard deviation of these questionnaires is about 19% of the maximum scale range. The median percentage of standard deviation over maximum scale range varied from a low of 9% for the SUPR-Qm (16 items measuring one construct) to a high of 22% for the UMUX (four items measuring two constructs). The UX-Lite standard deviation percentage was 19% (two items measuring two constructs).
Multi-item UX questionnaires have lower variability than single UX items. Even the highest median estimates of the percentage of maximum scale range were lower than corresponding estimates for single items. The difference between single- and multi-item variability is even greater when compared with the median values of the seven questionnaires.
All seven UX questionnaires have acceptable levels of scale reliability. Estimates of scale reliability all exceeded the usual research criterion of .70, ranging from .75 for the UX-Lite (two five-point items) to .97 for the CSUQ (sixteen seven-point items).
There is a strong correlation between the number of items and scale reliability. Consistent with psychometric theory, the UX questionnaires with more items had higher reliability (r(5) = .90, p < .01).
Low variability and high reliability lead to lower sample size requirements. From the formulas used to estimate sample size requirements (n), it’s easy to see how smaller variability contributes to smaller estimates of n. The relationship between reliability and sample size requirements is less direct, but metrics with higher reliability also reduce sample size requirements.
Limitations: Our sample sizes in these analyses were large, but we took the samples from just 25 surveys. A larger number of more diverse datasets would provide higher confidence in the observed range of standard deviations and reliabilities, but we would expect only minor deviations from our current findings.
Main takeaways: UX researchers can use our historical estimates of the standard deviations of these seven UX questionnaires when planning sample sizes for research studies. When appropriate, use standardized UX questionnaires in your research due to their known properties and psychometric validation.


