 In 2020–2021, lockdowns and limits on social gatherings during the global pandemic forced the cancellation of sporting events, concerts, theatrical performances, and more.
Now, the live events industry has re-emerged even stronger than before, as fans are eager to return to their favorite venues and stadiums. Even though the average cost of tickets has increased by 10%, Live Nation reports a 40% increase in revenue from ticket sales in Q2 2022 compared to 2019. It seems that people prefer to spend money on experiences amidst rising inflation, leaving live events such as sports less impacted than other sectors.
Attending a live event often starts with searching for and purchasing tickets online. We sought to understand how enjoyable the online ticketing experience is for fans by collecting UX benchmark data from several of the leading ticketing websites.
We collected data on a variety of attitudes and intentions toward five ticketing websites:
- AXS
- SeatGeek
- StubHub
- Ticketmaster
- Vivid Seats
We computed SUPR-Q® and Net Promoter scores, investigated reasons for using the websites, measured users’ attitudes regarding their experiences, conducted key driver analyses, and analyzed reported usability problems.
Benchmark Study Details
In June 2022, we asked 234 users of ticketing websites in the U.S. to recall their experience and their perceptions of one of the listed online ticketing sites on their desktop and mobile (app and/or website) in the past year.
Participants completed the eight-item SUPR-Q (which includes the Net Promoter Score) and two-item UX-Lite™ standardized questionnaires and answered questions about their brand attitudes, usage, and prior experiences.
Quality of the Ticketing Website UX: SUPR-Q
The SUPR-Q is a standardized questionnaire that is widely used for measuring attitudes toward the quality of a website user experience. Its norms are computed from a rolling database of around 200 websites across dozens of industries.
SUPR-Q scores are percentile ranks that tell you how a website’s experience ranks relative to the other websites (50th percentile is average). The SUPR-Q provides an overall score as well as detailed scores for subdimensions of Usability, Trust, Appearance, and Loyalty.
The ticketing websites in this study collectively averaged at the 55th percentile. SeatGeek received the highest SUPR-Q score at the 76th percentile, and Vivid Seats scored the lowest at the 32nd percentile.
Usability Scores and Trust
We asked participants to rate how easy they thought it was to use and navigate through the websites. SeatGeek had the highest usability score (76th percentile), and StubHub had the lowest (41st percentile). Comments about StubHub’s usability included
- “The layout of events from the front page is pretty terrible, and specific events take a long time to load when site traffic is high, sometimes costing me a chance to get a ticket.”
- “I found the site to be pretty ugly and a pain to navigate. The way of looking through shows by scrolling one row is just wasting my time. Just let me look at a full page of events rather than just one row.”
- “Sometimes it gets confused at locations and will show me events that I’m not interested in.”
We also asked participants to rate the trust and credibility of the ticketing websites. Trust scores were similar to the usability scores. AXS had the highest trust score (79th percentile) with SeatGeek close behind (78th percentile). Vivid Seats had the lowest trust score (24th percentile). Judging from respondents’ feedback, this may be related to users’ experiences with high fees and fraudulent tickets. Comments about Vivid Seats included
- “Scammers use Vivid Seats and I know people [who] have been scammed on there.”
- “I feel like most of the tickets are resell and I don’t trust their authenticity and don’t know how to find whether or not they can be trusted.”
- “Buying a ticket for parking when the place said it was sold out, for an exuberant fee and later finding out at the location that they weren’t sold out and were still selling spaces for far cheaper than I paid.”
More verbatim comments are available in the downloadable report.
Loyalty/Net Promoter Scores
The average NPS for the ticketing websites was 0% (roughly equivalent numbers of promoters and detractors), ranging from −23% for Vivid Seats to 17% for SeatGeek. In general, a better user experience is a good predictor of customer loyalty.
Websites and Mobile App Usage
As a part of this benchmark, we asked participants how they accessed the online ticketing services. All participants reported using their desktop/laptop computers (this was a requirement for participation in the survey), with 50% using mobile apps and 75% using mobile websites.
The typical frequency of use was a few times a year for desktop and mobile websites (on average, about 3% reported daily use on desktop, and only 2% reported similar use on the mobile website). For those who reported mobile app use, the typical frequency of use was also a few times a year. AXS was the most frequently used mobile app (overall usage of 70%).
Usage patterns were roughly equivalent for all ticketing websites, with an average of 71% of users going to ticketing websites to check ticket prices and 67% purchasing tickets to an event. Other reasons for visiting ticketing websites include searching for events by city/region (35%), searching for events by venue (33%), searching for events by date (19%), accessing tickets (11%), selling tickets (5%), and refunding tickets (1%).
Key Drivers of the Ticketing Experience
To better understand what affects SUPR-Q scores and Likelihood-to-Recommend (LTR) ratings, we asked respondents to rate the following attributes of the ticketing websites on a five-point scale from 1 (Strongly disagree) to 5 (Strongly agree). We conducted key driver analyses (regression modeling) to quantify the extent to which ratings on these items drive (account for) variation in overall SUPR-Q scores and, separately, LTR (the rating from which the NPS is derived).
- It’s easy to pick seats.
- It’s easy to see what seats are available.
- It’s easy to see the seats on a map.
- It’s easy to filter for seat types.
- The site shows me when a seat is a good value.
- The fees on the site are fair.
- The fees on the site are transparent.
- The refund policy on the site is clear.
- The site allows me to save events to look at later.
- Ability to pair with music app to receive upcoming concert notifications.
- The site allows me to resell tickets.
- The site provides useful customer support.
- The site has the ability to search for events by date.
- The site has the ability to search for events by city/area.
- The site has the ability to search for events by venue.
SUPR-Q Drivers. As shown in Figure 1, the top key drivers from the list above were “The site has the ability to search for events by city/area” and “The site provides useful customer support” (respectively accounting for 12% and 10% of SUPR-Q variation). Other significant key drivers included “The fees on the site are fair” and “It’s easy to see what seats are available” (each at 9% of variation).
LTR Drivers. At a high level, the top key driver of likelihood-to-recommend (LTR, the basis of the NPS) was brand attitude (33%), followed by “the website’s features meet my needs” (20%). At a lower level, using the same set of predictors as in the SUPR-Q KDA, the top key drivers were “It’s easy to see what seats are available” (13%) and “The site provides useful customer support” (12%).

Best and Worst: Key Drivers
It’s Possible to Search for Events by City/Area
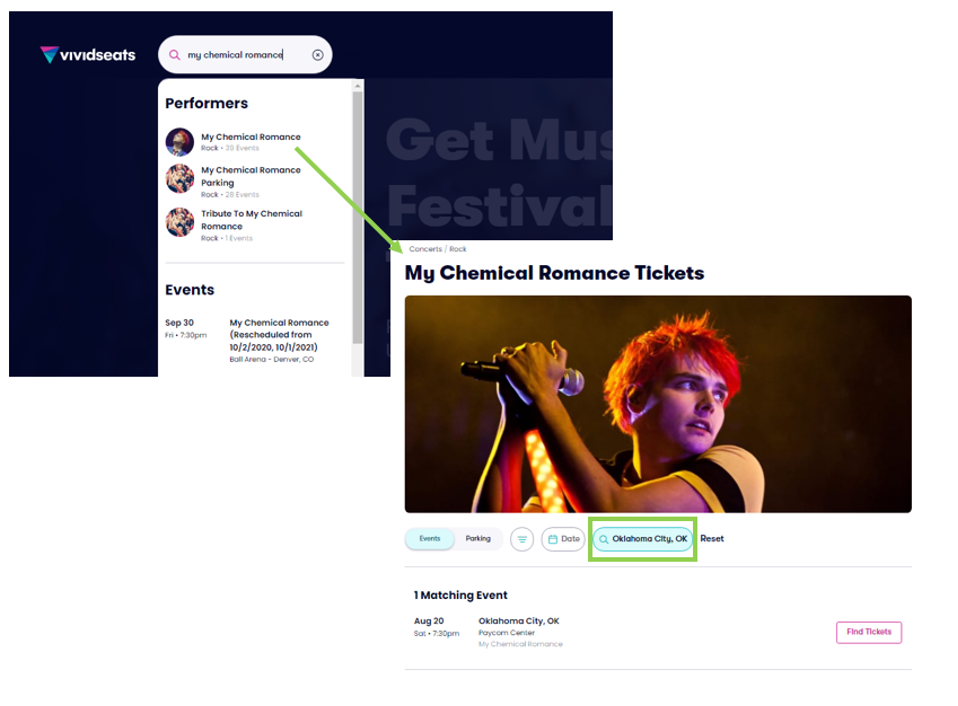
Participants were asked to rate their experience when searching for events by city or area. AXS had the highest percentage of participants who selected Strongly Agree, with a top-box score of 68%. Vivid Seats had the lowest percentage, with only 34% of participants strongly agreeing. This difference of 34% can likely be attributed to the discoverability of location on the websites’ homepages. When viewing AXS’s homepage, the location is both evident and changeable directly from the main search box. However, on the Vivid Seats website, you can change the location only after you’ve searched for an event. The ability to see and change city/area on the homepage is a key factor in this metric. Figures 2 and 3 show location visibility for AXS and Vivid Seats respectively.

The Fees on the Site are Fair
Participants were asked to rate their agreement with the following statement: The fees on the site are fair. According to our driver analysis, fair fees are viewed as an important driver of quality for ticketing websites; however, all sites performed poorly on this metric (participants strongly agreed with this statement only 16% of the time on the high end and 3% on the low end). High fees caused frustration for many participants across all ticketing platforms (see the “What to Improve” section below).
We compared fees across ticketing websites by searching for resale tickets to the same event located in the same section of the venue. Each website had a different checkout process and showed the additional fees at different steps in that process. For example, AXS showed fees the earliest (right after seat selection) and SeatGeek showed fees the latest (after entering credit card information). The fees also varied amongst ticketing sites, with Ticketmaster having the highest total combined taxes and fees (Figure 4) and AXS having the lowest additional fees (Figure 5). Table 1 shows the prices and fees across all five websites.

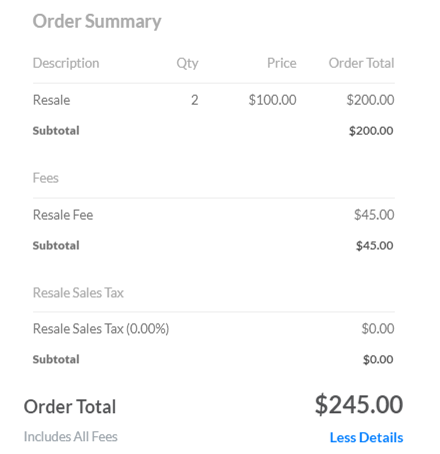
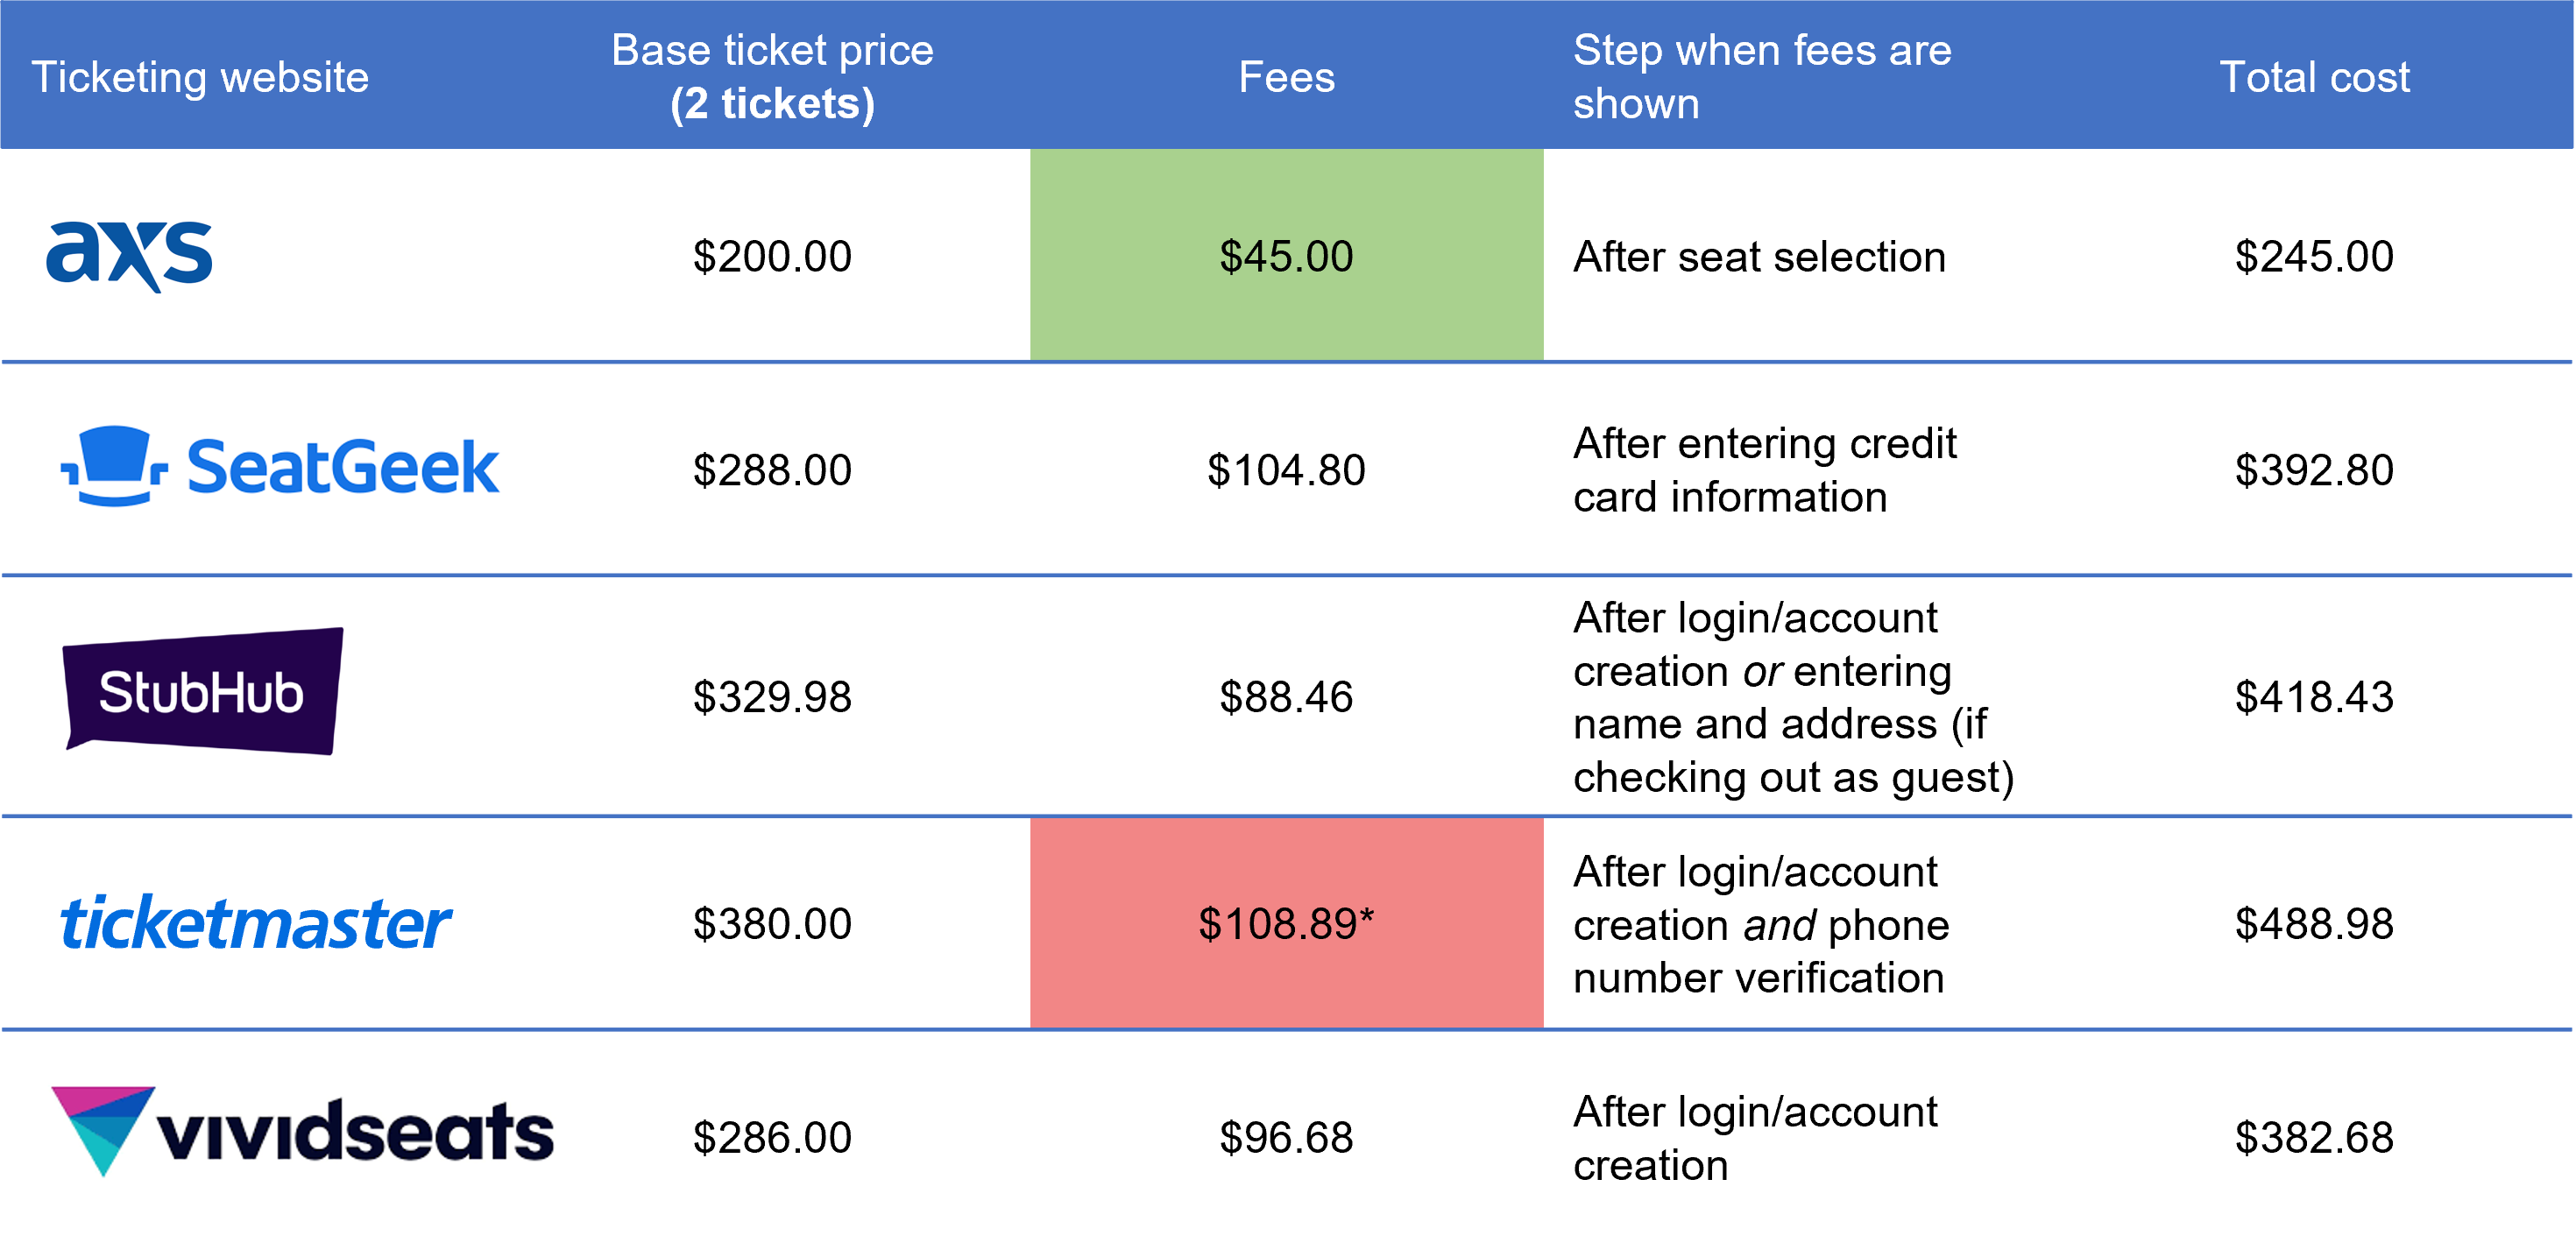
Table 1: Ticket prices and fees across the five ticketing websites (two resale tickets in the same section to a My Chemical Romance concert taking place on August 20, 2022, at Paycom Center in Oklahoma City). *Ticketmaster was the only site that had additional taxes on top of ticketing fees. This cost includes both taxes and fees.
What to Improve
Respondents had a few common problems and frustrations across the ticketing websites, such as 1) high cost of fees, 2) lack of transparency about fees, and 3) navigation.
Specific key areas of improvement cited by respondents for each website/app include
Cost
- AXS: “Price becomes too high when about to check out.”
- SeatGeek: “The fees attached to ticket sales are extremely annoying and wrong. If I am already spending $250 for tickets, why should I pay another $60 in fees that are never really explained. The whole thing feels like a scam.”
- StubHub: “I think the prices for the tickets sometimes can be too pricey, which makes me try and find an alternative place to buy tickets off social media platforms.”
- Ticketmaster: “The cost. There are so many fees that I often decide not to go to an event because of that.”
- Vivid Seats: “Extra fees really add up.”
Navigation
- AXS: “Navigating the site feels a bit sluggish and takes a bit of time.”
- SeatGeek: “It needs to be better organized.”
- StubHub: “Can be a bit overwhelming trying to find a specific piece of information.”
- Ticketmaster: “Hard to find things, a little confusing.”
- Vivid Seats: “It can feel a bit cluttered.”
Figure 6 shows a screenshot from StubHub illustrating participants’ frustrations with the process of browsing through events. StubHub has users scroll through single rows of events that are arranged by category. Because users can see only a single row at a time, navigating through events takes longer than expected and leads to frustration. It would be preferable to see more events at once, rather than having to scroll bit by bit.
Summary and Takeaways
An analysis of the user experience of five ticketing websites found:
- SeatGeek leads and Vivid Seats lags. There were fairly wide variations in NPS and SUPR-Q scores. SeatGeek had the highest SUPR-Q rating (76th percentile) and the highest NPS (17%). Vivid Seats had the poorest SUPR-Q (32nd percentile) and NPS (−23%).
- Search, support, and seats drive SUPR-Q scores. Seven variables accounted for 58% of the variation in SUPR-Q ratings. The top key drivers were “The site has the ability to search for events by city/area” and “The site provides useful customer support” (respectively accounting for 12% and 10% of SUPR-Q variation). Another significant key driver included “It’s easy to see what seats are available” (9% of variation).
- High and hidden fees along with poor navigation are consistent problems. Respondents had a few common problems and frustrations across the ticketing websites, such as 1) high fees, 2) lack of transparency about fees, and 3) poor navigation.
- Ease of selecting seats drives NPS. The top high-level driver of likelihood-to-recommend was brand attitude; its top low-level driver was ease of seeing available seats. At a lower level, using the same set of predictors as in the SUPR-Q KDA, the top key drivers were “It’s easy to see what seats are available” (13%) and “The site provides useful customer support” (12%).
For more details, see the downloadable report.