 The wide range of UX methods is one of the things that makes UX such an interesting field. Some methods, like usability testing, have been around for decades. Others are more recent additions, and some seem to be just slight variations on other existing methods.
We’ve been tracking and analyzing the methods UX professionals reported using for several years by analyzing the results of the UXPA salary survey.
The recently completed 2022 UXPA salary survey provides one of the more comprehensive and unbiased pictures of UX method usage and how it’s changed over time. This year’s survey was completed by 625 UX professionals in 31 countries. The data is similar to (but a bit smaller than) the data from earlier surveys.
Here’s an overview of how common methods are used and how that use has changed over time. Differences greater than about 7% across years or methods are statistically significant.
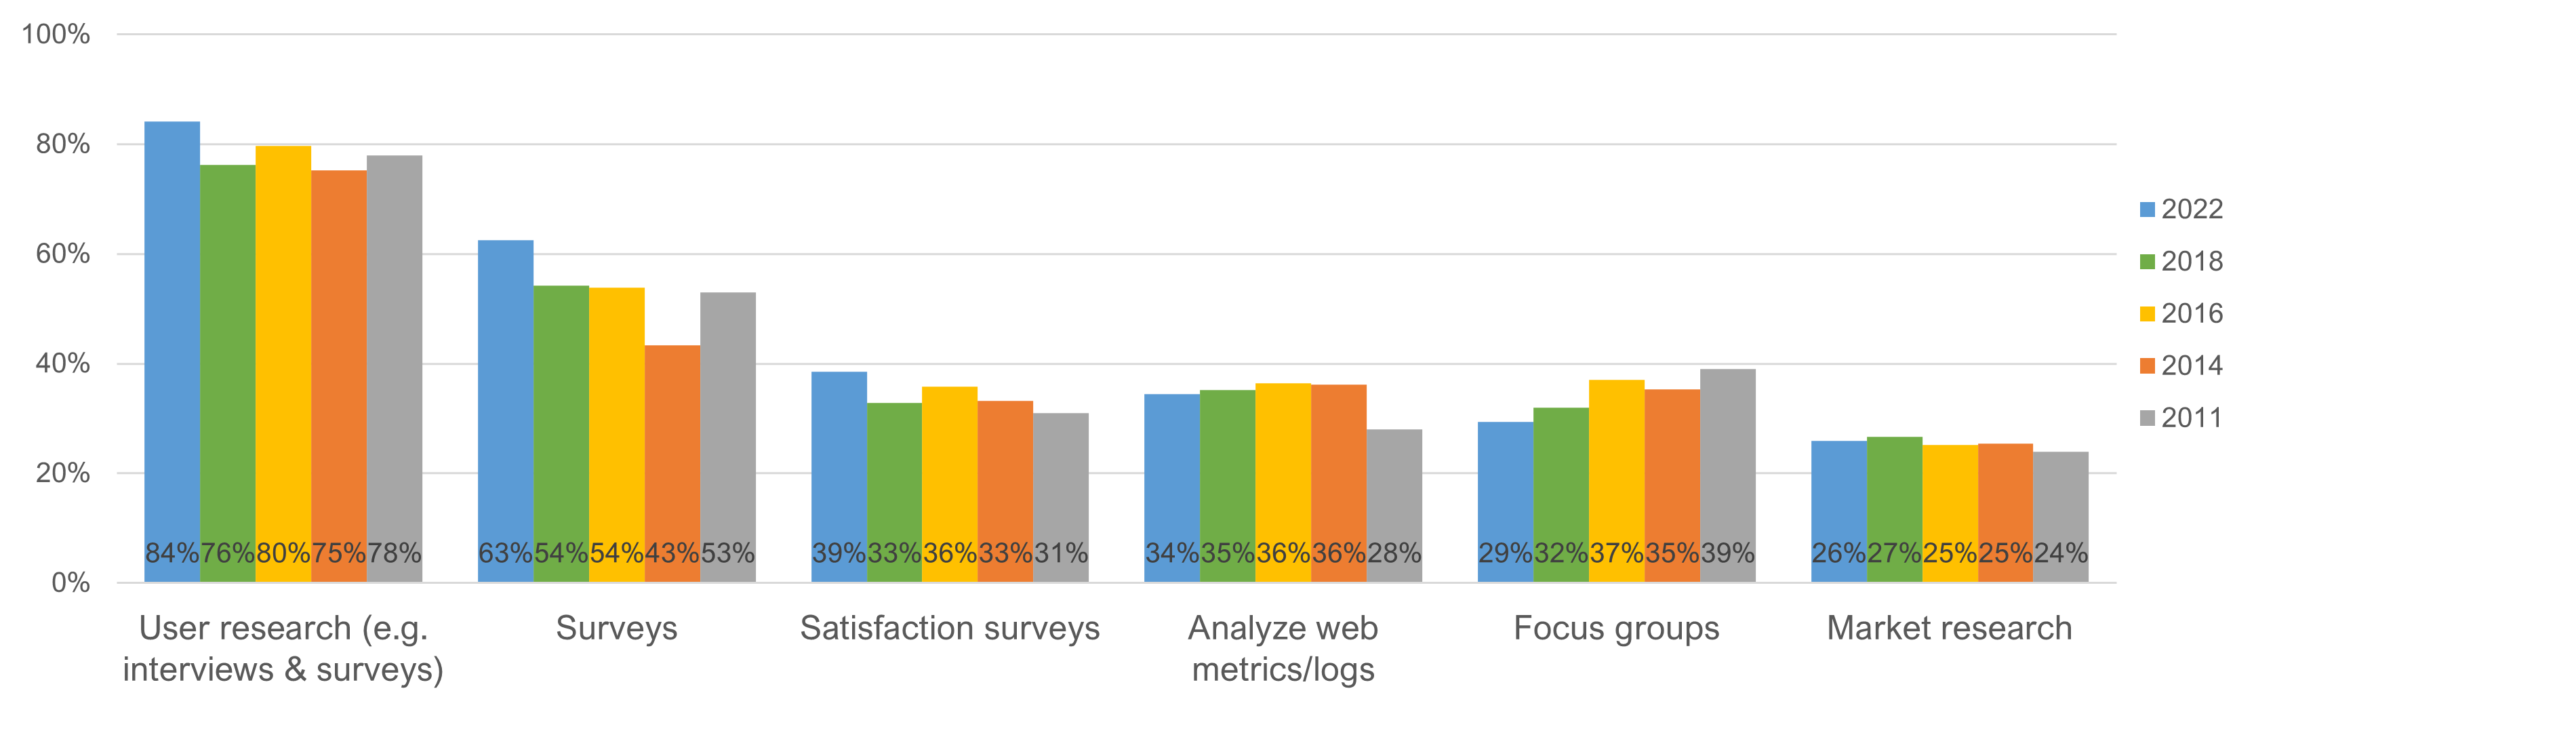
User Research
While usability testing was the most used UX method from 2011 to 2018, user research was the top method in 2022. Among our respondents, 84%reported doing user research (e.g., interviews and surveys) in 2022, making it statistically more popular compared to 2018 (76%). User research is a broad term that encompasses many methods, both qualitative and quantitative. Unsurprisingly, then, most respondents reported doing some form of user research.
Surveys have been a popular UX research method since 2011 and were statistically even more popular in 2022 (63%) compared to past years. Respondents also reported using satisfaction surveys statistically more in 2022 (39%) compared to 2018 (33%). Despite some criticism, we suspect surveys will remain a popular method, especially as they continue to be integrated into other methods like unmoderated studies.
Other user research methods remained relatively consistent since 2011 (see Figure 1). The exception is focus groups, which have been declining in usage since 2011. With focus groups losing traction among UX professionals, it’s not surprising this method continues to lose popularity.
Usability Testing
Usability testing was the second-most used UX method in 2022 (77%, see Figure 2). Usability testing has evolved in the last decade with the many options to provide unmoderated and remote moderated testing in addition to traditional lab-based testing. It’s not surprising this core method remains widely used in 2022.
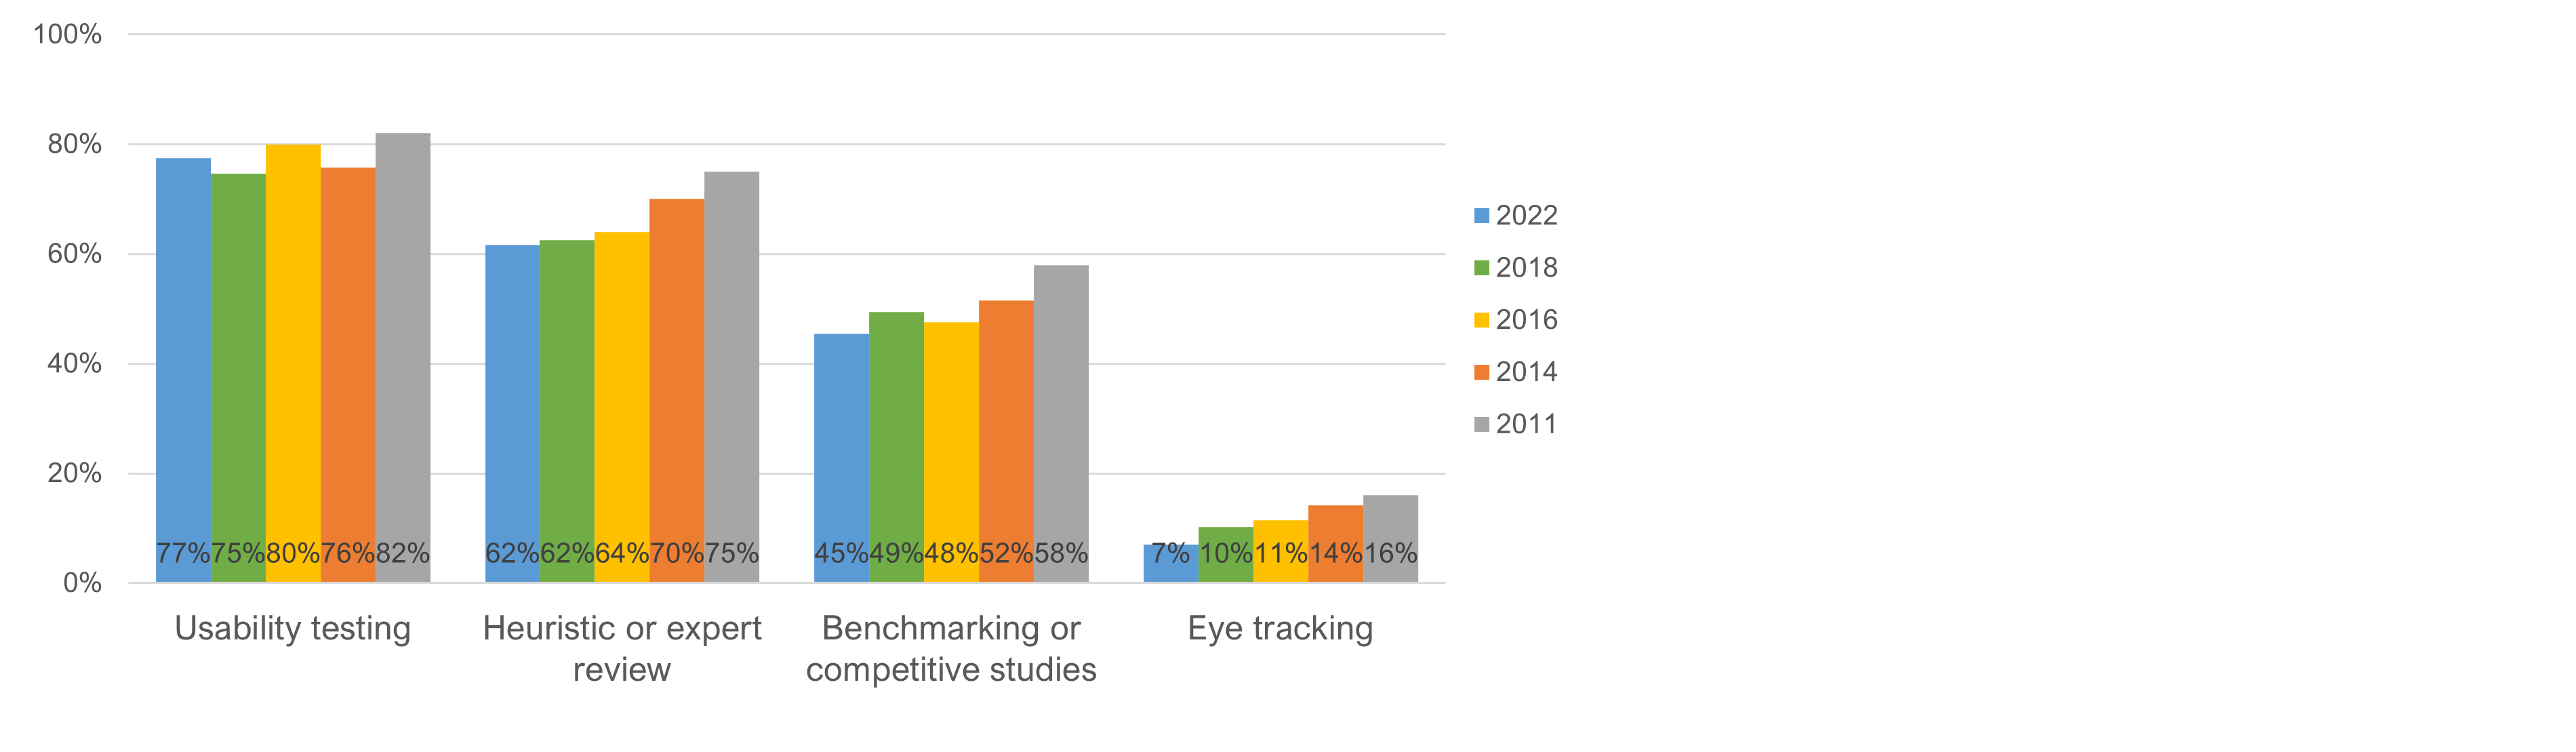
Expert Reviews
Heuristic evaluation is often used interchangeably with expert review (much to the chagrin of Rolf Molich). Both expert reviews and heuristic evaluations are analytic techniques that require an evaluator to review an interface against a set of guidelines or principles. This method is frequently used because it’s faster and less expensive than many other methods. Mirroring results in 2018, 62% of respondents reported using expert reviews in 2022, which had been showing a downward trend since 2011.
Benchmarking
Benchmarking a website against industry standards and competitors is an excellent way to understand how design changes impact the user experience. We strongly recommend this approach for tracking interface changes over time. If you need help running a benchmark study, consult Jeff’s book, Benchmarking the User Experience.
In total, 45% of respondents reported benchmarking or running competitive studies, which is good, but the usage is down since 2011.
Eye-Tracking
Eye-tracking remains a niche method, with only 7% of respondents reporting its use. While eye-tracking has gotten a lot cheaper in the last decade, its usage has been trending downward since we started tracking it in 2011 (when 16% reported using it). Its more limited use may reflect the considerable time and training needed to include eye-tracking. For example, when we conduct eye-tracking studies for our clients, we allot around 10 minutes of processing and analysis time for every one minute of video.
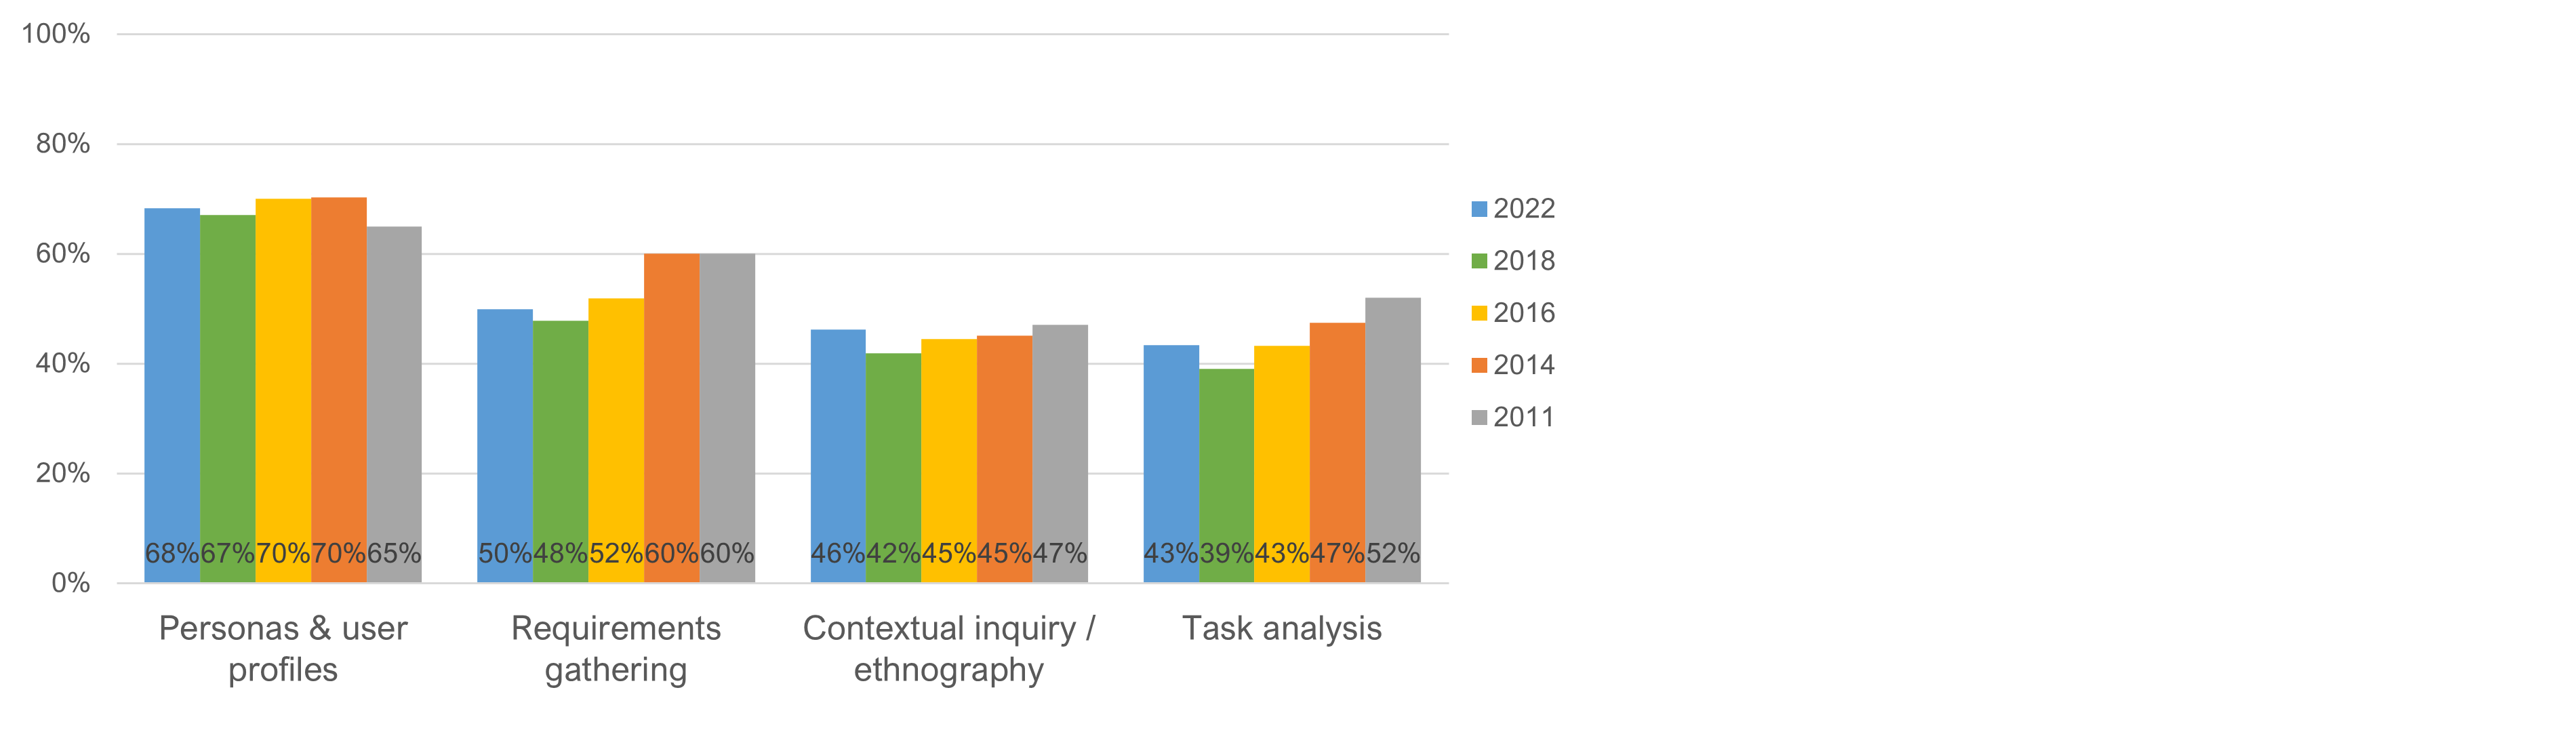
Defining Users and Requirements
Understanding who users are and what they’re trying to accomplish with an interface can be essential to improving the user experience (Figure 3). Personas have remained a popular method for defining users despite criticism of how they’re implemented. It’s not surprising then that one of our most popular articles is on how to make them more scientific.
The number of respondents gathering requirements and conducting a contextual inquiry has increased slightly since 2018. Task analysis, which has been showing a decline since 2011, had a bump in popularity this year. About 43% of respondents used the method, similar to results in 2016.
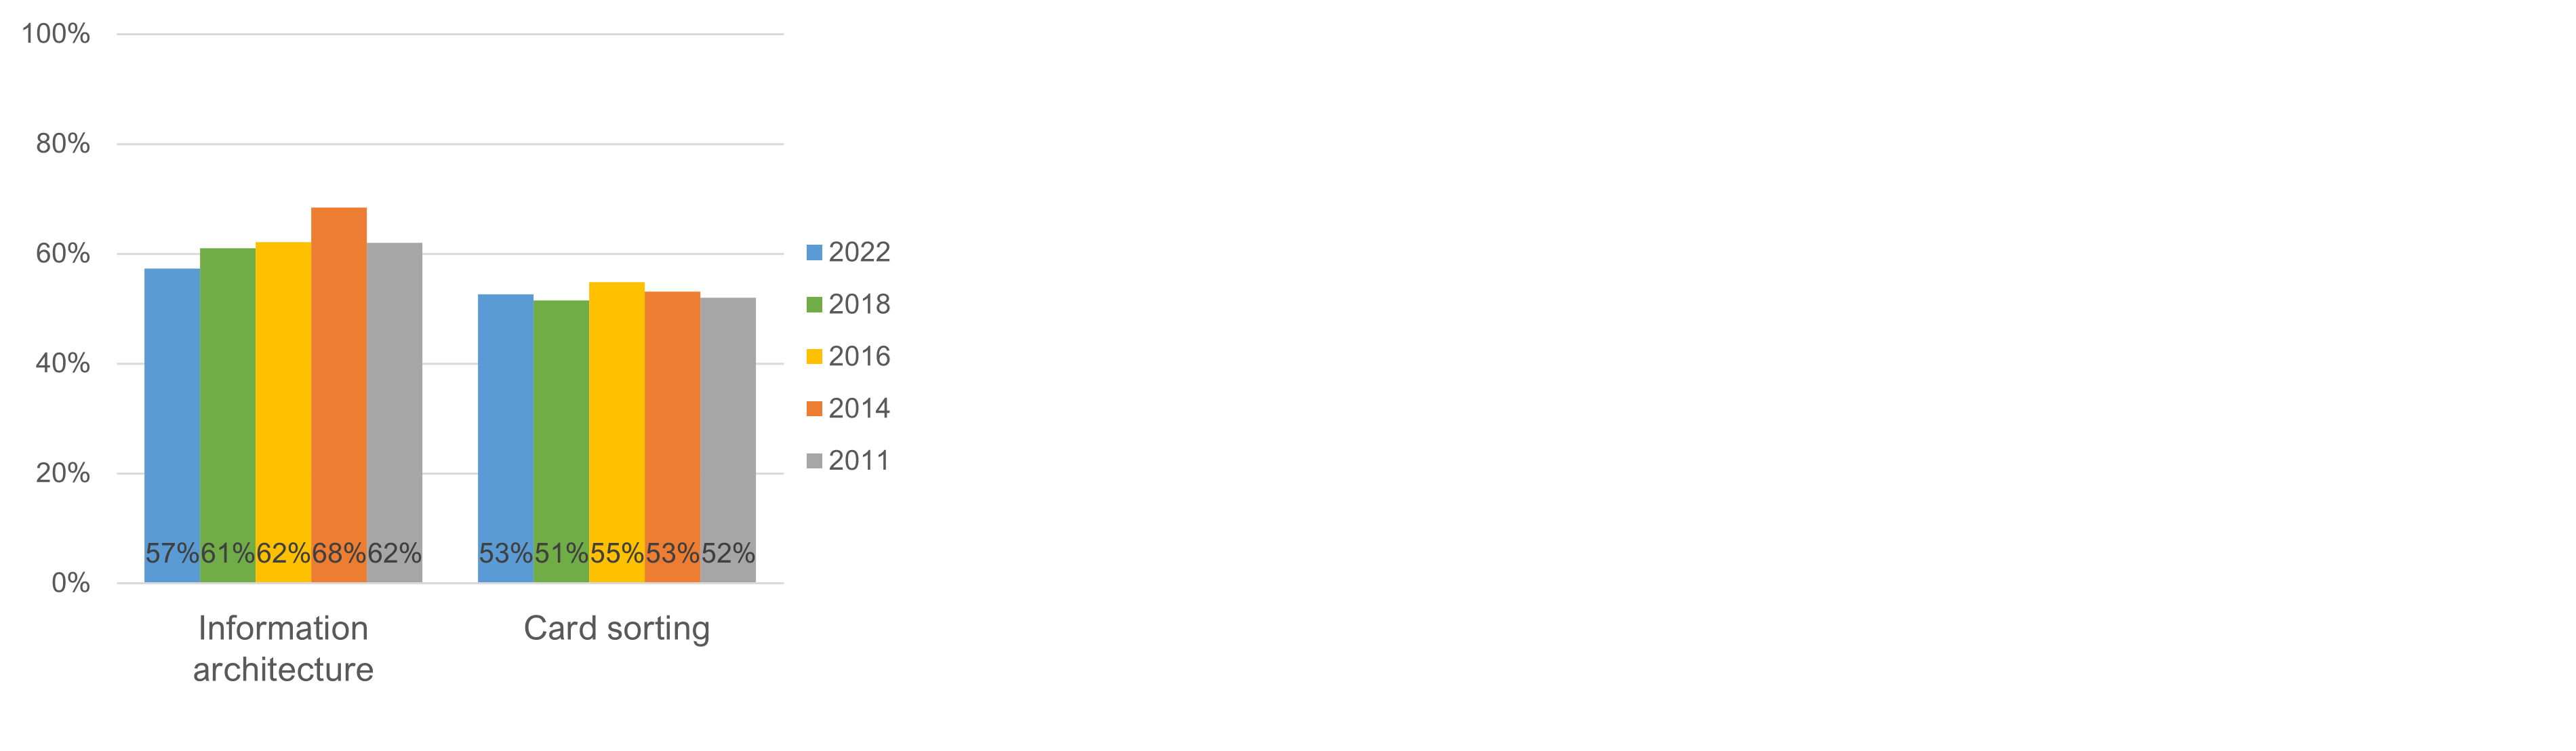
Information Architecture
We’ve consistently found that the ability to find information easily is what differentiates good websites and products from bad ones. There’s a science to findability, which involves several methods and techniques. The UXPA survey asks about one popular method, card sorting (included in our MUIQ® platform), which has remained relatively popular since we began tracking it in 2011 (Figure 4).
Prototyping and Design
Design is a fundamental part of the user experience; however, statistically, fewer respondents reported using some form of prototype or wireframe in 2022 (60%) compared to previous years (Figure 5). All forms of prototyping and design showed a statistical decline this year compared to 2018 except for content creation and technical writing. We frequently test high-fidelity prototypes built from InVision on desktop and mobile in our MUIQ app. We’ve also found UX metrics to be reliable, even when used on these early-stage prototypes.

Accessibility
Accessibility remains a more niche activity for this group of respondents, but there seems to have been a slight but steady year-to-year growth in assessing accessibility since 2011 (Figure 6). In the past eleven years, it’s increased from 14% to 20%.

Strategy, Training, and Design Thinking
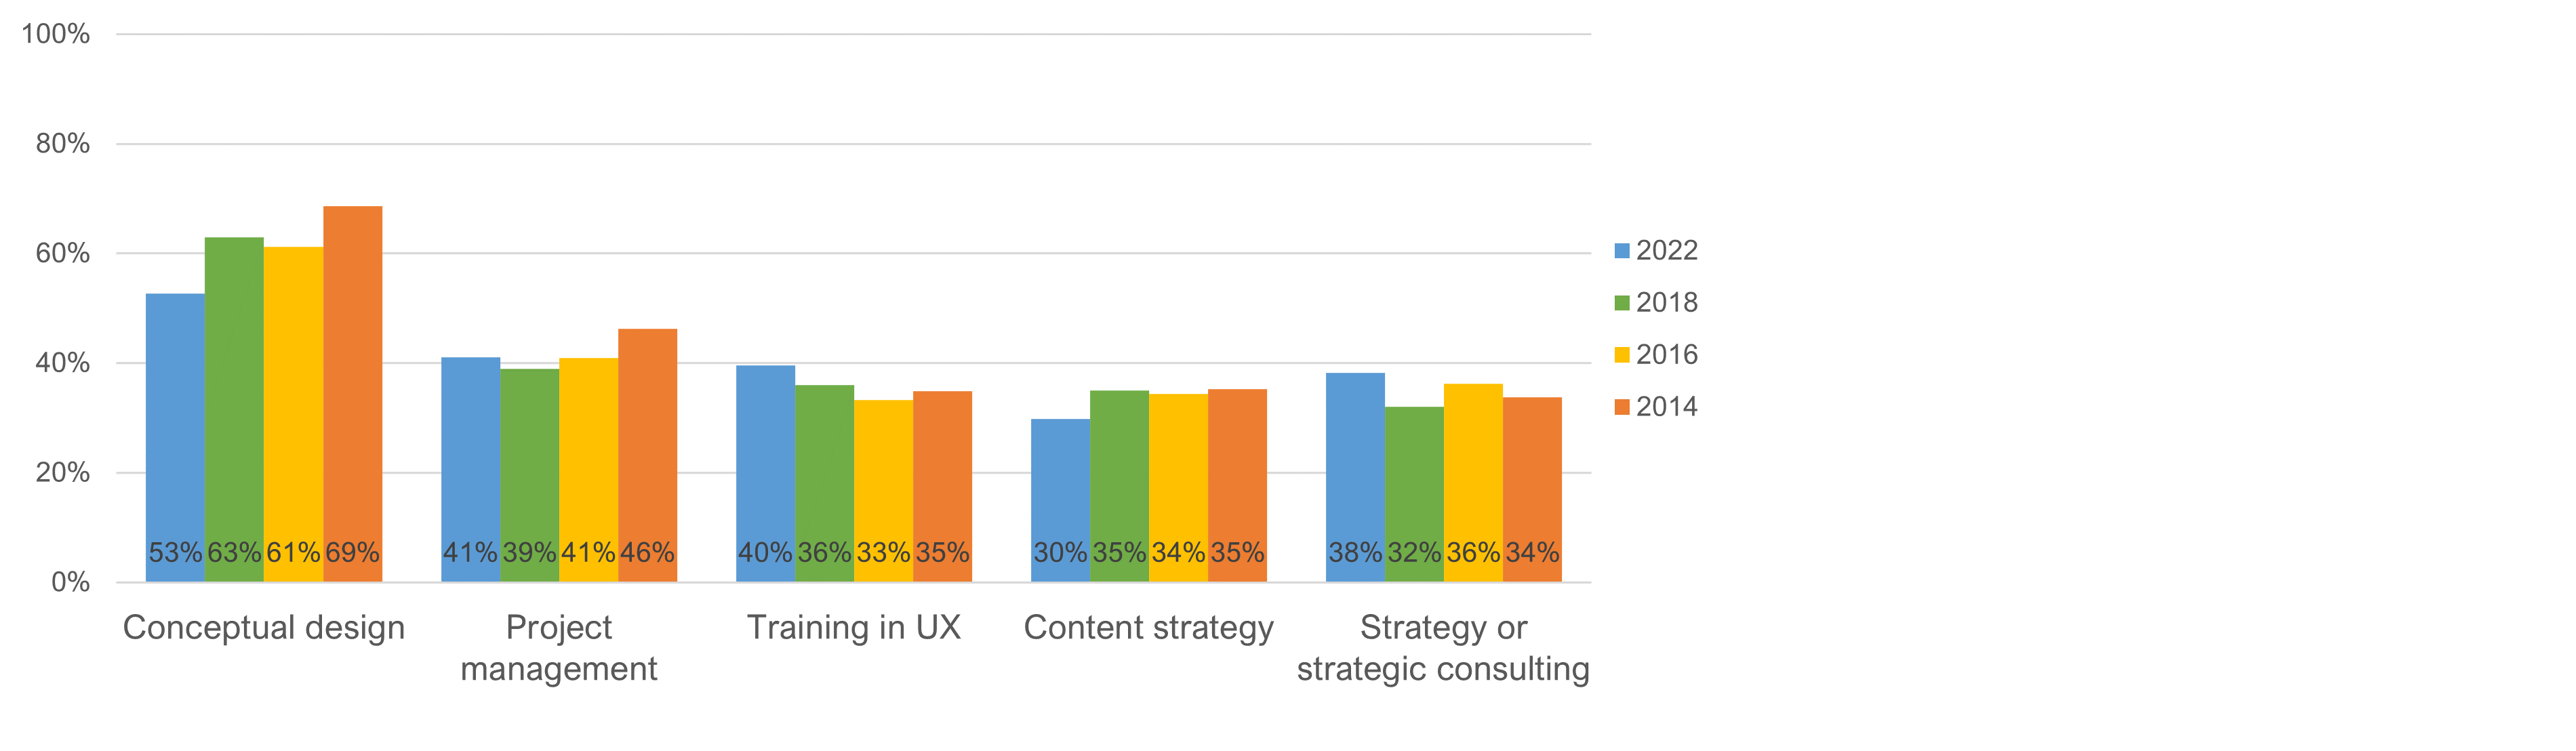
Strategy, project management, and training in UX have been consistently common activities since 2014, with more than a third of participants doing some project management, training, content strategy, and strategic consulting each year (Figure 7). The most common activity remains conceptual design, even though it’s showing a statistical decline in 2022 (53%) compared to past years.
Summary
The results of the 2022 UXPA salary survey reveal that the core methods in UX remain popular today, including usability testing, expert reviews, personas, card sorting, and prototyping. Some methods, such as focus groups and eye-tracking, have continued to lose popularity over the last eleven years, while accessibility reviews have slightly increased in usage.