 What percentage of users are willing to participate in a TA study?
The Think Aloud (TA) method, in which participants speak their thoughts as they attempt to complete tasks, is one of the most distinctive characteristics of usability testing.
Think Aloud, as a method for understanding human attitudes and behavior, has been around for over a century. Although often thought of as a single method, there is actually substantial variation in how TA is implemented, including concurrent TA with a moderator, two retrospective types (one with video and one from memory), and unmoderated TA.
With the proliferation of remote UX evaluation tools, like our MUIQ® platform, the use of unmoderated TA has increased. For unmoderated TA to work properly, participants need to grant permission to record their screen, audio, and webcam.
In unmoderated TA, participants receive instructions on how to think aloud and are then asked to think aloud during a task. Because no moderator is present to prompt or probe, it’s helpful to provide an instructional video and, when necessary, provide repeated digital prompts during the tasks to remind participants to continue talking.
One of the early entrants into remote think-aloud was Usertesting.com. The service has become quite popular (enough to become a publicly traded company). But there’s pressure to find enough participants to satisfy the growing need for on-demand think-aloud videos. Consequently, one criticism of Usertesting.com is its excessive reliance on “professional users”—participants who spend their days taking studies and providing feedback. There’s too little data to know for sure, but such reliance on overused panelists may impact the generalizability of findings.
We have been investigating the impacts of thinking aloud on UX metrics, problem discovery, and how people view a page. And we have investigated unmoderated usability study dropout rates. As part of our research, we needed to recruit participants who can think aloud remotely without a moderator. One of the first things we noticed is that not everyone is willing to think aloud. Of those willing to participate in a think-aloud study, not all comply with the instructions. Of those who do comply, not all do a good job of actually thinking aloud.
We have already investigated panel compositions, but to better understand sources of potential biases and limits to the generalizability of the findings from think-aloud studies, we wanted to first understand what percentage of participants from online panels would think aloud and how many ultimately provide TA videos of a quality high enough to be useful.
Starting Point
Soliciting Think Aloud Participants
Between May 2021 and April 2022, we conducted five surveys asking participants from the US and UK about their prior experiences with websites and software products. Across the surveys, we also asked participants whether they would be willing to participate in a follow-up think-aloud study that, for additional compensation, would involve sharing their screen, web camera, and microphone. The percentage of participants willing to participate and agree to each request is shown in Table 1.
| Survey Number | Total | % Willing to TA (share mic/audio) | % Share Webcam | % Share Screen |
|---|---|---|---|---|
| 1 (UK) | 100 | 37% | 27% | 46% |
| 2 (US) | 202 | 46% | 33% | -- |
| 3 (US) | 303 | 52% | 36% | 57% |
| 4 (US) | 507 | 50% | 37% | 51% |
| 5 (US) | 104 | 49% | 41% | 58% |
| Total | 1216 | 48% | 36% | 53% |
Table 1: Percentages of participants willing to think aloud and share webcams and screens.
Across the 1,216 participants in five surveys, a bit less than half (48%) reported being willing to share their microphone, a necessary step in participating in a think-aloud study.
Screen sharing is also usually a requirement for remote think-aloud studies so researchers can observe what participants are doing while they talk. In four of the five surveys, we asked whether participants were willing to share their desktop or mobile screen. Around half (53%) of the 1,014 respondents agreed to share their screen and have it recorded.
Finally, we asked about the willingness of participants to share their webcam to record their faces as they thought aloud—an enhancement but not a requirement for think-aloud. A smaller percentage (36%—434 of the 1,216 participants across all five surveys) were willing to share their webcam.
UK Less Willing to Participate
We compared the volunteer rate between one sample of UK-based participants and four samples of US-based participants, finding that the UK participants were less interested in participating. Of the 100 participants in our UK sample (Survey 1 in Table 1), 37 (37%) were willing to participate in a think-aloud session. That participation rate is statistically lower than the 552 out of 1,116 (49%) participants across the four US surveys (p = .02).
This lower interest was also seen with sharing webcams (27% UK vs. 36% US; p = .058) and sharing screens (46% UK vs. 61% US; p = .14).
Inviting Volunteers to a Think Aloud Study
Finding participants who are willing to think aloud in a remote study is only the first step. Next, they need to actually show up for the study and then think aloud.
For example, we invited 102 participants to think aloud in a study on real estate websites. These participants had previously agreed to participate in a TA study and were qualified to participate based on indicating a recent interest in looking online for homes to buy, sell, or rent.
Of the 102 potential participants, 26 completed the study, and 23 provided some effort in thinking aloud (see Table 2, row 3). Some potential participants never answered the invitation (sent 3–4 weeks after the initial survey); others abandoned the study at some point. For these delayed invitations, about 25% moved on to participate in the study. In previous research, however, we found that when participants were able to immediately start the study after indicating their willingness to think aloud, about 50% completed the study without dropping out.
Percentage of Participants Who Thought Aloud
Once participants agreed to participate in a think-aloud study, we also wanted to get a better sense of the percentage of participants who would ultimately provide usable think-aloud videos. In addition to the first real-estate study, we evaluated the yield in five other studies as shown in Table 2.
| Study Description | # Completed | # Who TA'd | % TA |
|---|---|---|---|
| Retail* | 50 | 30 | 60% |
| Food Delivery* | 14 | 9 | 64% |
| Real Estate 1 | 26 | 23 | 88% |
| Real Estate 2 | 24 | 23 | 96% |
| United Airlines | 22 | 19 | 86% |
| OpenTable | 28 | 23 | 82% |
| Total | 162 | 126 | 78% |
Table 2: Study description, number completed, and number who provided usable think-aloud videos. * indicates participants were asked to share their webcam in addition to audio/screen.
The studies were on retail websites (e.g., Target, Walmart), food delivery websites (e.g., DoorDash, Grubhub), real estate websites (e.g., Redfin, Zillow), United Airlines, and OpenTable. On average participants took 10–15 minutes to complete the one-task studies.
In the studies, participants were asked to think aloud while attempting one task (e.g., finding a product, groceries, property, airline ticket, or restaurant reservation) and were provided with an example video demonstrating how to think aloud while attempting the task. After the introduction, participants were reminded to think aloud in the task instructions.
In two of the studies (Retail and Food Delivery), we also asked participants to share their webcam in addition to their screen while thinking aloud. These participants had previously indicated willingness to share their webcams, but this request is likely driving the significantly lower percentage of participants who provided usable think-aloud videos (asked to share webcam: 61%; not asked to share webcam: 88%, p = .00005).
Across the six studies, we found that 126 of the 162 (78%) who completed the study provided usable think-aloud videos. We had a low bar for qualifying as a usable TA video, so even a minimal number of utterances counted as thinking aloud.
Final Yield
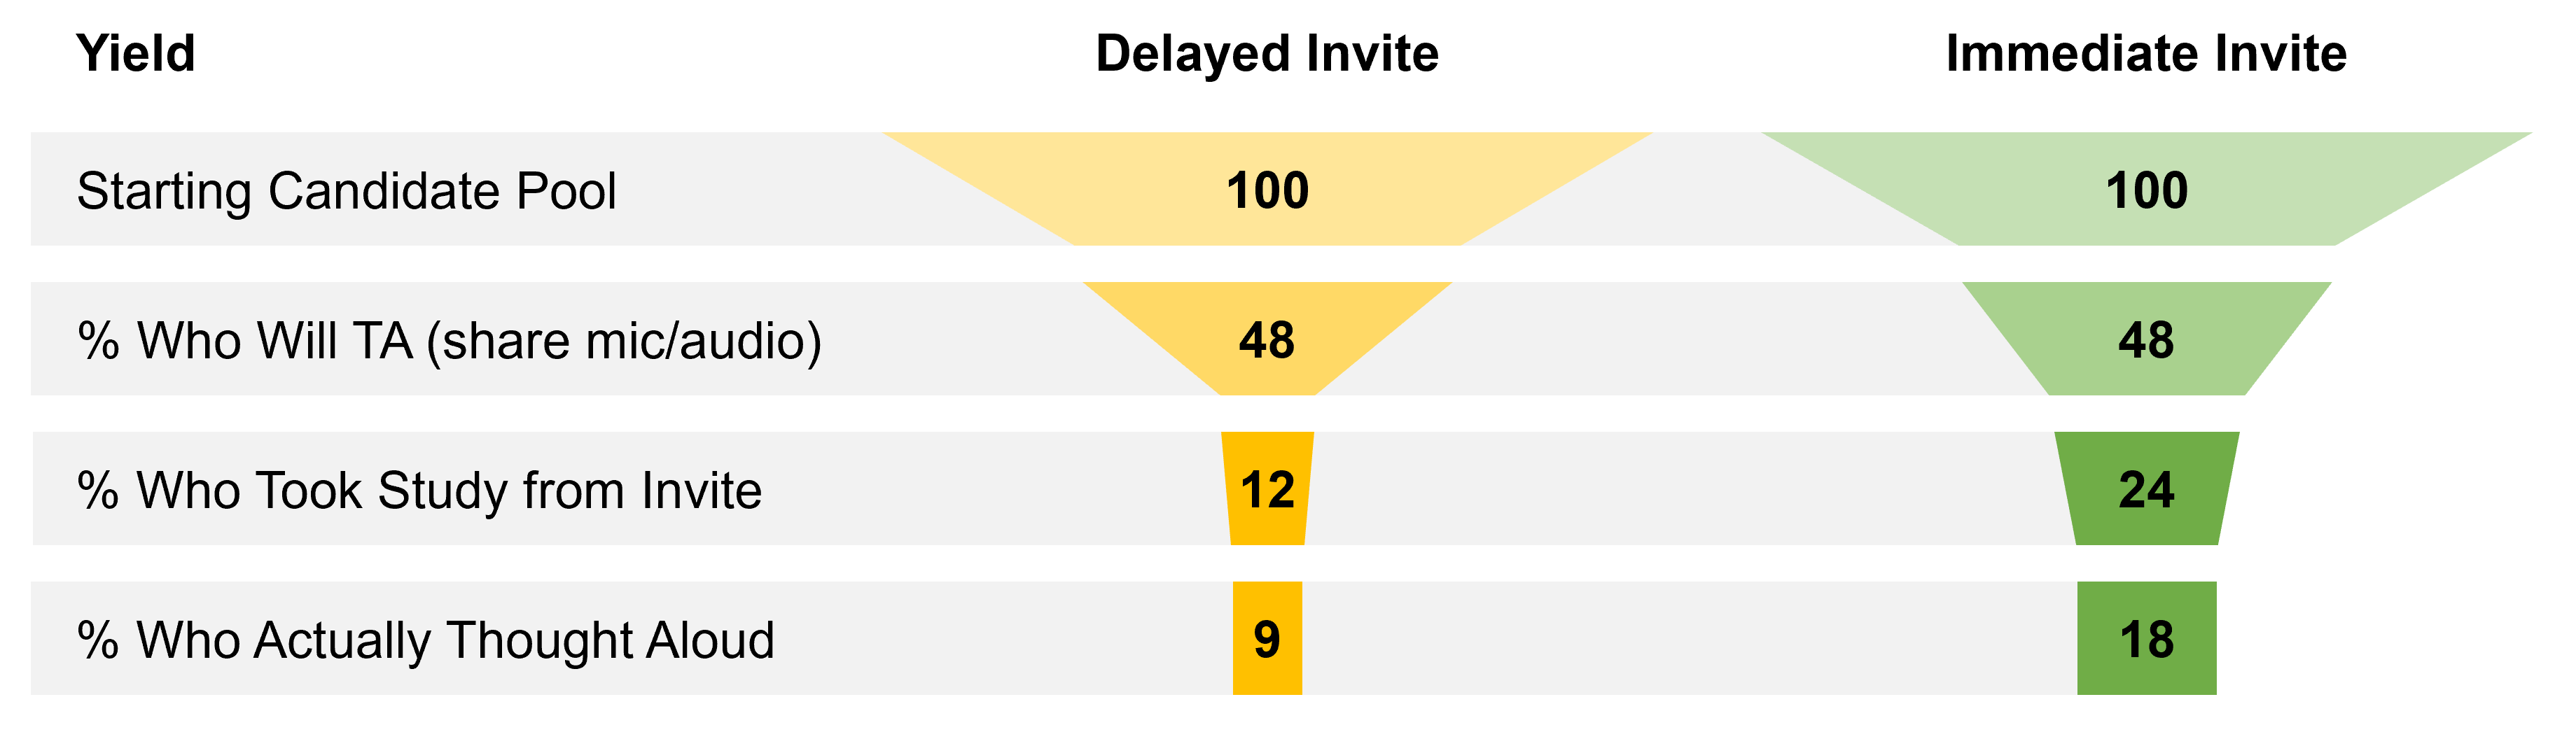
Using all steps to estimate, we have some idea about how many people it takes to ultimately get one person to think aloud with sufficient quality in an unmoderated study. Figure 1 shows the pass-through yield at each step and normalizes this to 100 participants. When invitations are delayed, it takes about 11 people (10.9) to get one usable think-aloud video; when invitations are immediate, getting one usable session requires inviting five or six people. Or if you invited 100 qualified participants, expect around nine or so usable videos when invitations are delayed and about eighteen when the invitation is immediate.
Of course, each step may fluctuate depending on other criteria we haven’t assessed—something we can continue to replicate and investigate in future analyses.
Summary and Discussion
An analysis across multiple datasets and over 1,000 participants found the following about think-aloud study participation:
The yield is about 9% for a delayed invitation. From a general pool of consumers enrolled in an online panel, roughly 9% of participants will provide a usable think-aloud video when there is a delay between indicating a willingness to participate and the invitation to the study. For delayed invitations, if you need roughly ten usable think-aloud videos, expect to invite around 111 participants.
The yield is about 18% for an immediate invitation. Because roughly twice as many participants move on to take an unmoderated TA study when they can do so immediately, roughly 18% of invitees completed the study and provided useful videos. If you need ten usable think-aloud videos when your invitation is immediate, plan to invite around 55 participants.
Time between invites is a mitigating factor. The biggest drop-off in the TA video collection process is the percentage of people who indicate a willingness to participate and ultimately show up (a 25% yield when invitations are delayed and 50% when invitations are immediate). This increased drop-off for delayed invitations is likely due to participants missing the invitation (sent through a panel notification) or no longer being available during the study.
Webcams make participation worse. Only around a third of participants in our surveys indicated a willingness to share their webcam, statistically lower than the percentage willing to share their screen (53%) or microphone (48%). If you want to increase participation in your study, consider not requiring a webcam to participate.
Only unmoderated TA was assessed. This study investigated how many people would be willing to participate in a think-aloud study using only remote unmoderated think-aloud videos where no moderator is present. Future analysis can look into the participation rate in moderated (remote or in-person) TA sessions.
Most people who complete a TA study do think aloud. Across our six studies, we saw a high percentage of participants who provided usable think-aloud videos once they completed a study. On average, around 78% of those who completed the study provided usable think-aloud videos. In short, if people commit and complete the study (i.e., don’t drop out), then it’s likely the video will contain a usable think-aloud video.
The duration of the TA study might affect dropping out. In our studies, we asked participants to think aloud, usually attempting one core task, with the session lasting roughly 10 to 15 minutes. It’s unclear how much the duration impacts the participation rate on top of the technical requirements. While most participants do provide a think-aloud video, one of the reasons for the large drop-off could be the duration of the study, as the initial surveys that solicited participation were shorter (between five and ten minutes).
Are TA participants different? One of our motivations for conducting this study was to understand the generalizability of the findings from think-aloud studies. We analyzed only those who ultimately participated from a general panel. In future research, we’ll look at the variables we collected (mostly demographics) of the roughly 50% of people unwilling to participate. We have already observed a country difference in one study (those in the UK were significantly less willing to participate than people in the US).