 The COVID pandemic led to a precipitate drop in restaurant dining, but statistics from the end of 2022 show that more people are dining out now than before the pandemic.
While considering the growing demand for a limited number of seats in desirable restaurants, Ali Francis (2022) wrote, “The spontaneous dinner is an endangered activity. If you don’t have a reservation a week—or even a month—in advance, your likelihood of scoring a table at a popular restaurant in a densely populated city is pretty low.”
Unless they have the resources to bribe restaurant owners or $1,000 to spend on a priority service like Front of House, people use online restaurant reservation services to ensure a table is waiting for them when they go out to eat.
Like social networks (Instagram, TikTok, Twitter) and seller marketplaces (eBay, Facebook Marketplace), reservation websites benefit from network effects. The more restaurants sign up to use a service, the more diners will use it, and vice versa. OpenTable was the early dominant player in the online reservation space. To make money, OpenTable charges restaurants monthly fees and a per-visit charge for each reservation, which can add up for a business already dealing with eroding margins.
While OpenTable is still the leader, Resy and Tock have taken a significant portion of market share—especially in recent years, when restaurants are looking for alternatives to high fees. To understand the diner’s side of the experience, we collected data on a variety of attitudes and intentions on the three most popular reservation systems:
We computed SUPR-Q® and Net Promoter scores, investigated reasons for using the websites, measured users’ attitudes regarding their experiences, conducted key driver analyses, collected think-aloud data, and analyzed reported usability problems.
Benchmark Study Details
In June 2022, we asked 120 participants (most with prior experience making online restaurant reservations but 14 without), to complete a task on a restaurant reservation website they had no experience using. Participants then completed the eight-item SUPR-Q (which includes the Likelihood-to-Recommend item that is the basis of the Net Promoter Score) and the two-item UX-Lite standardized questionnaires, and they answered questions about their brand attitudes, usage, and experiences.
UX Quality of Restaurant Reservation Websites: SUPR-Q
The SUPR-Q is a standardized questionnaire that is widely used for measuring attitudes toward the quality of a website user experience. Its norms are computed from a rolling database of around 200 websites across dozens of industries.
SUPR-Q scores are percentile ranks that tell you how a website experience ranks relative to the other websites (50th percentile is average). The SUPR-Q provides an overall score as well as detailed scores for subdimensions of Usability, Trust, Appearance, and Loyalty.
The restaurant reservation websites in this study collectively averaged at the 23rd percentile. OpenTable received the highest SUPR-Q score at the 65th percentile, and Tock scored the lowest at the 16th percentile.
Usability Scores and Trust
We asked participants to rate how easy they thought it was to use and navigate through the websites. OpenTable had the highest usability score (49th percentile) and Tock had the lowest (16th percentile). Comments about Tock regarding usability included
- “I was having trouble finding any written reviews of the restaurants.”
- “The menu was not as easy to find as it should have been … (which is) more important nowadays than phone number or address.”
- “I think it was hard to look at information on the website. For the restaurants, I would have to click in and then go back to see other restaurants.”
More verbatim comments are available in the downloadable report.
Loyalty/Net Promoter Scores
The average NPS for the restaurant reservation websites was −23% (more detractors than promoters), ranging from −45% for Resy to 14% for OpenTable. In general, a better user experience is a good predictor of customer loyalty. We expected generally lower Net Promoter Scores for this study because we asked participants to use a service they had no experience with to gauge first-time usage. In first-time use situations, we tend to focus more on the relative ranking of the scores.
Prior Usage
Of the participants who had used a restaurant reservation website in the past, usage patterns were roughly equivalent among them. The most common reasons for users to visit a restaurant reservation website were, unsurprisingly, to make a reservation (79%), followed by to view an existing reservation (31%), look at restaurant reviews (27%) or restaurant information and details (26%), find restaurants based on location (23%) or food type (23%), and change an existing reservation (17%).
Key Drivers of Online Restaurant Reservation Experiences
To better understand what affects SUPR-Q scores and likelihood-to-recommend (LTR) ratings, we asked respondents to rate the following attributes of the restaurant reservation websites on a five-point scale from 1 (Strongly disagree) to 5 (Strongly agree). We conducted key driver analyses (regression modeling) to quantify the extent to which ratings on these items drive (account for) variation in overall SUPR-Q scores and, separately, LTR (the rating from which the NPS is derived).
- It’s easy to search for restaurants by type.
- It’s easy to search for restaurants by price range.
- It’s easy to search for restaurants by location.
- It’s easy to search for restaurants by ratings.
- The reviews are helpful.
- The photos are high quality.
- The photos are helpful.
- It’s easy to check the availability of restaurant reservations.
- The website’s restaurant recommendations are relevant.
- The website has all the relevant information I need for my visit.
- It’s easy to find restaurant and menu offerings.
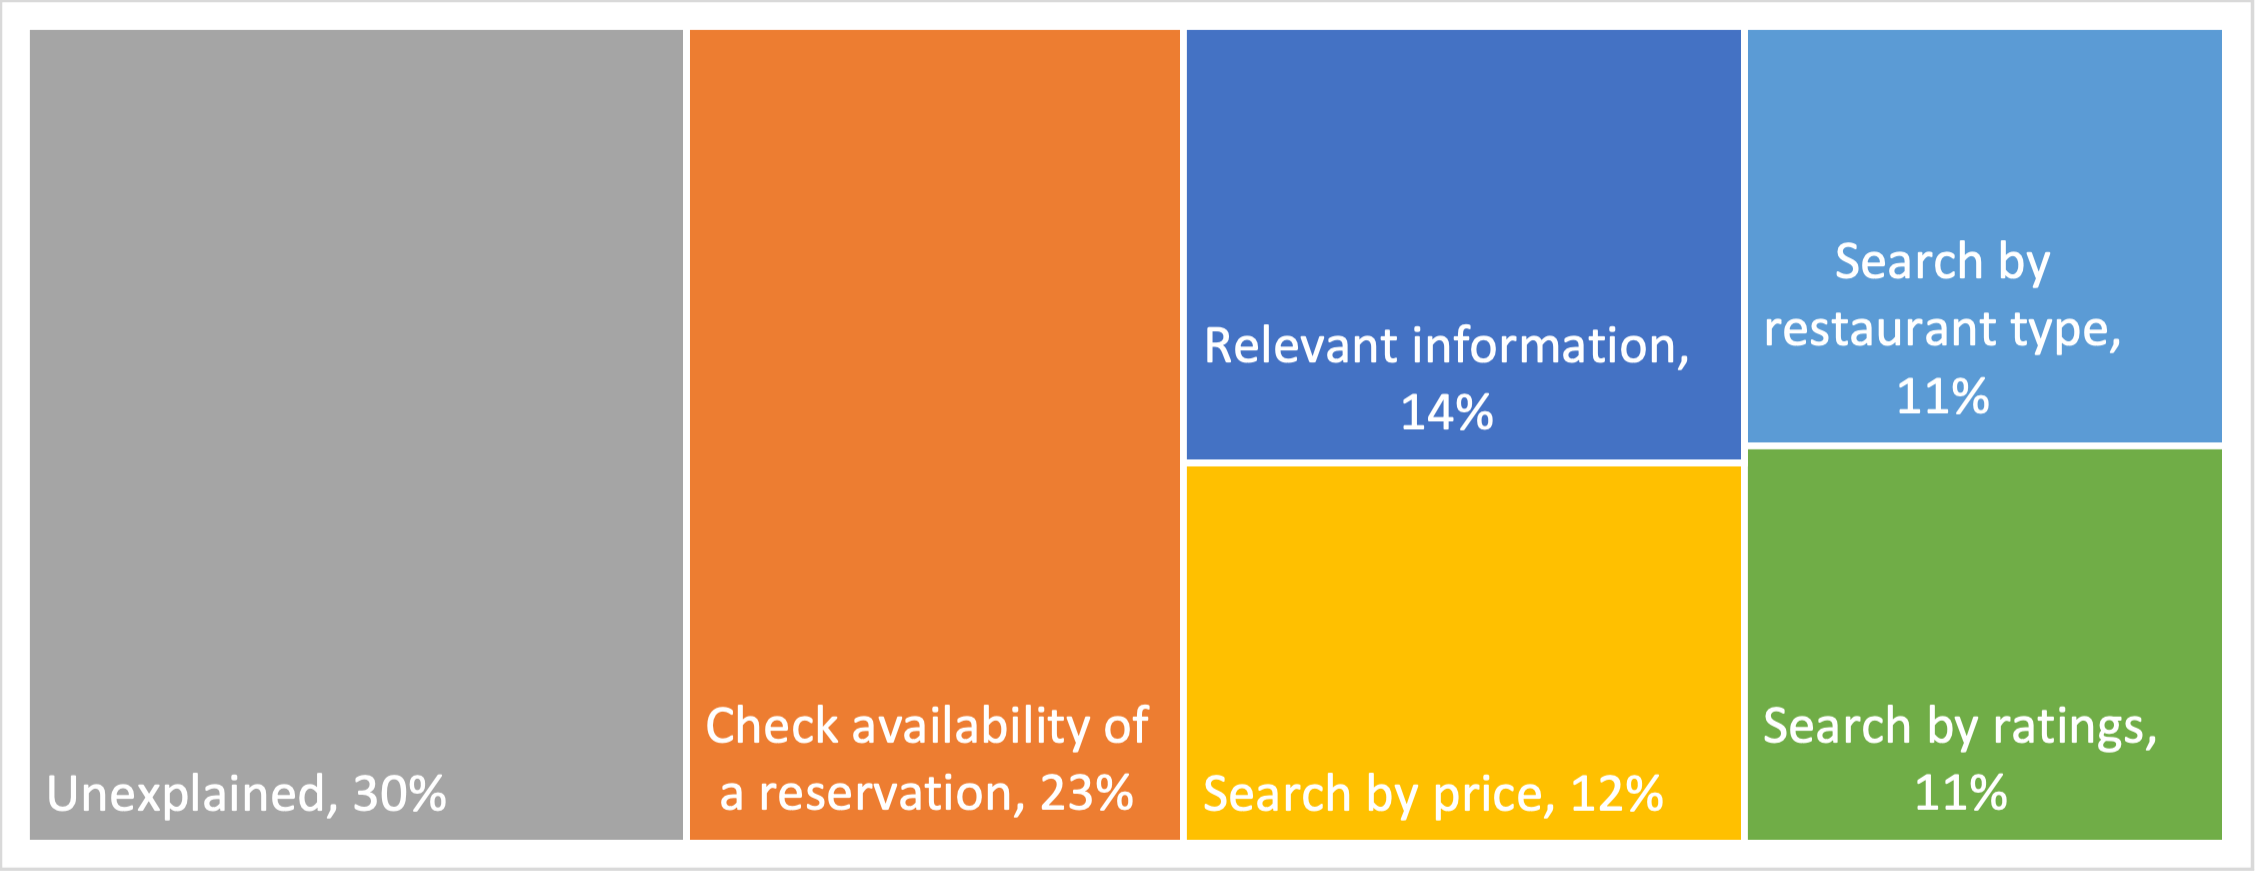
SUPR-Q Drivers. As shown in Figure 1, the top key drivers from this list were “It’s easy to check the availability of restaurant reservations” and “The website has all the relevant information I need for my visit,” respectively accounting for 23% and 14% of SUPR-Q variation. Other significant key drivers were “It’s easy to search for restaurants by price range” (12% of the variation) and “It’s easy to search for restaurants by type” (11% of SUPR-Q variation).
LTR Drivers. At a high level, the top key driver of likelihood-to-recommend (LTR, the basis of the NPS) was eCommerce Credibility (12%). This optional SUPR-Q trust metric is the mean of the ratings for “I feel comfortable purchasing from the website” and “I feel confident conducting business with the website”.
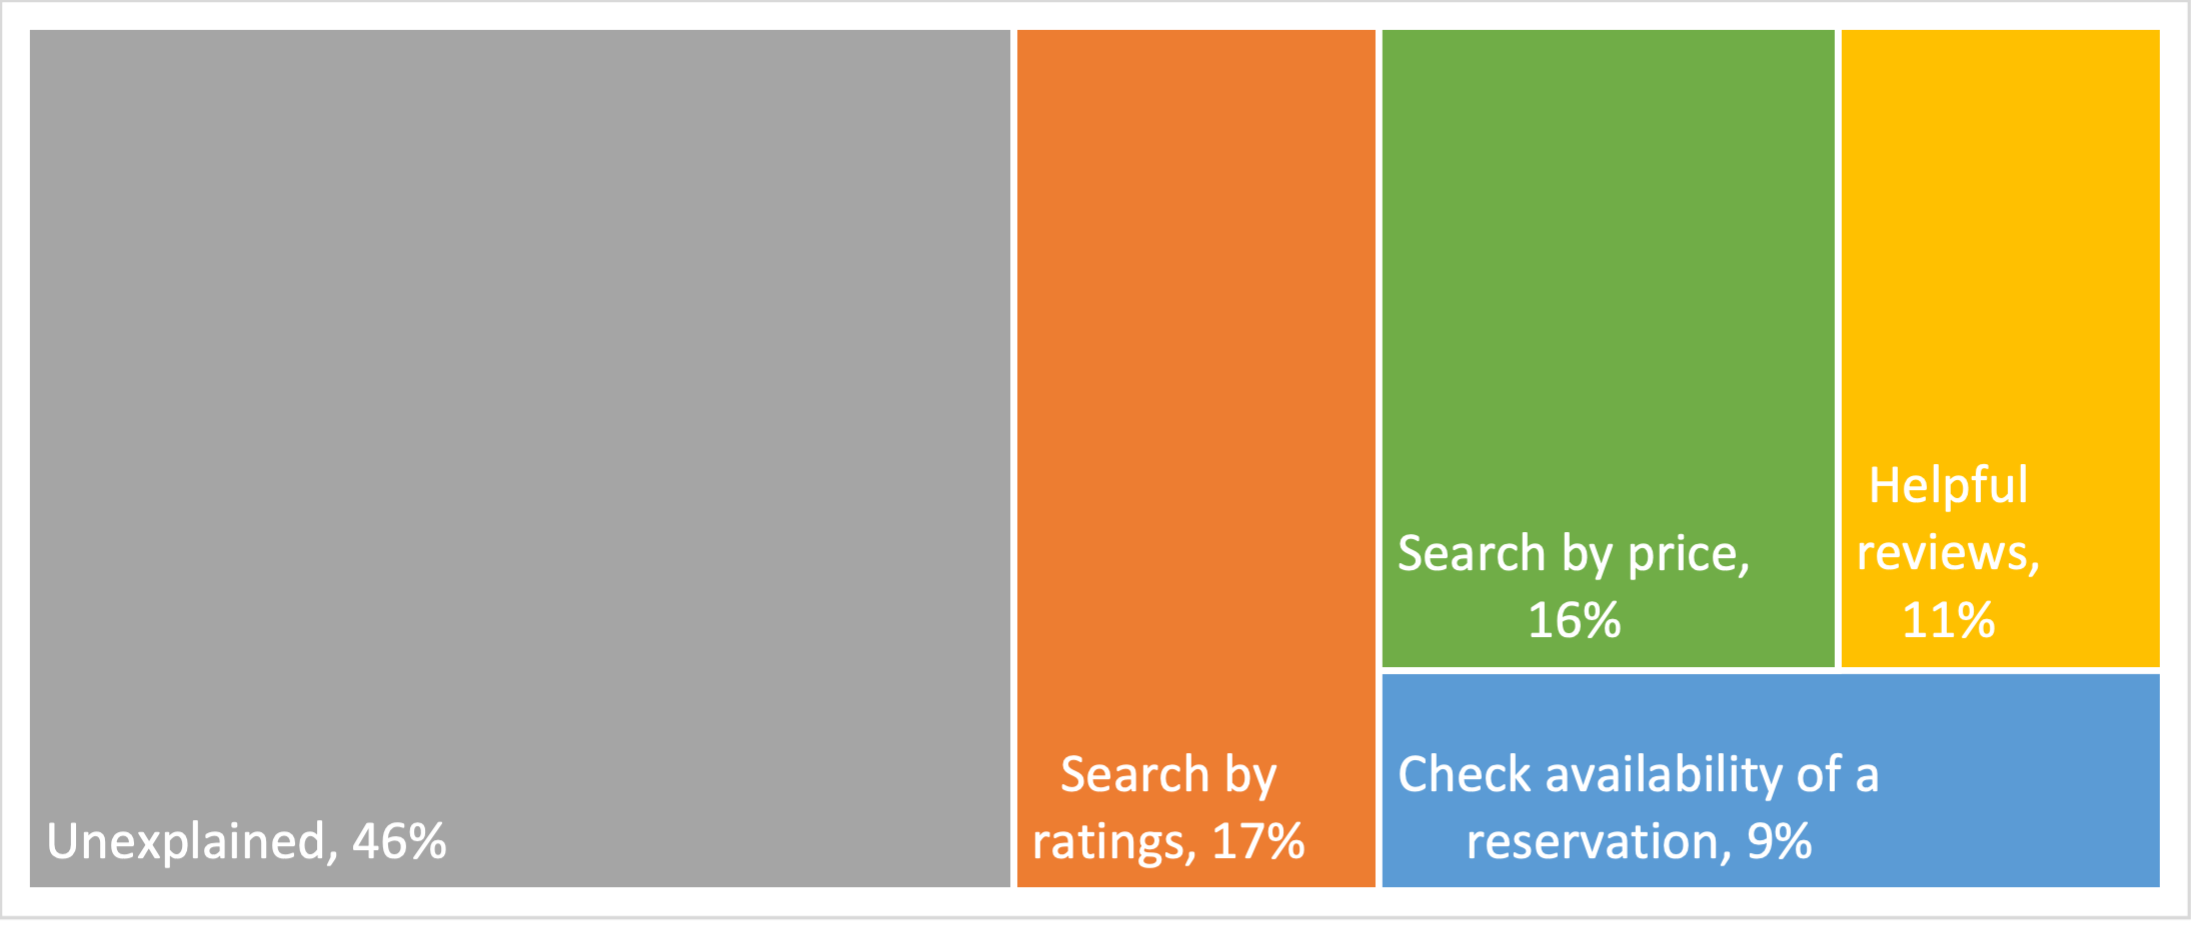
Using the same set of low-level predictors as in the SUPR-Q KDA, the top key drivers were “It’s easy to search for restaurants by ratings” (17%), “It’s easy to search for restaurants by price range” (16%), and “The reviews are helpful” (11%) (Figure 2).
Best and Worst: Key Drivers
We did a deep dive into the key drivers to better understand what’s separating the best from the worst performers. In particular, the ability to filter restaurants by price range and the display of all the relevant information people need for their visit help certain restaurant reservation websites perform better than others.
Filter by Price Range
Participants were asked to rate the ease of filtering restaurants by price range to support their decision to visit a particular restaurant. OpenTable received the highest percentage of participants who selected Strongly Agree (top box) at 68%. Resy had the lowest percentage, with only 32% of participants strongly agreeing.
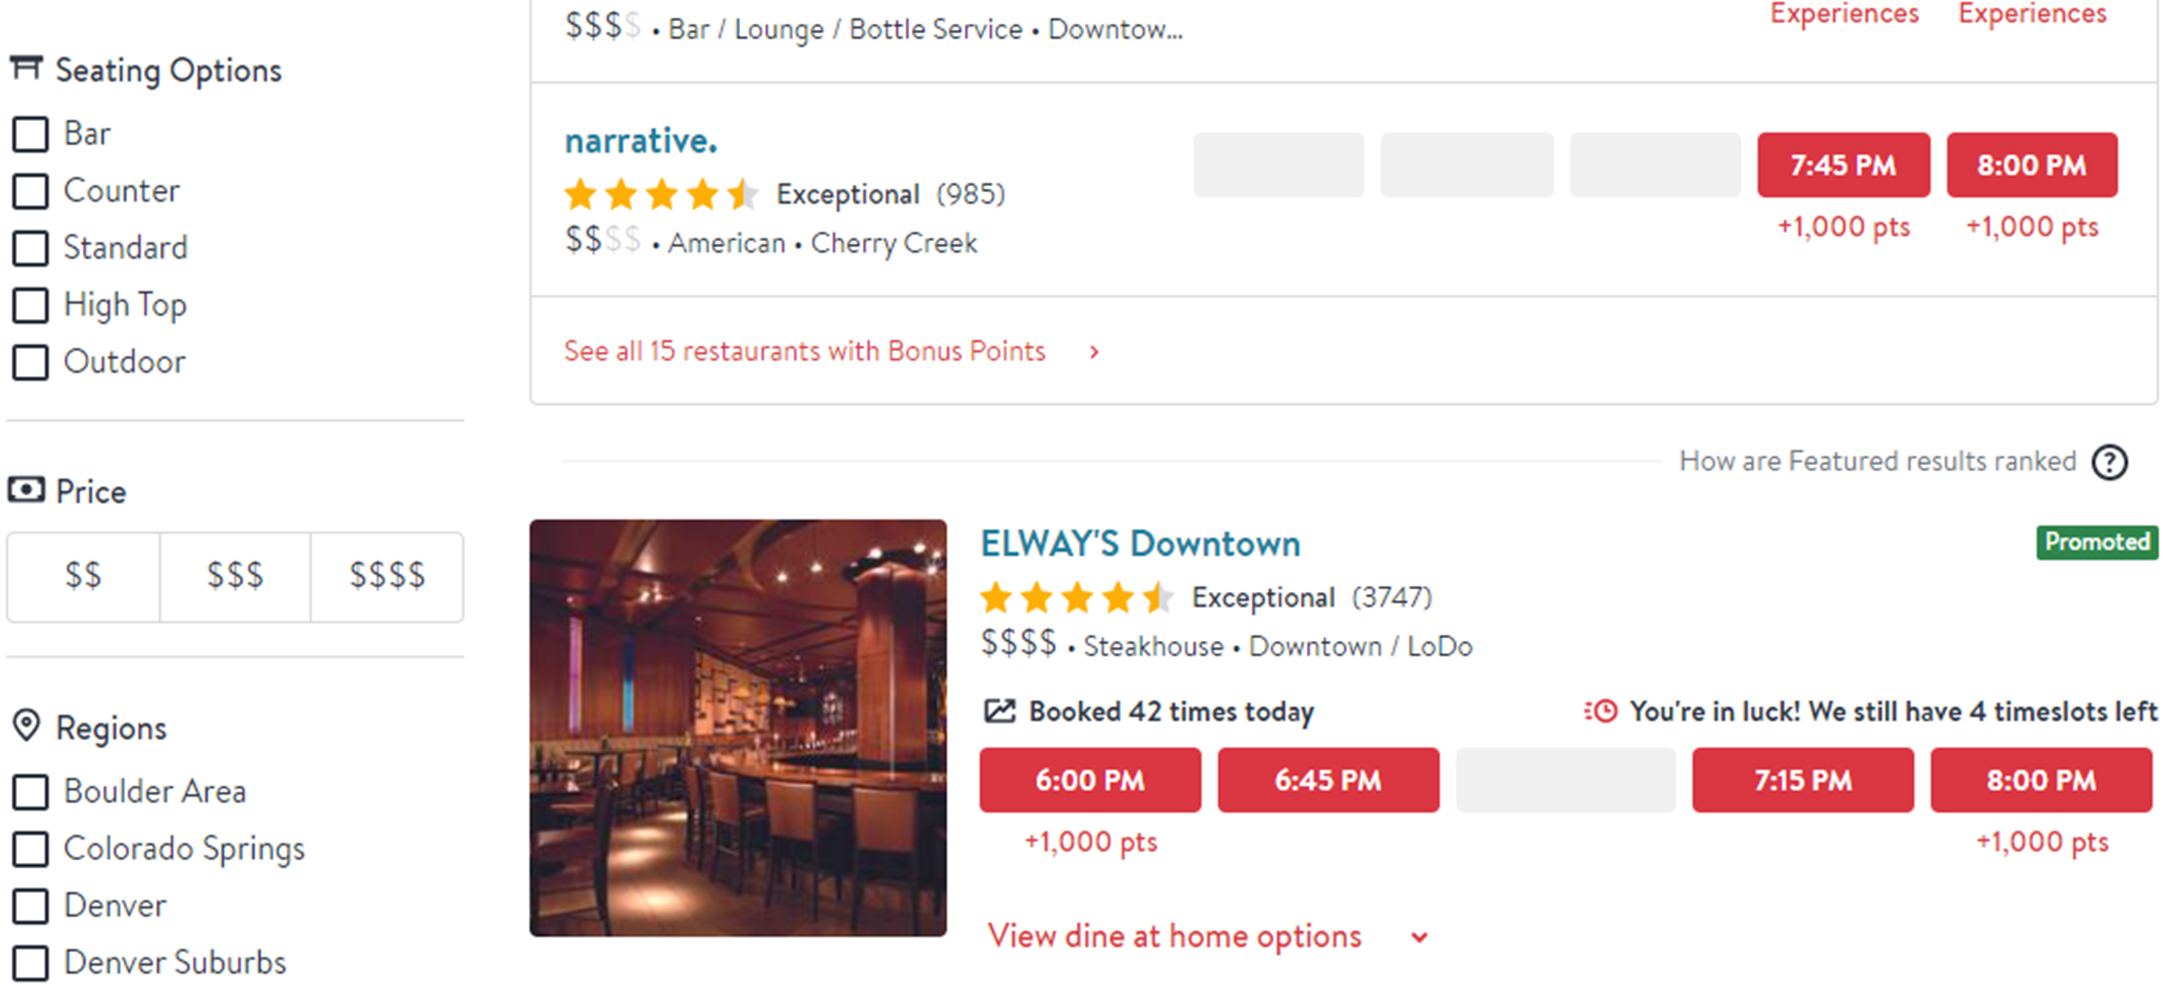
After making a general search on OpenTable, either by location, food type, etc., users can see the search results on the right and a list of filter options on the left where they can further refine their search (Figure 3). On this website, price is broken down into “$$,” “$$$,” and “$$$$” categories; each restaurant has one of these price identifiers on the search results. This filter is the fourth option from the top, making it easy for users to identify and use. Resy has a similar system of identifying restaurant price levels with varying numbers of dollar signs; however, in the overall search, there is no easy way for users to filter by price (Figure 4).
All the Relevant Information I Need for My Visit
Participants were asked to rate the extent to which the website has all the relevant information they need for their visit. OpenTable performed the best on this metric, with 45% of participants selecting Strongly Agree. Tock performed the worst with 10% of participants strongly agreeing.
When comparing the two, OpenTable not only has more information about the restaurant but this information is often embedded on the website and doesn’t require users to click any external links to find it (Figure 5). This information is more accessible, with links at the top of each restaurant page that help users find what they need, like “Overview,” “Experiences” (specialty packages users can select for different dining and menu options), “Popular dishes,” “Photos,” “Menu,” and “Reviews.” Tock’s restaurant page doesn’t have comparable links or information (e.g., the menu is found only with a link to the restaurant’s website at the bottom of the page—Figures 6 and 7).


What to Improve
Respondents had a few common problems and frustrations across the restaurant reservation websites, such as 1) clumsy search features and 2) filter information not being saved.
Specific key areas of improvement cited by respondents for each website include
- OpenTable: “I just think it would be easier to type what city and cuisine you want and have it pull that information up without looking for another checkbox…. Just a separate open field to search for the type of cuisine would even be simpler than hunting a check box.” (Figure 8.)
- Resy: “I just didn’t like how search was laid out. Let me do an advanced search where I can select stars, time, location, etc.” (Figure 9.)
- Tock: “After entering data of what I wanted, every new page I went to it all got reset. Once I did the search, it didn’t retain that information moving into the restaurant’s (landing) page.” (Figure 10.)
Figure 8: Video clip of OpenTable’s search bar, showing that the option to input a location, restaurant, or cuisine type is confined to one entry point.
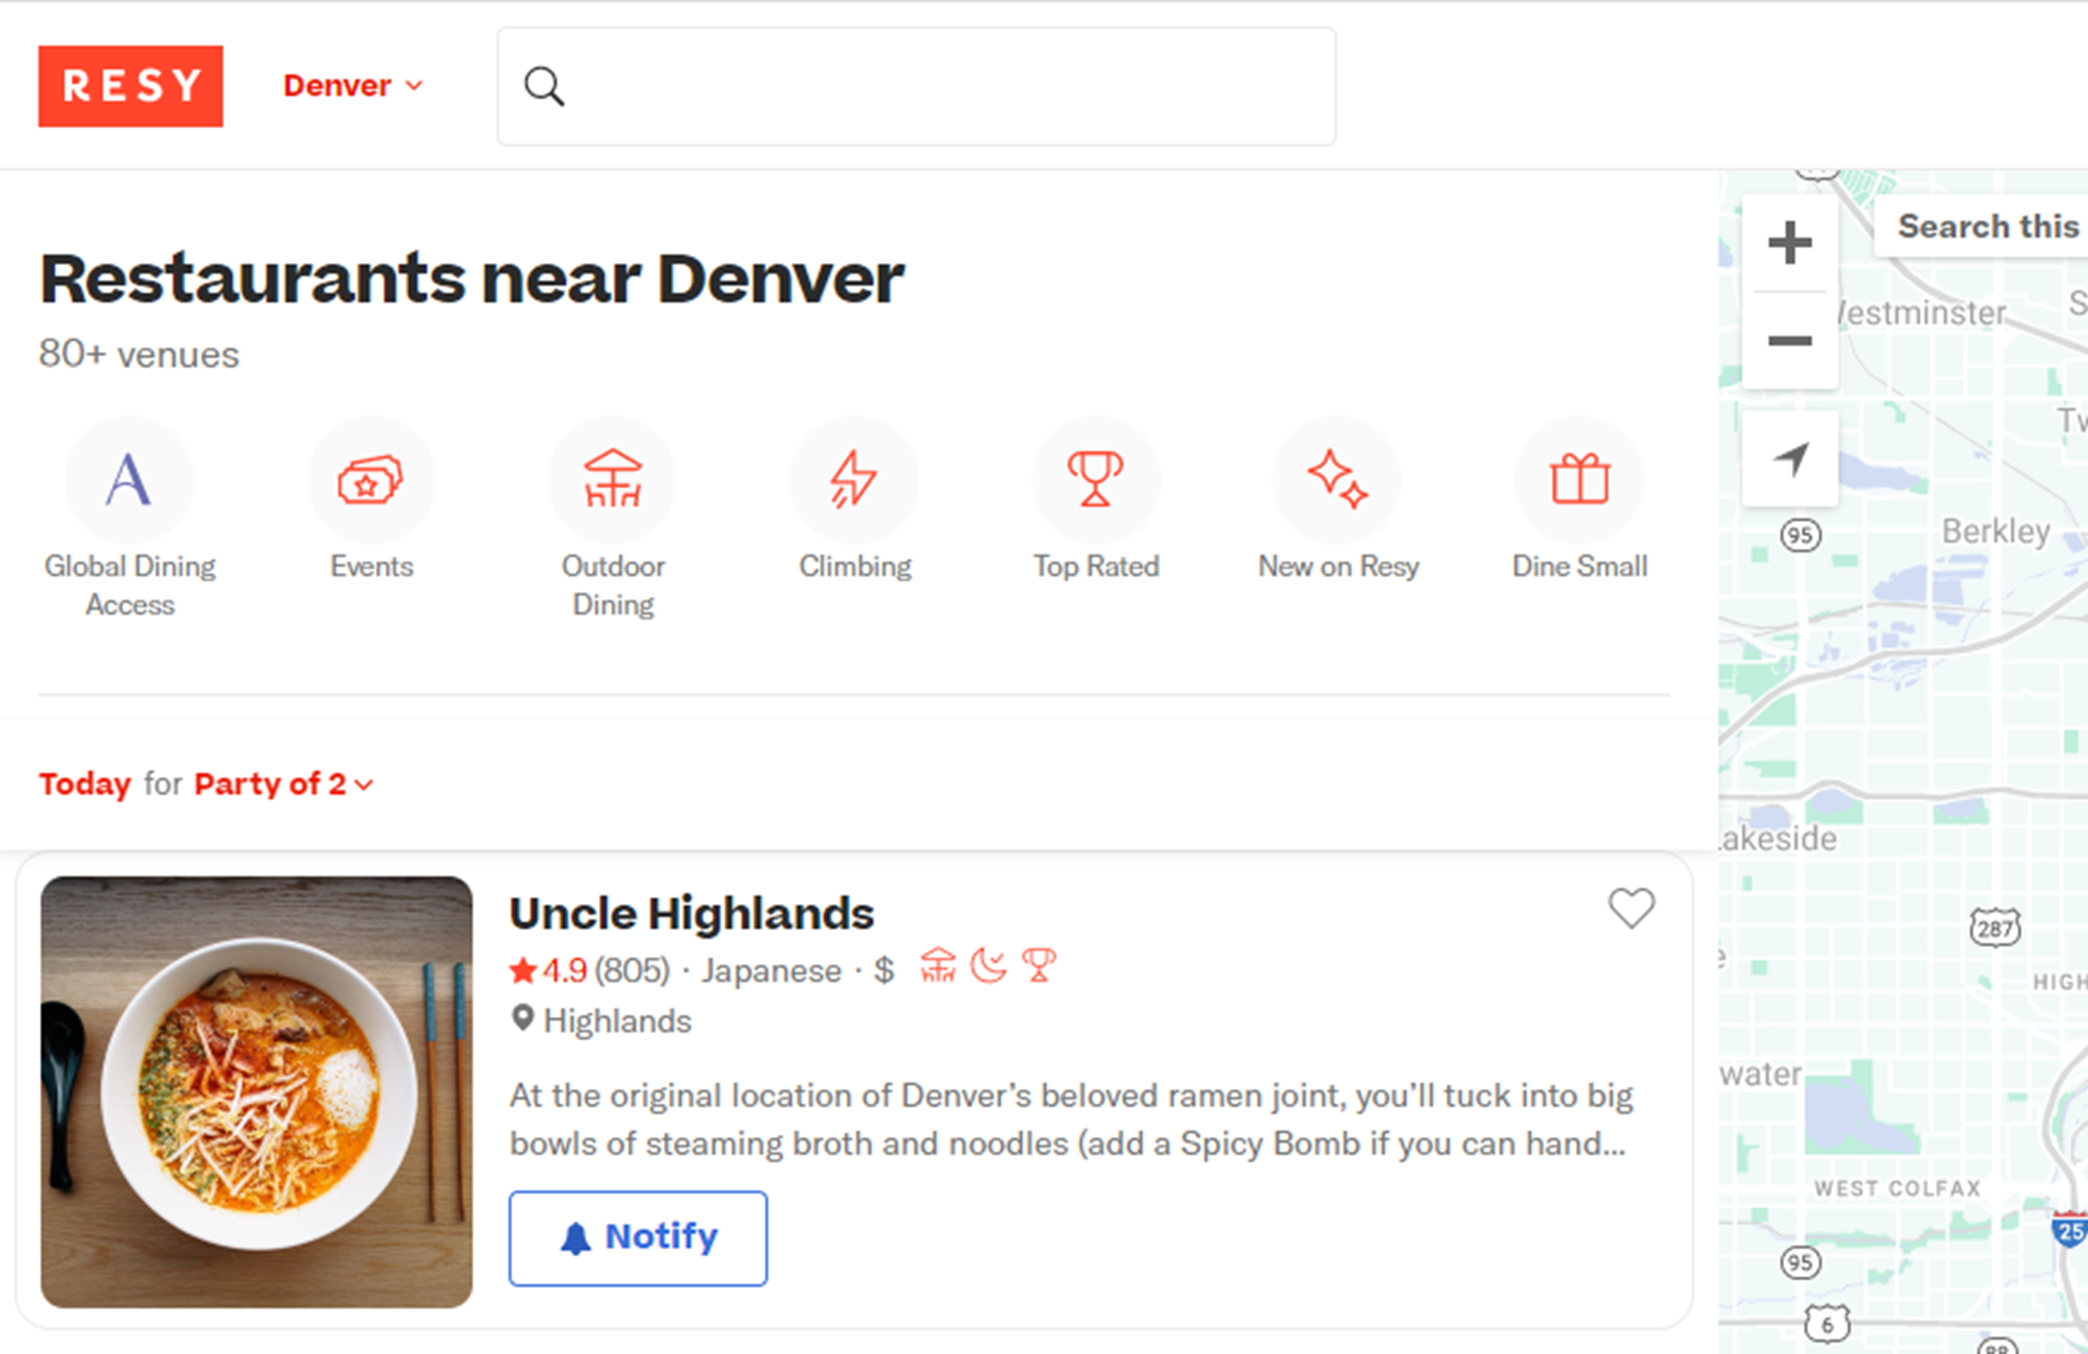
Figure 9: Video clip of Resy’s search bar, showing the lack of specific options for advanced filtering for things such as cuisine type, price, times, etc., other than the seven unrelated filter options shown.
Figure 10: Video clip of Tock showing a user on the restaurant landing page with the defaulted party size being two despite having clicked into the restaurant with a party size filter of six.
Summary and Takeaways
An analysis of the user experience of three restaurant reservation websites found that
- OpenTable leads in user experience. OpenTable had the highest SUPR-Q rating (65th percentile), and Tock had the worst (16th percentile). OpenTable had the highest NPS (14%), and Resy had the poorest (−45%). The experience of using OpenTable might be made slightly better by improving its ease of finding restaurants and menu offerings (e.g., allowing free entry search for city and cuisine).
- Checking reservation availability dominates. The top key drivers of a better experience (SUPR-Q scores) were checking the availability of restaurant reservations, having all the relevant information, and searching for restaurants by price range. Although Tock and Resy are eroding OpenTable’s market share, some features (filtering) and information (user reviews) are still lacking.
- Searching restaurants by ratings drive recommendations. Using the same set of low-level predictors as in the SUPR-Q KDA, the top key drivers of LTR were “It’s easy to search for restaurants by ratings” (17%), “It’s easy to search for restaurants by price range” (16%), and “The reviews are helpful” (11%). OpenTable had the highest scores in each category.
- Searching and filtering caused problems. Respondents had a few common problems and frustrations across the restaurant reservation websites (e.g., using the search bar feature and filter information not being saved).
Full details are available in the downloadable report.
")

")