 Changing the number of response options in the survey might confuse participants.
Over the years, we’ve heard variations on this concern articulated a number of different ways by clients and fellow researchers.
Surveys and unmoderated UX studies commonly contain a mix of five-, seven-, and eleven-point scales. That leads some to express concern. Why are there different numbers of points? Why not just keep them all the same, say, all five-point scales?
A recommended practice in UX research is to use standardized items such as the Single Ease Question (SEQ®), UX-Lite® (which has two items, one for rating perceived ease-of-use and one for rating perceived usefulness), and Likelihood-to-Recommend (LTR).
That makes sense. Once an item is widely used and its measurement properties are well understood, researchers should be reluctant to modify them in any way, other than the most cosmetic (e.g., simple word changes such as “system” to “product”).
A consequence of maintaining item standardization is that research participants will often be confronted by a sequence of rating scale items that have different numbers of response options. For example, the standard version of the SEQ has seven response options, the UX-Lite has five, and LTR has eleven.
We’ve researched many aspects of rating scale formats over several decades and do our best to stay on top of the literature. As far as we know, no one has specifically studied this potential effect on rating behavior. Consequently, we’ve had little to point people to when this concern has come up.
So, we conducted an experiment to see whether changing scale points within a study affected scores, whether people even noticed, and if so, whether they were bothered by the changes.
Experimental Design
Using our MUIQ® platform for conducting unmoderated remote UX studies, we set up an experiment to compare participant experiences in which the number of scale points did or did not vary to see whether that impacted the results.
The Greco-Latin design. We set up a Greco-Latin experimental design to support a within-subjects comparison of two sequences of items when rating experiences with easy and hard tasks. We collected data from 279 participants (sampled in June 2022 from a U.S. panel provider).
In this experimental design, there were three independent variables:
- Item Sequence: A sequence of SEQ, UX-Lite, and LTR items either with varying numbers of response options (standard) or unvarying numbers of five response options (alternate)
- Rating Context: Easy or hard task (retrospective ratings)
- Order of Presentation: The Greco-Latin design had four orders of presentation:
- Varying/easy then unvarying/hard (n = 71)
- Varying/hard then unvarying/easy (n = 70)
- Unvarying/easy then varying/hard (n = 71)
- Unvarying/hard then varying/easy (n = 67)
There were two tasks in this retrospective study:
- Easy task: We’d like you to think back to your most recent purchase on Amazon.com and recall what you purchased and how easy or difficult the experience was.
- Hard task: We’d like you to think back to when you purchased your most current mobile phone. Recall as best you can how easy or difficult it was to understand the total cost of the plan, including the cost of the phone and the total monthly cost including all taxes and fees.
The item sequences. Figures 1 and 2 show the two item sequences. Unintentionally, the endpoint anchors for the two items of the UX-Lite (Ease: “easy to use”, Useful: “features meet my needs”) were the same as those for the SEQ instead of the standard (“Strongly disagree”, “Strongly agree”), but this was the same for both sequences so any effect of this nonstandard UX-Lite anchoring should be the same across the experiment.
Using this design, all participants rated a hard and an easy task and were presented with the varying (standard) and unvarying (alternate) versions of the rating scales. After experiencing both conditions, participants indicated whether they had noticed any difference in the rating scales and what that difference was. Those who noticed that there were different numbers of response options in the two item sequences were asked which, if either, they preferred, and why.
Participants were randomly assigned to one of the four orders of presentation. Across the experiment, this controls for the “nuisance” variable of order of presentation while enabling balanced analysis of item format and task difficulty. It also enables a purely between-subjects analysis using data from the first condition participants experienced in their assigned presentation order.
Possible response patterns. Before getting to the results, it’s important to have an idea about what different response patterns would mean. In other words, which response patterns would indicate a difference in response behavior due to varying or unvarying item sequences and which would not?
Figure 3 shows two possible outcomes that would be indicative of no effect of item sequence. (Data collected with different scales requires conversion to a common scale, so in our analyses, all item scores are interpolated to 0–100-point scales.)
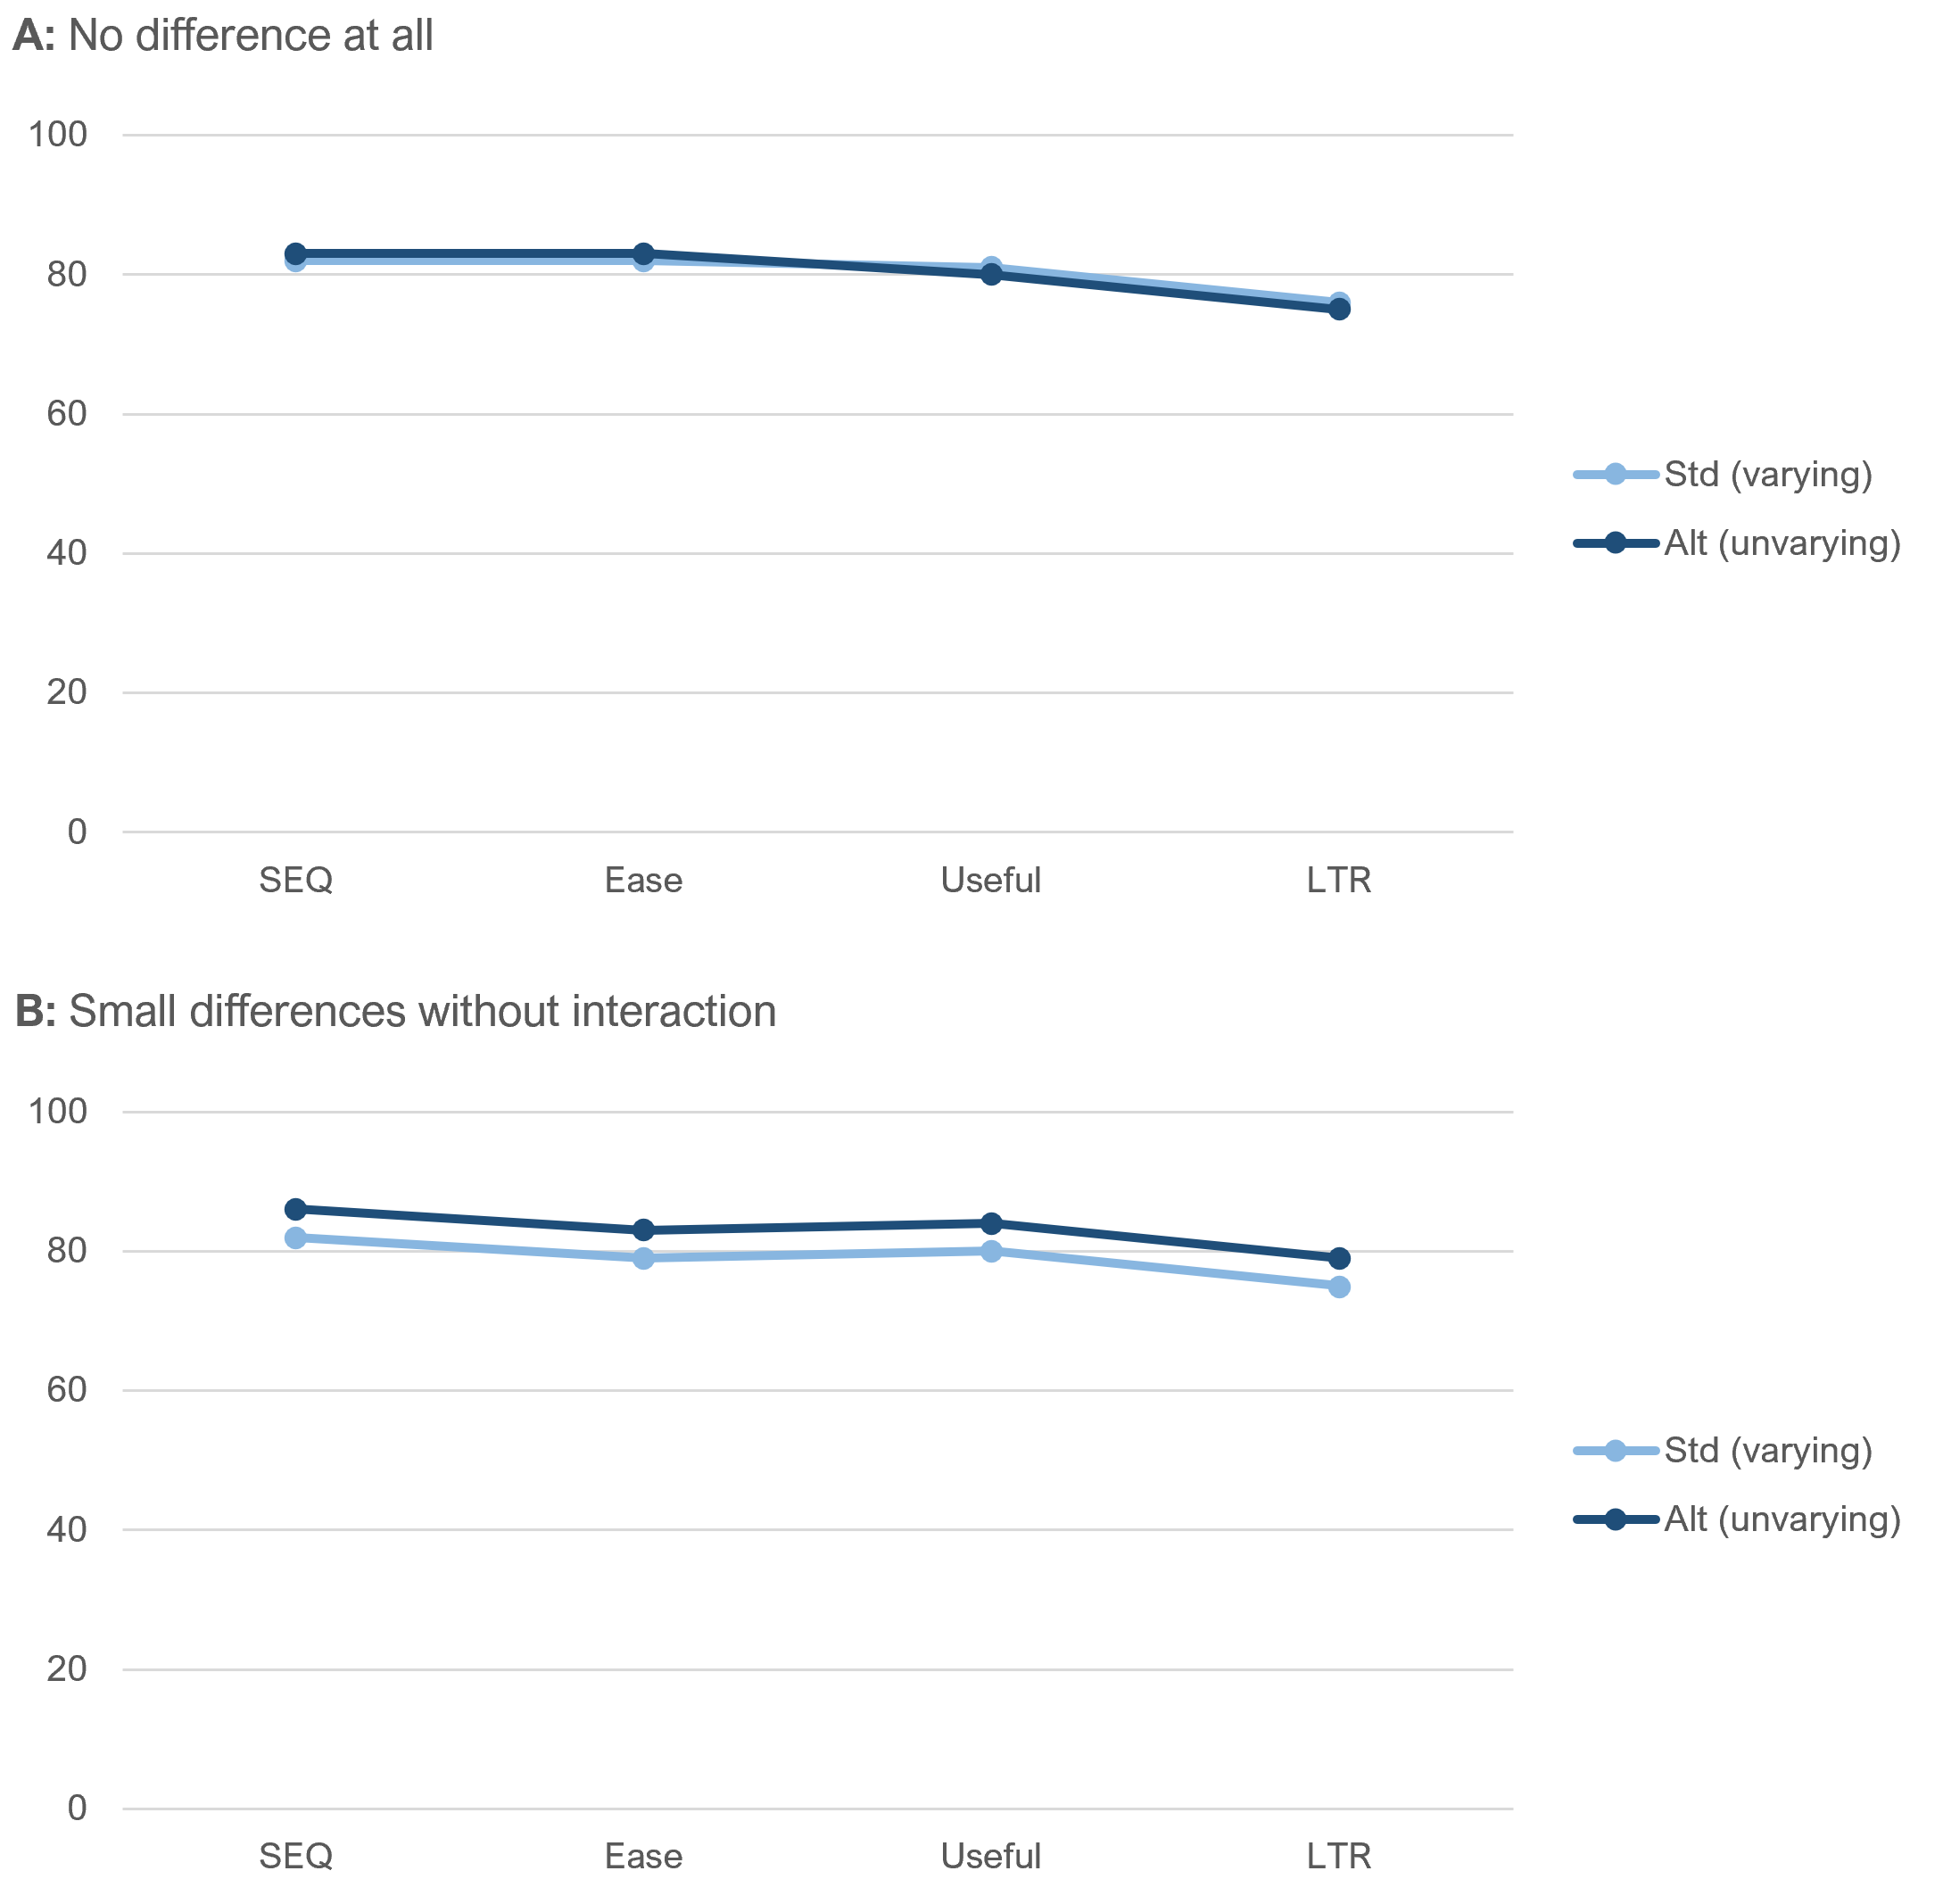
Panel A in Figure 3 shows the results expected if there were no differences at all in the rating behaviors. Even though Panel B shows a slight difference in the standard and alternate profiles, the transitions from SEQ to Ease and Useful to LTR have the same magnitude (3 points on the 0–100-point scale) in the same direction, even though in the standard sequence the number of response options changed from 7 to 5 for SEQ to Ease and 5 to 11 for Useful to LTR.
What would we expect if item sequence made a difference? Figure 4 illustrates two possibilities. Maybe the transition from more to fewer response options tends to increase ratings while a transition from fewer to more response options tends to decrease ratings (Panel A), or maybe the effect is in the opposite direction (Panel B).
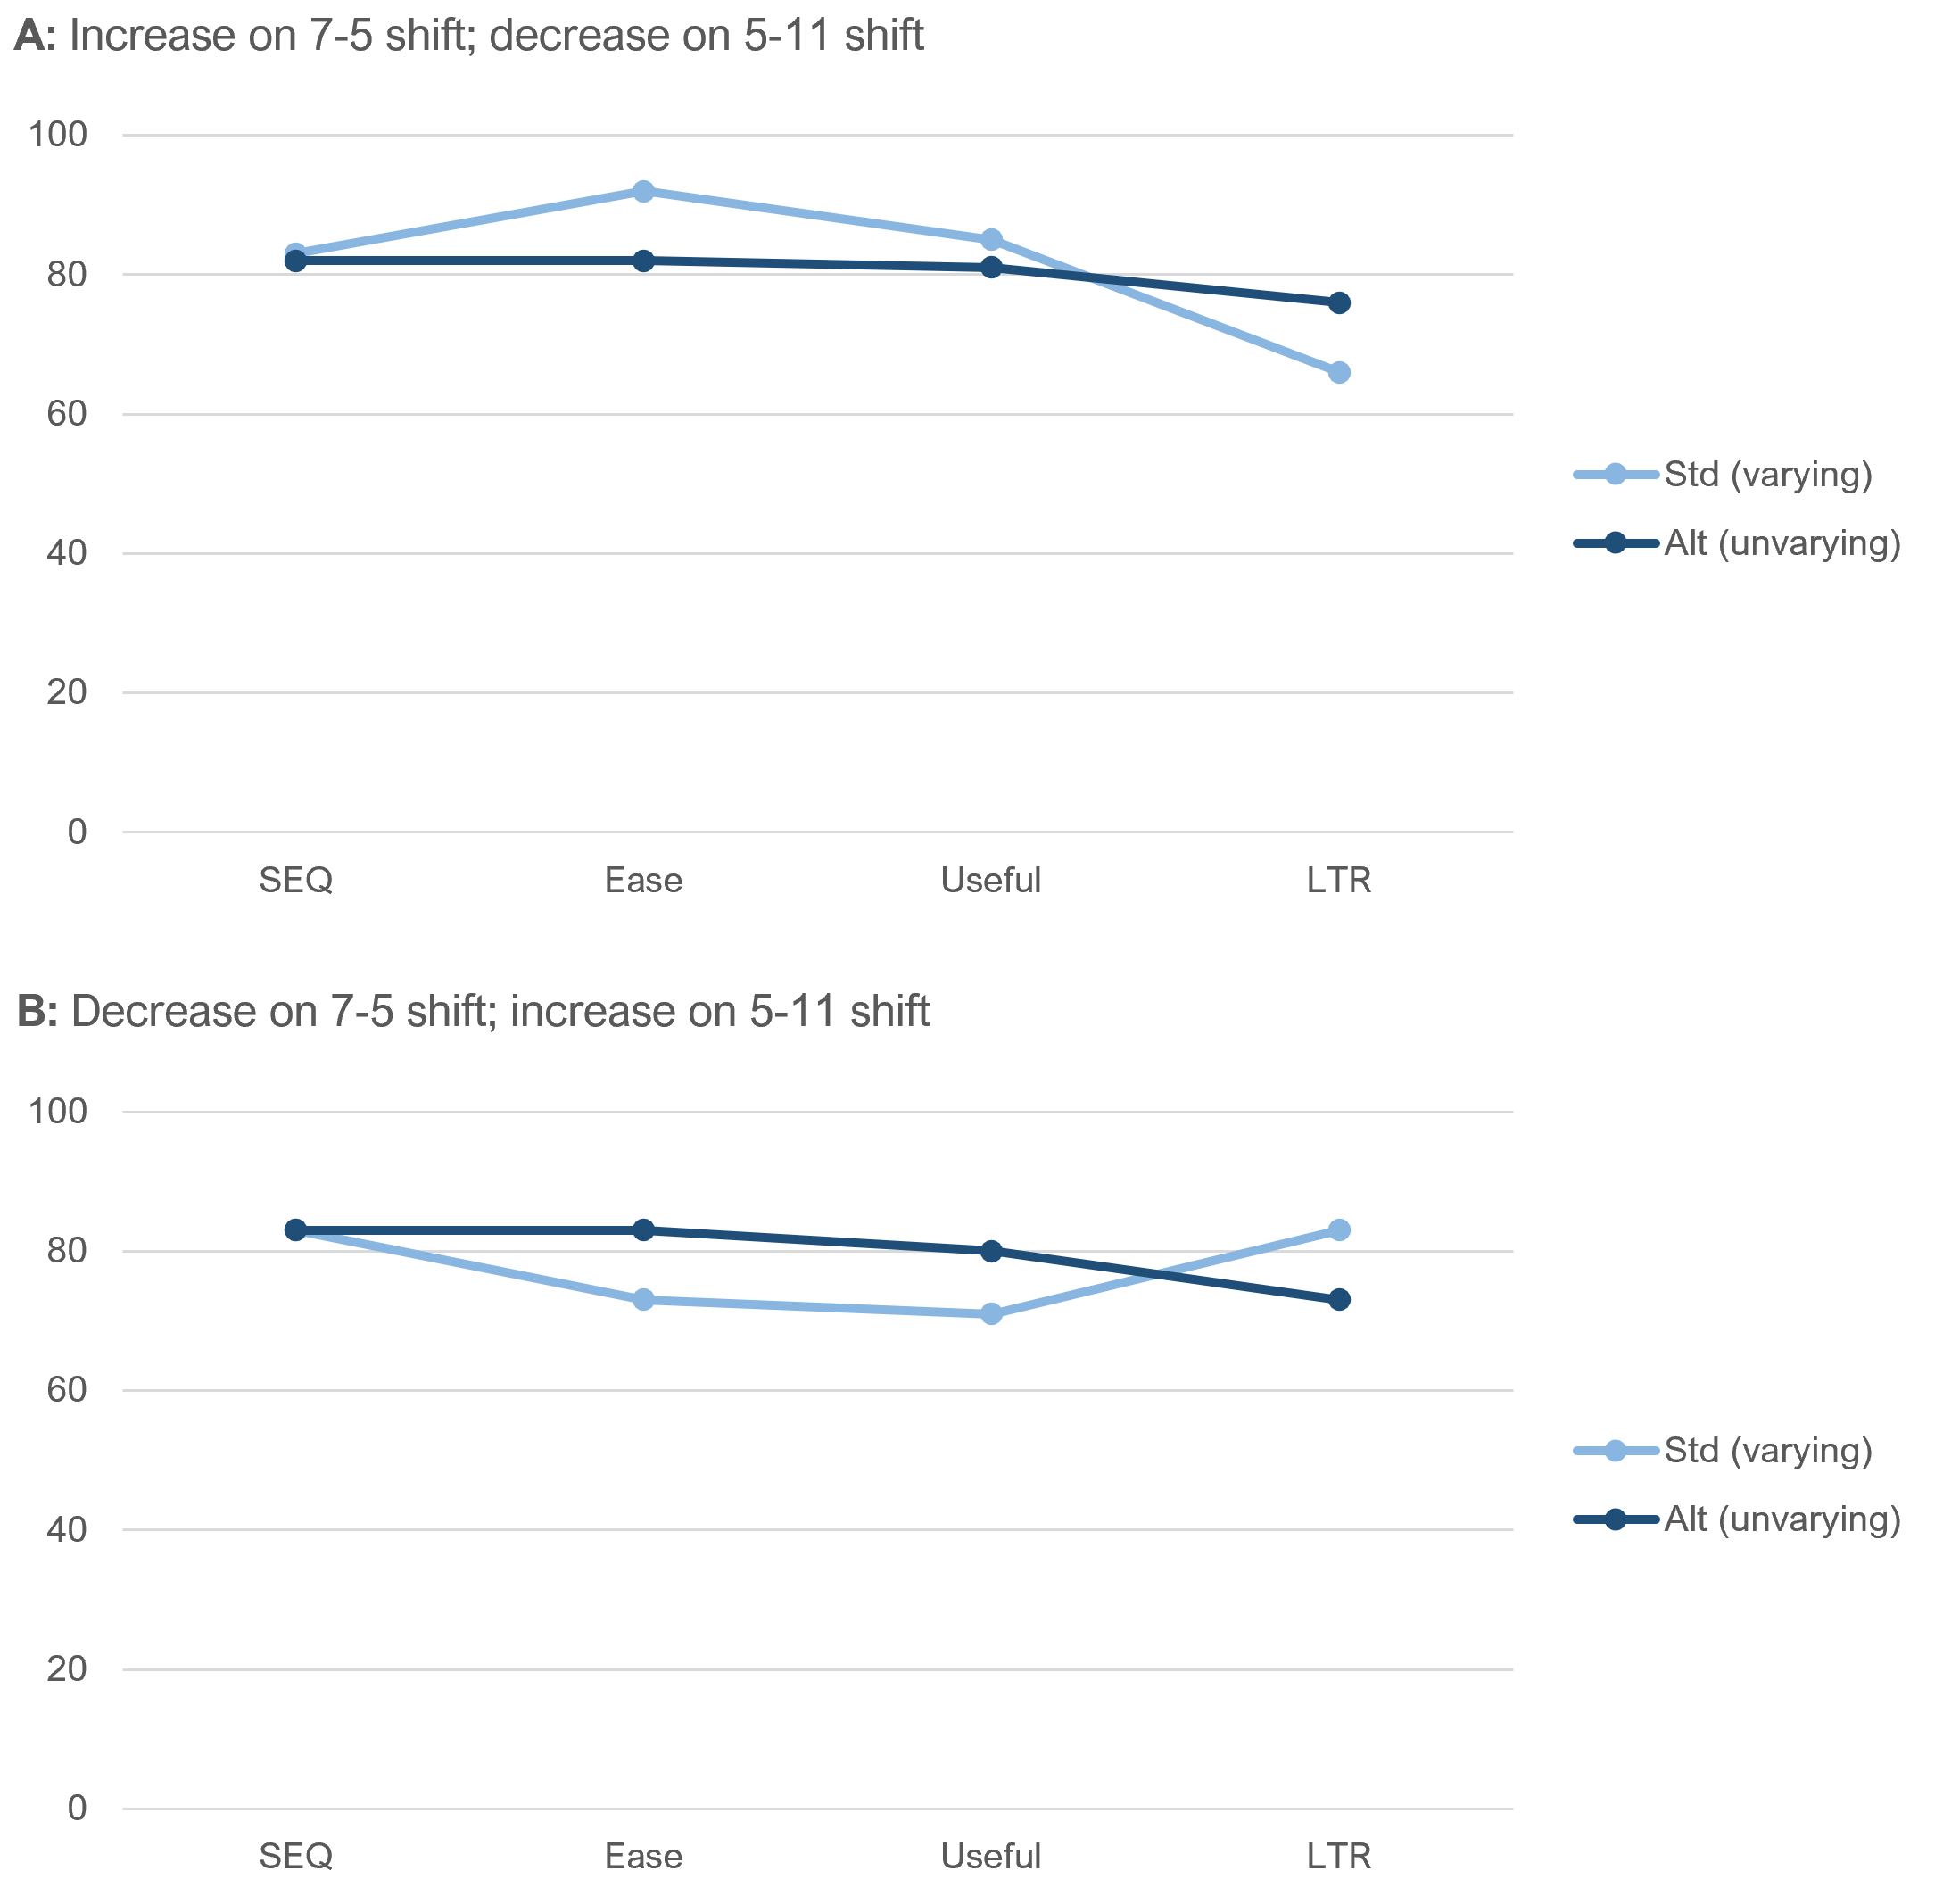
So, when interpreting the results, our primary focus is going to be on what happens in the transitions from SEQ to Ease and from Useful to LTR. Interactions (nonparallel lines) at those transitions will be evidence that the item sequence affected response behaviors. The absence of interaction is indicative of no effect of item sequence.
Results
We conducted analyses of means and top-box scores, both with all the data (within-subjects) and just initial ratings (between-subjects). In this kind of experiment, there is value in both types of analysis because the strengths and weaknesses of within- and between-subjects experimental designs are complementary. For example, within-subjects analyses are more sensitive to the detection of statistically significant effects and allow for assessment of preference, while between-subjects analyses are immune to the possibility of asymmetric transfer.
Was the Easy Task Actually Perceived as Easier than the Hard Task?
We conducted a manipulation check to ensure the tasks differed in their levels of perceived ease (Figure 5). All differences between ratings of easy and hard tasks were statistically significant (all p < .0001). That’s not too surprising given that one task was intended to be hard and one easy, and their relative difficulty has been validated in our earlier research. But it’s good to verify.

Did the Item Sequence Affect the Means?
We analyzed the effect of item sequence on item means, both overall and as a function of task difficulty.
Overall means. Figure 6 shows the overall within- and between-subjects differences in mean ratings for the two item sequences.
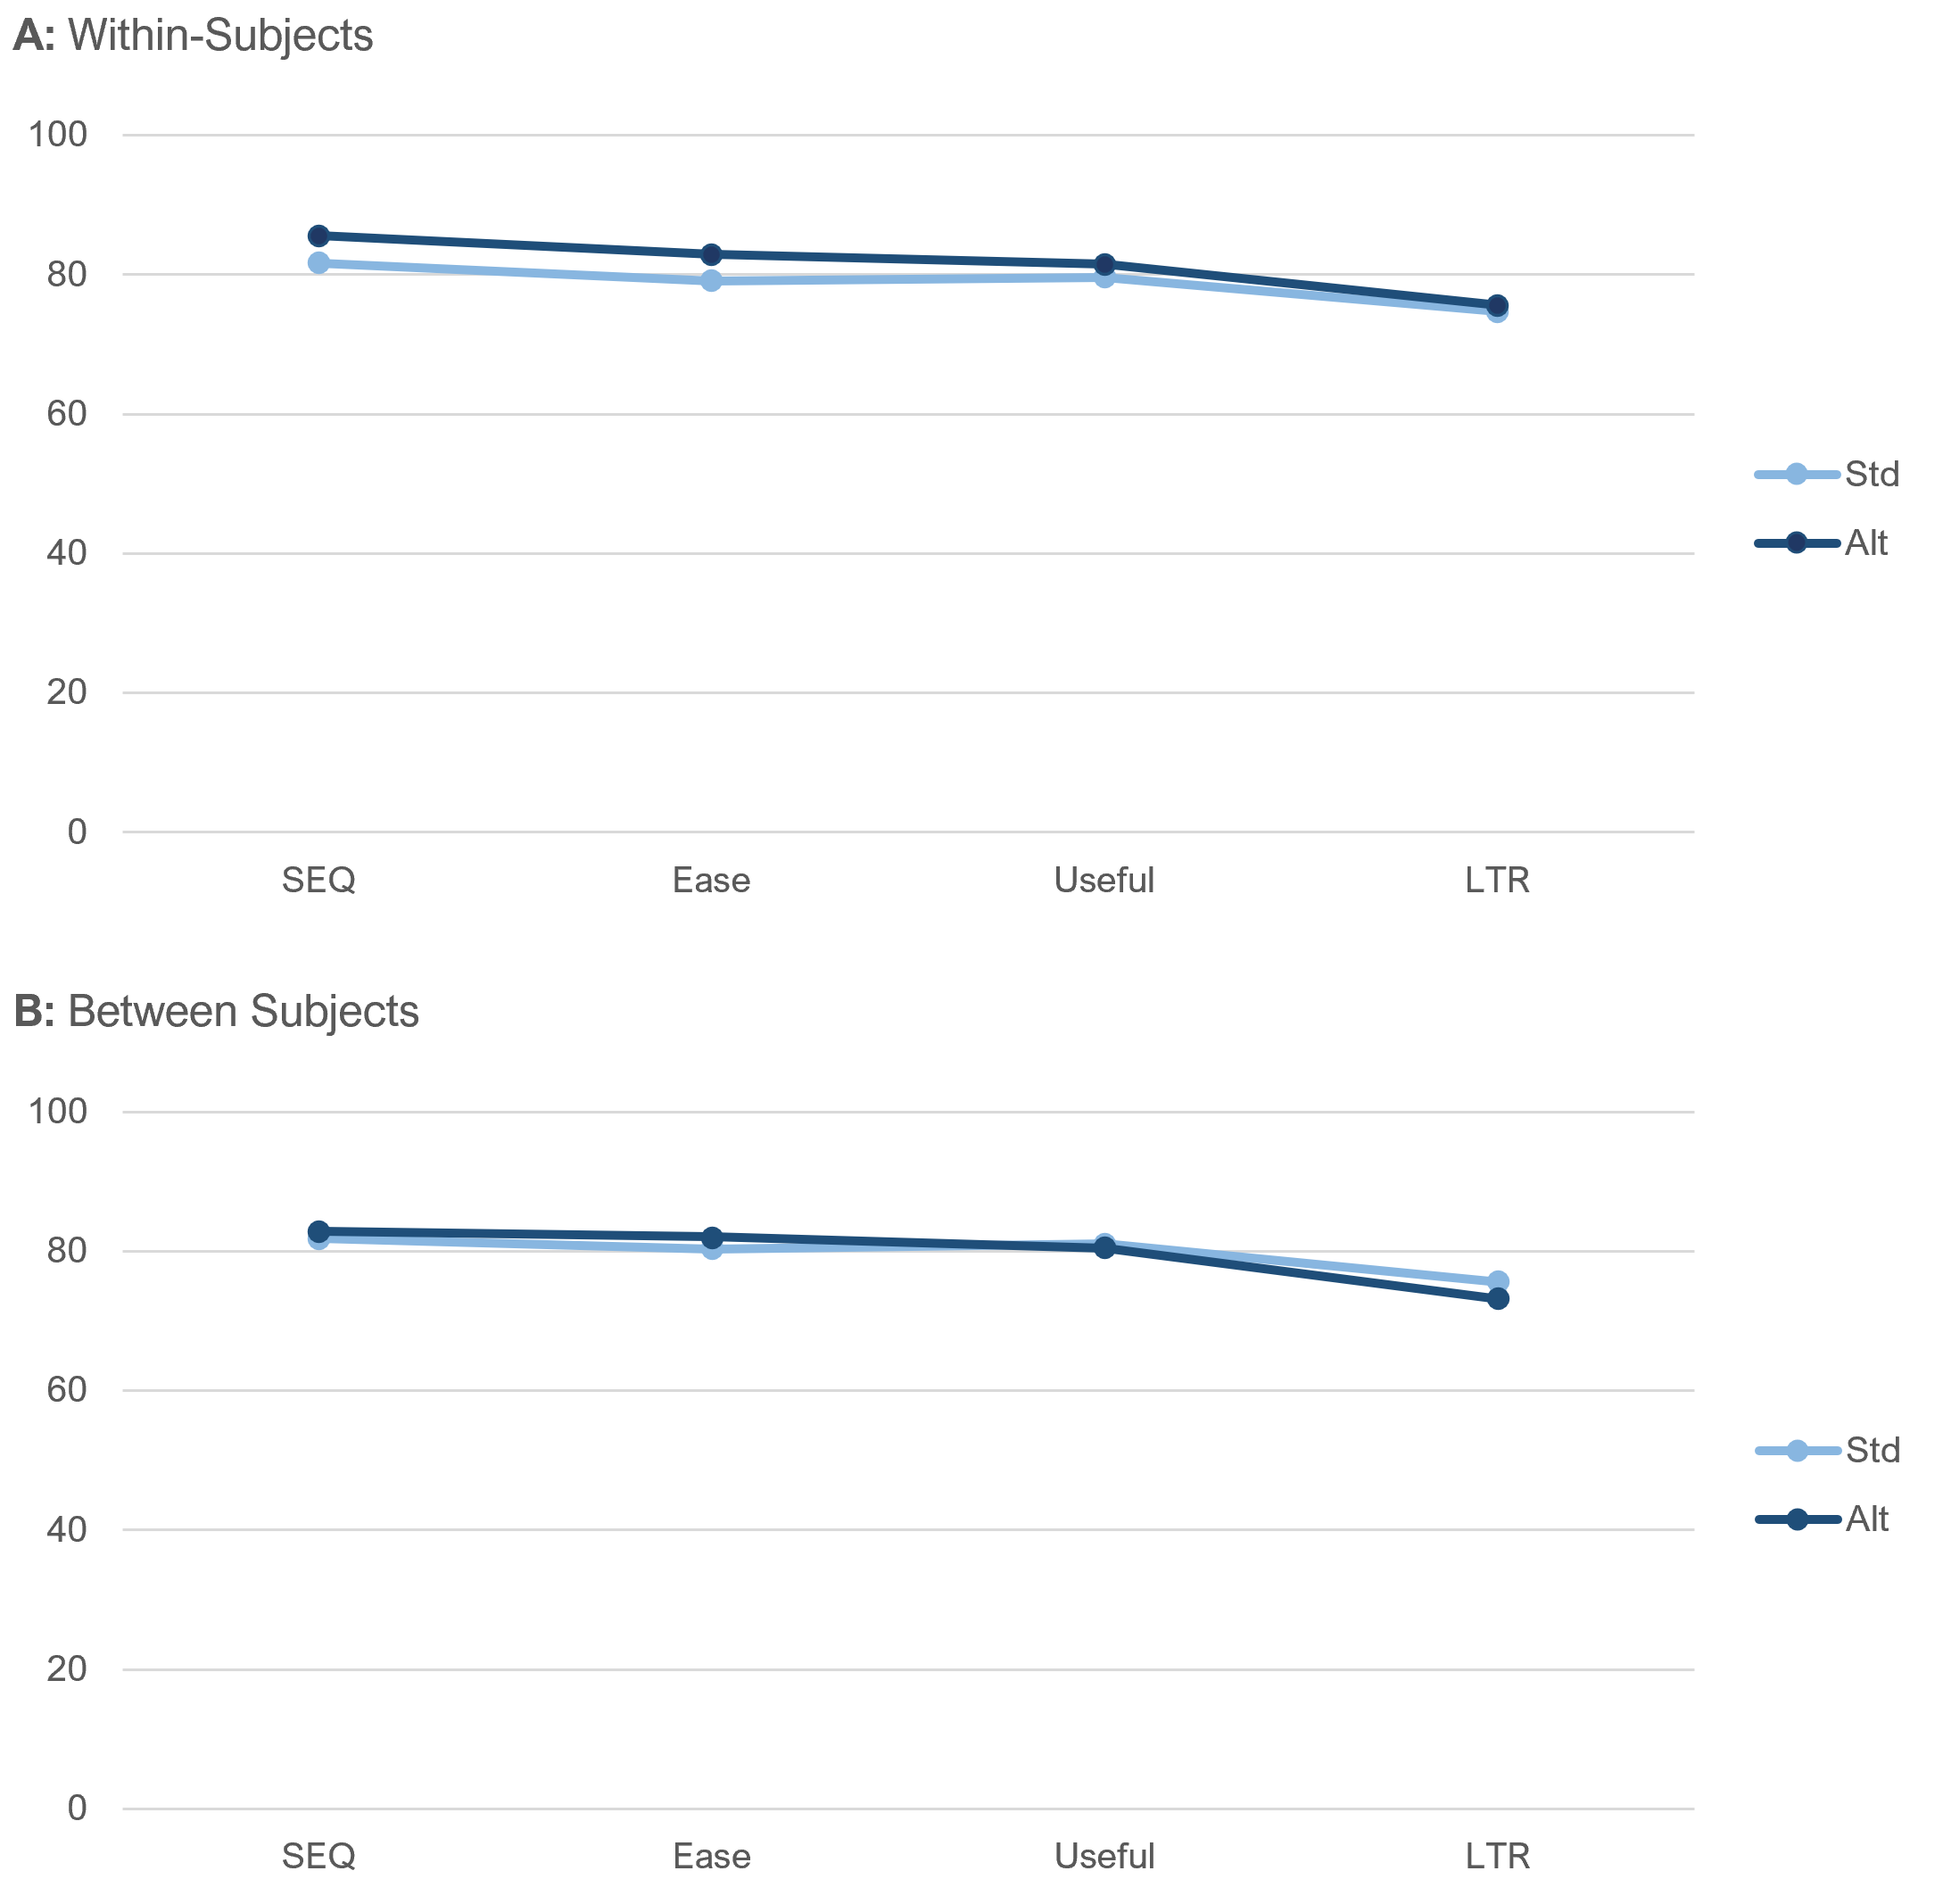
None of the differences between standard and alternate item sequences were statistically significant (all p > .05). In the within-subjects results, two differences in item sequences were large enough to warrant attention (SEQ: p = .06, mean difference = 3.9; Ease: p = .10, mean difference = 3.8).
As discussed previously, the differences between standard and alternate item sequences for each item are less important than the transitions from SEQ to Ease (where the number of response options changed from seven to five in the standard condition) and from Useful to LTR (where the number of response options changed from five to eleven in the standard condition).
In Figure 6 Panel A, even though the differences between mean ratings as a function of item sequence approached statistical significance for SEQ and the UX-Lite Ease item, there was no significant change in the magnitudes of the differences (3.9 for SEQ, 3.8 for Ease, p = .93). The rating behavior stayed the same for the within-subjects analyses of SEQ and Ease (compare with Figure 3 Panel B). For the other key transitions (SEQ to Ease between-subjects and Useful to LTR for within- and between-subjects), the rating behaviors for the two item sequences were essentially identical (compare with Figure 3 Panel A).
Means by task difficulty. Figure 7 shows the within- and between-subjects differences in mean ratings for the two item sequences for each level of task difficulty.
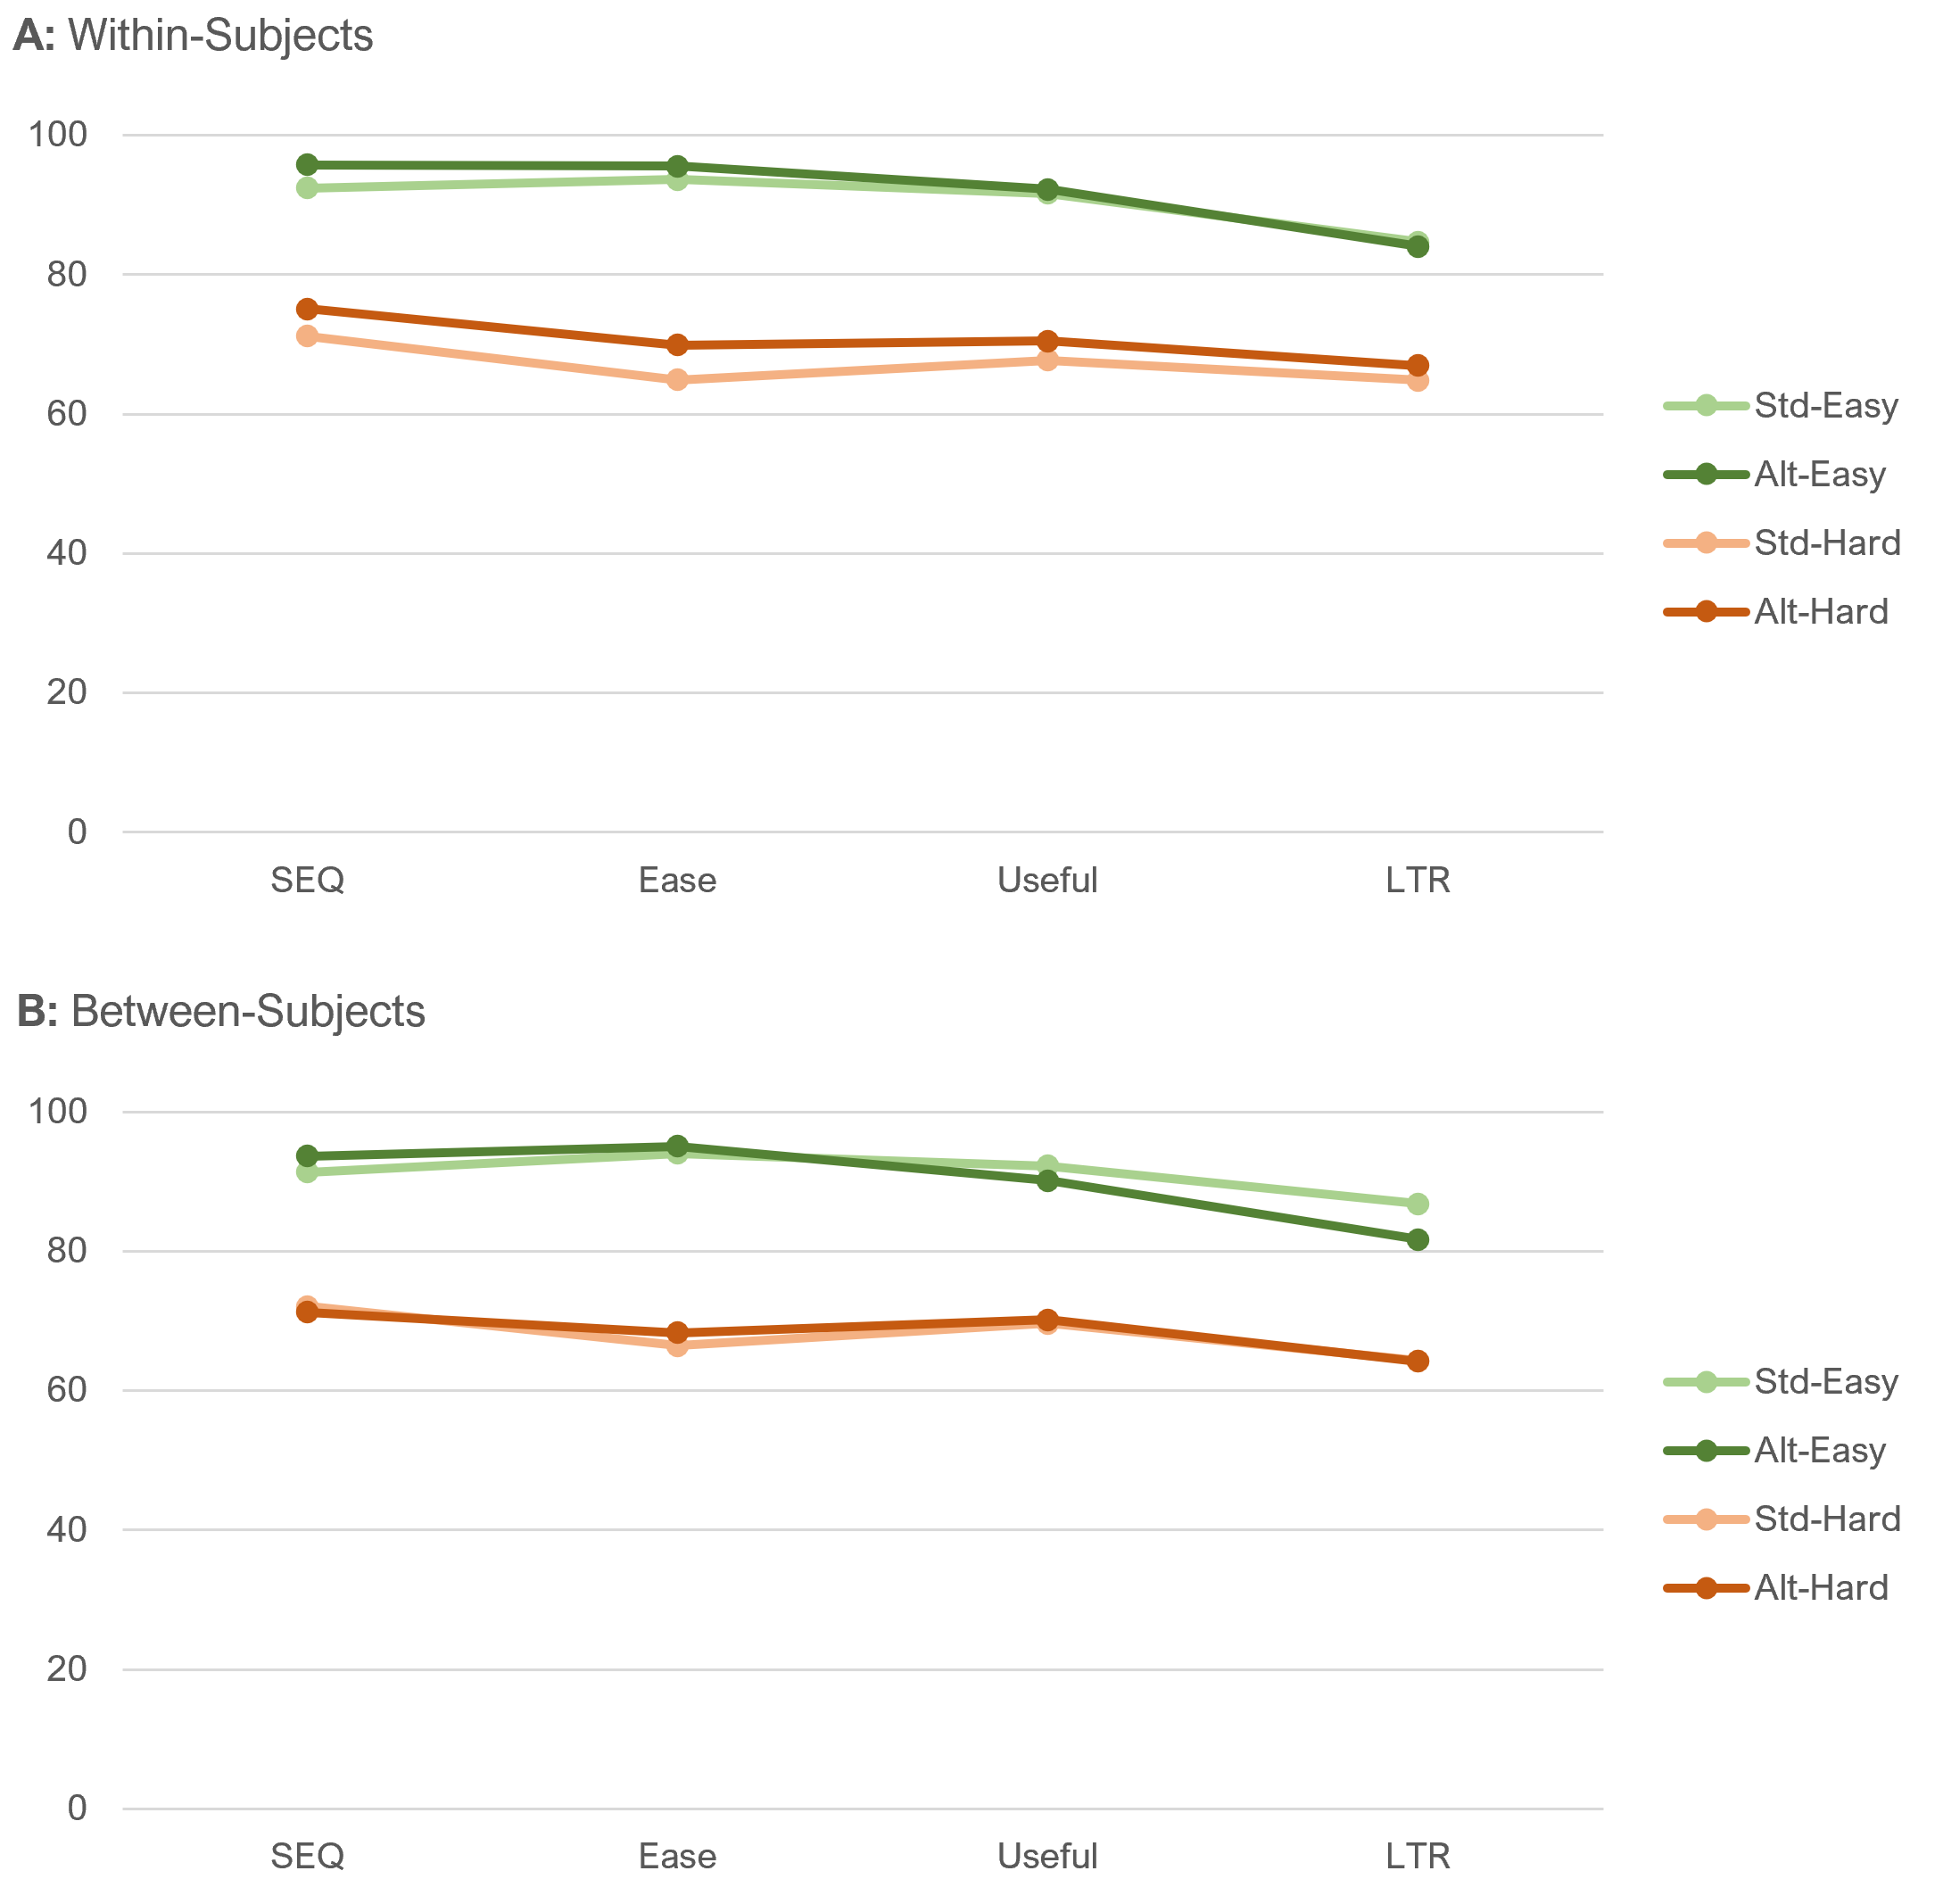
Analysis of both the within- and between-subjects results shown in Figure 7 indicated highly significant main effects of task difficulty, but no significant main effects of item sequence or task difficulty by item sequence interaction.
The largest observed effect in these results is the 5.1 difference in LTR for the easy task in Panel B (between-subjects). Although this difference warrants some attention, it was not statistically significant (t(140) = 1.46, p = .15). We could try to craft a narrative to explain why this might have happened, but because it was not statistically significant and no other effects were this large, it is more appropriate to wait to see whether this happens again in a replication before investing in explanatory hypotheses. In this experiment, there was no apparent effect of item sequences on item means.
Did Item Sequence Affect Top-Box Scores?
Another popular way to summarize the results of rating scales is to compute their top-box scores or, in the case of LTR, its top-two-box score.
Because the LTR item has so many response options, we computed its top-two-box score for comparison with the top-box score of the UX-Lite Useful item. This is consistent with the protocol for assigning the top two response options of the LTR (9 and 10) to the Promoter category when converting LTR to a Net Promoter Score (NPS). The top-box score of a five-point scale covers 25% of the range from 1 to 5; the top-two box of an eleven-point scale covers 20% of the range from 0 to 10—not identical, but closer than the 10% of the range for the top-box score of an eleven-point scale.
Overall top-box scores. Figure 8 shows the overall comparisons between top-box scores for within- and between-subjects analyses for the two item sequences.
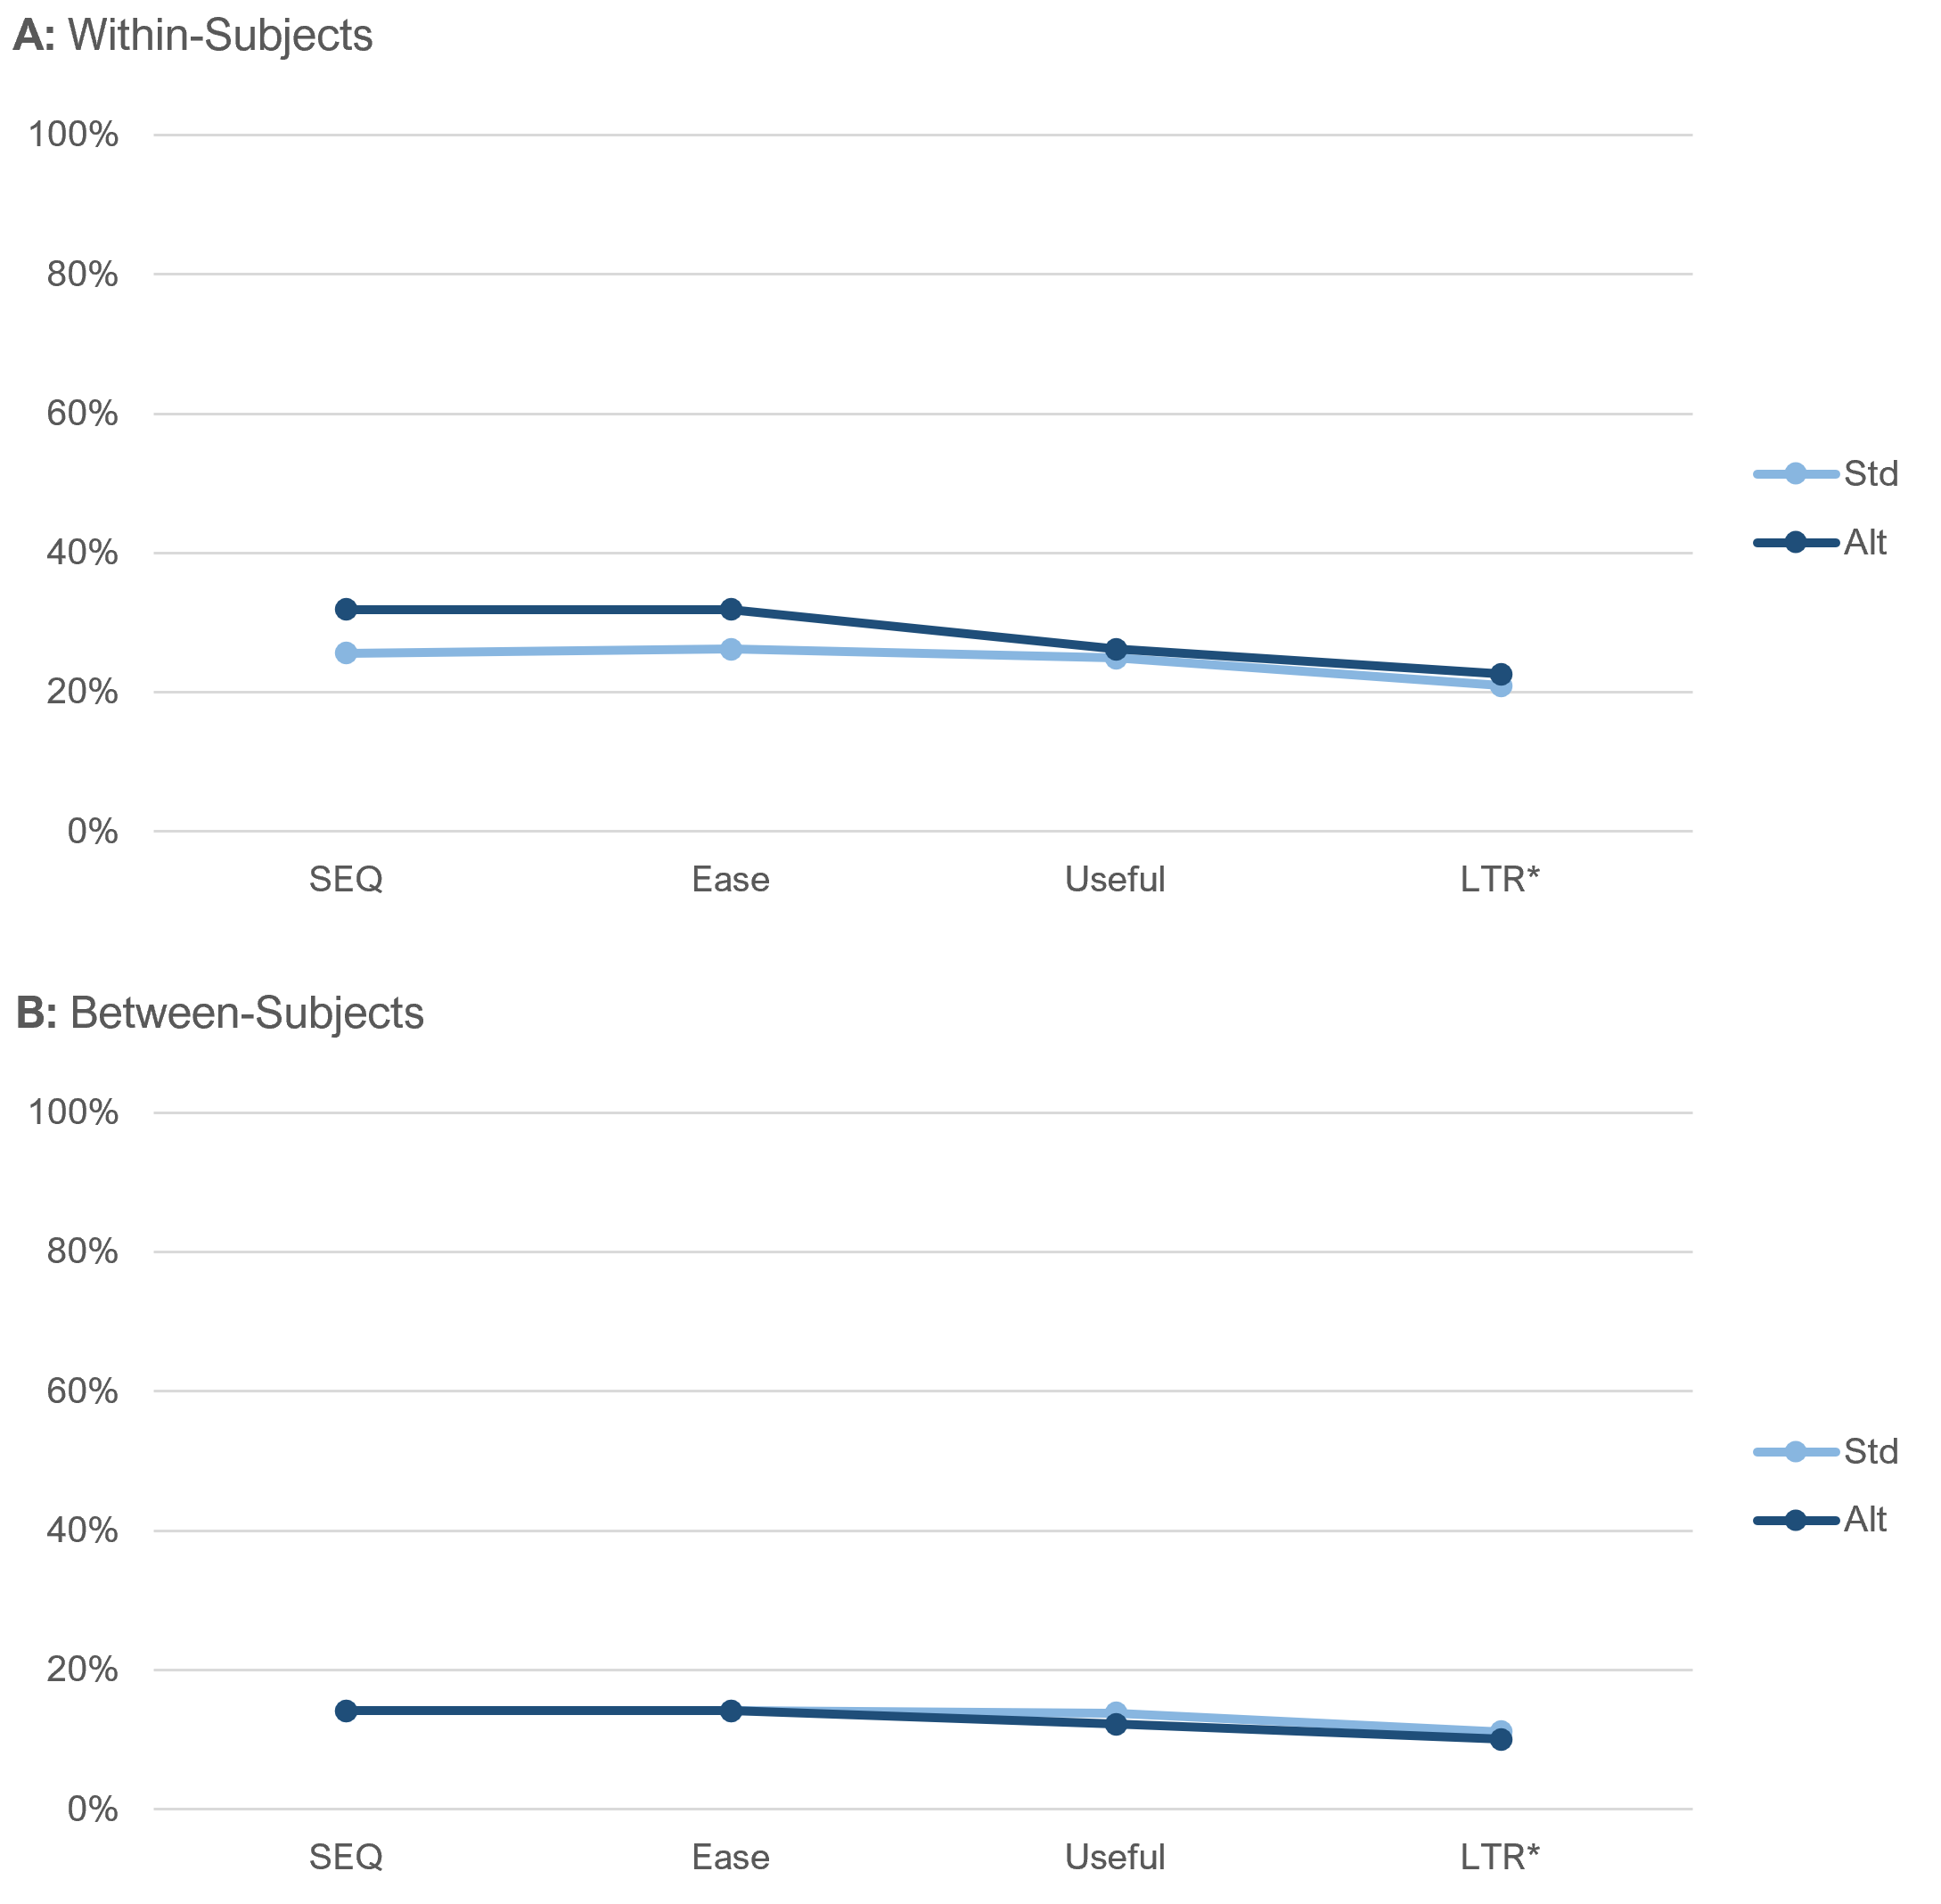
The pattern of top-box scores closely matched the patterns of means in Figure 6. With two exceptions, the standard and alternate scores were virtually identical. The exceptions were the differences for SEQ and Ease in the within-subjects analyses (neither was statistically significant). However, as discussed previously, if the change in the standard sequence from seven points for the SEQ to five points for the UX-Lite Ease item affected rating behavior, we would expect a measurable change in the transition relative to the alternate (unvarying) sequence. That didn’t happen. The difference in top-box scores for SEQ was 6.3%, and for Ease, it was 5.7%—a nonsignificant shift of just 0.6% (compare with Figure 3 Panel B).
In both panels of Figure 8, the transitions from Useful top-box scores to LTR top-two-box scores were virtually identical (compare with Figure 3 Panel A).
Top-box scores by task difficulty. Figure 9 shows the within- and between-subjects differences in top-box scores for the two item sequences for each level of task difficulty. Both panels of Figure 9 clearly show the significant main effect of task difficulty (manipulation check). The between-subjects analyses (Panel B) show no differences for the two item sequences in their transitions from SEQ to Ease or from Useful to LTR.
The within-subjects analyses also showed no differences for the two item sequences in their transitions from Useful to LTR. Consistent with the overall analyses of top-box scores, even though there were nominal differences in SEQ and Ease top-box scores for the two item sequences, there were no large differences in the transitions from SEQ to Ease.
As shown in Figure 2 (alternate unvarying sequence), there were only minor item format differences between SEQ and Ease, both of which were collected with five-point scales and both of which are measures of perceived ease-of-use. Figure 9 Panel A shows that for the alternate unvarying sequence, the top-box scores remained the same for the SEQ-to-Ease transition for both the easy task (43.0%) and the hard task (20.8%).
For the standard (varying) item sequence, the change in top-box scores from SEQ to Ease were not identical, but they were also not very large (easy task: 35.8% to 39.1%, a difference of 3.3%; hard task: 15.4% to 13.3%, a difference of 2.1%).
Consistent with the analysis of means, there was no apparent effect of item sequences on top-box scores.

Which Version Did Participants Prefer?
After attempting both tasks, participants were asked whether they had noticed a difference in the rating scale sequences they had used and, if so, what it was. As shown in Figure 10, over 80% of participants indicated they had not noticed any difference. Only 36 participants (12.9%) indicated they had noticed the difference and selected the correct choice from a list of plausible differences. Eighteen participants (6.5%) selected a distractor.

Figure 11 shows the preference percentages for the participants who had correctly identified that the difference in the item sequences had to do with the number of response options.
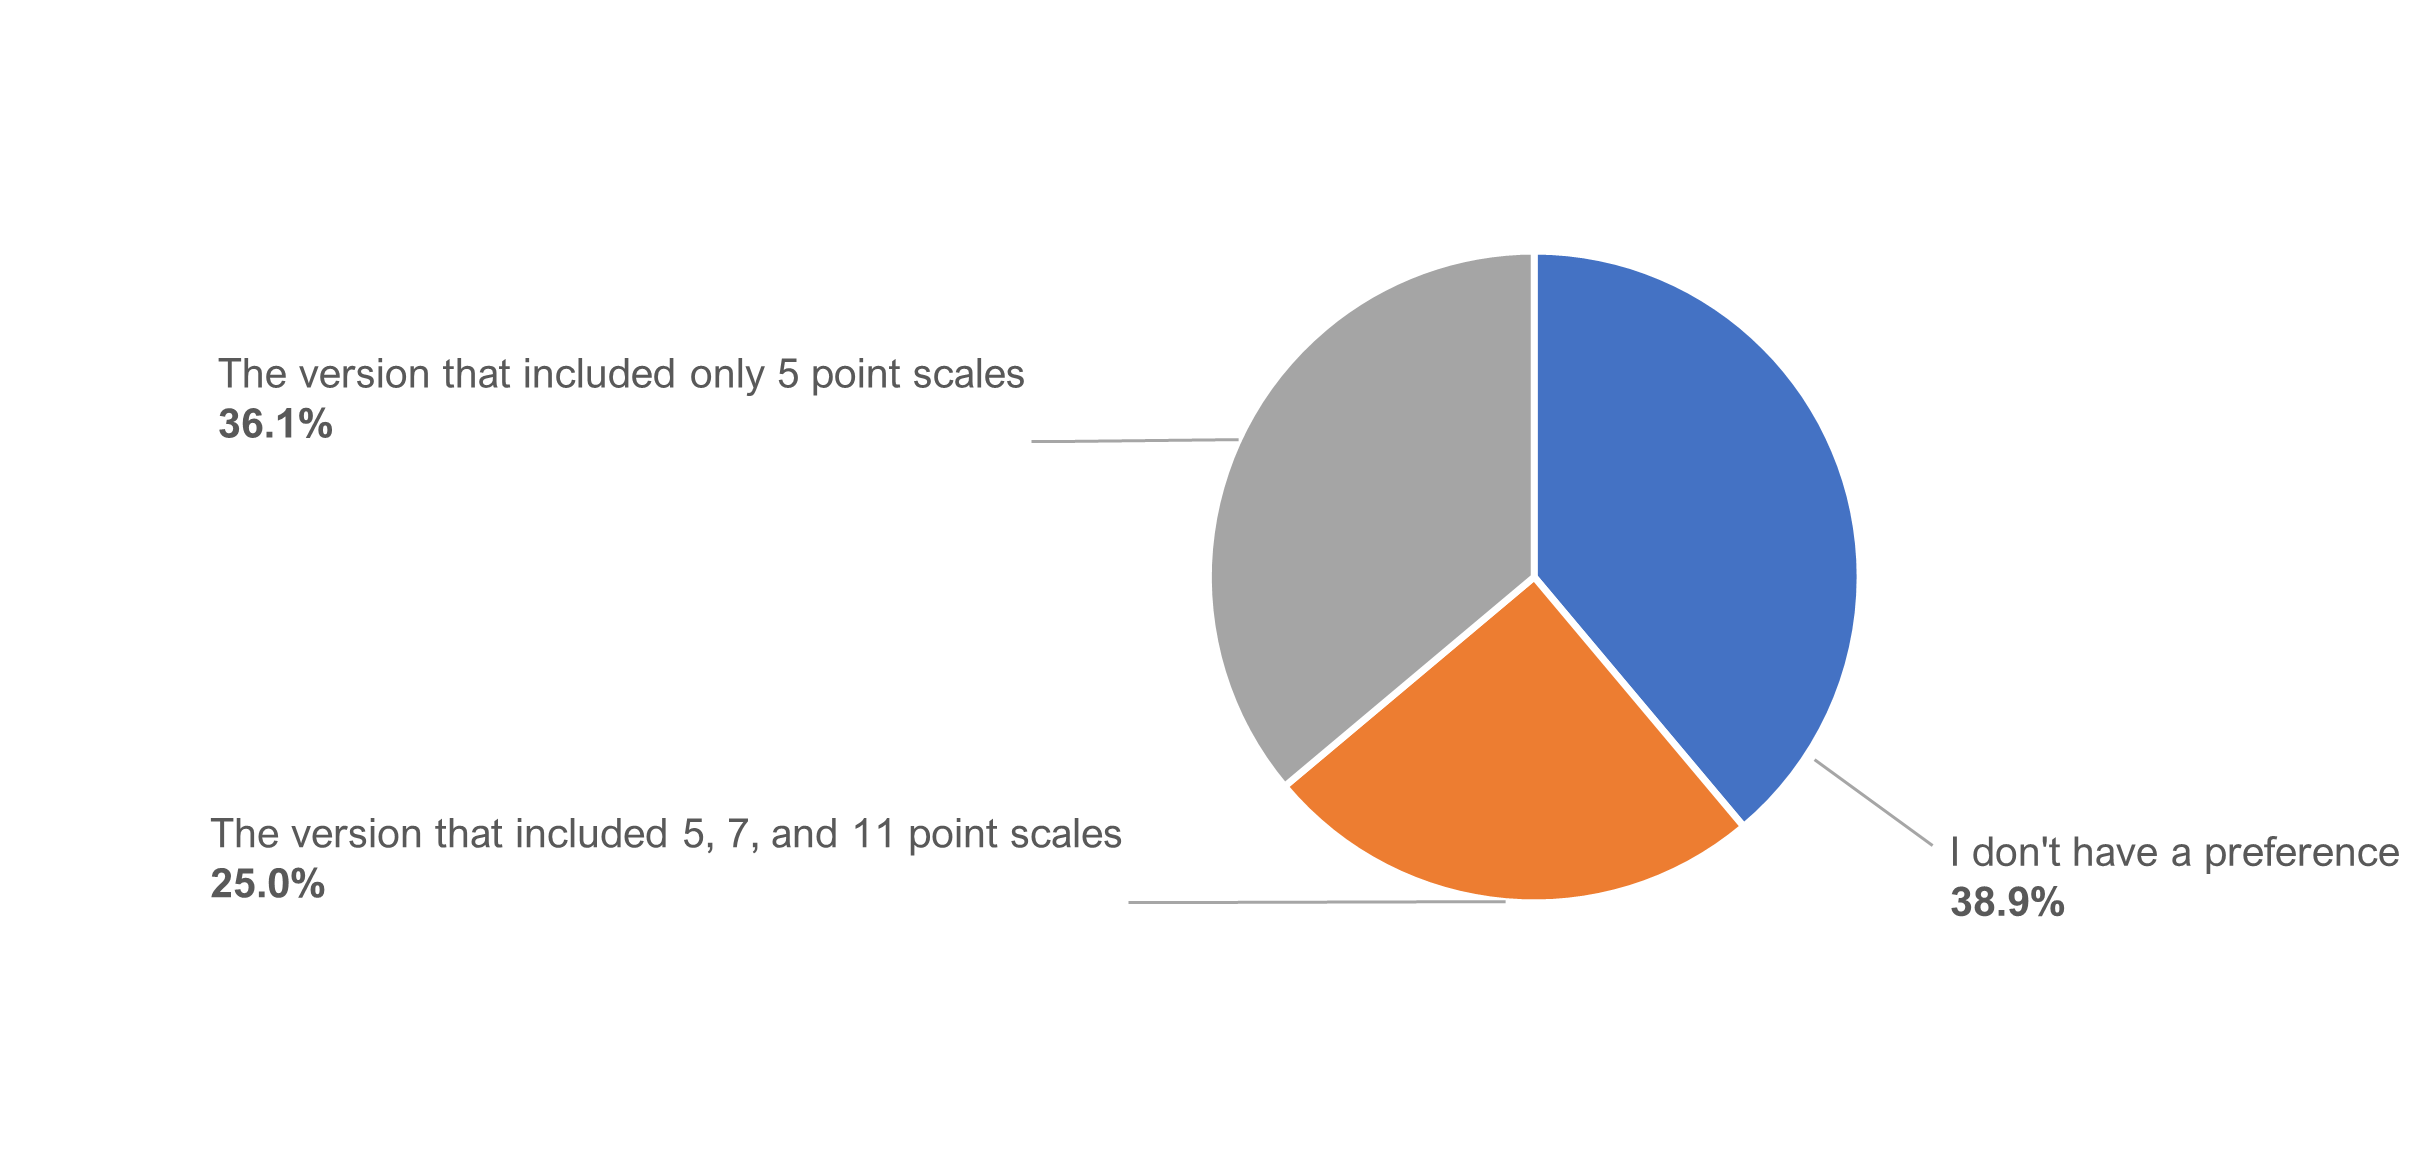
About 40% indicated having no preference, just over a third preferred the alternate (unvarying) sequence with only five-point scales, and a quarter preferred the standard (varying) sequence. (The difference in preference percentages was not statistically significant, z = 1.02, p = .31.)
Those who preferred the alternate (unvarying) sequence primarily cited its ease and consistency.
- “Easy and universal.”
- “I chose the five-point scale, because it’s easier to pick an answer that way in relation to how you feel about the question being asked. Any higher scales than that make it difficult because you might debate which point to choose and it just wastes time or causes frustration.”
- “Less choices equals less thought and a seemingly easier decision.”
Those who preferred the standard (varying) sequence primarily focused on how more response options allows them to precisely match their attitude to a number.
- “More numbers allows you to give a more precise answer.”
- “I like a more broad scale, it allows for more precise answers.”
- “I think you’re able to give a better response with more options. I liked that a lot better!”
Summary and Takeaways
To understand whether varying the number of points in a scale causes confusion or errors, we conducted a Greco-Latin experiment that presented participants with a task (easy or hard) and questions with only 5-point scales and compared it to the results with a task with five-, seven-, and eleven-point scales. Data from 279 participants found
No differences in response patterns for means or top-box scores. We found no compelling evidence for differences in response means or top-box scores based on varying the number of points. Although we had anticipated the possibility of a difference, especially when the number of points changed from seven to five and from five to eleven, there was no noticeable difference in the response patterns at those transitions.
Eighty percent didn’t notice the change in rating scales. Not only were response behaviors similar in the two item sequences, but also over 80% of respondents reported not noticing any difference in formats. This suggests that most respondents did not experience additional cognitive effort or confusion when presented with varying numbers of response options.
Most have no preference. Of the 20% (36 participants) who noticed different numbers of response options, most (38.9%) had no preference for one sequence over the other. Among those who did express a preference, 13 (36.1%) preferred the alternate (unvarying) sequence due to its perceived ease, while 9 (25.0%) preferred the standard (varying) sequence because they felt they were able to provide more precise ratings (no statistically significant difference in these preferences).
Key finding. We found little evidence that varying the number of response options in a series of items in UX research is more difficult for respondents or that it changes their rating behaviors, at least in this experiment (compare observed results with the patterns shown in Figure 3 illustrating no effect of the different item sequences).
Key recommendation. In general, we recommend using the standard versions of well-known items like SEQ, UX-Lite, and LTR that use seven, five, and eleven points respectively. When crafting custom items, we recommend using five-point scales when items will be combined into multi-item scores (such as the UX-Lite), seven-point (or more) scales for standalone ratings of attitudes and experiences (such as the SEQ), and eleven-point scales for behavioral intentions (such as LTR), which are often used as dependent variables in regression/key driver analyses.