 Driving down the road while only looking in the rearview mirror … that gives you a good idea of where you’ve been, but unless the road behind you is exactly like the one in front of you, you may run into some obstacles, to put it mildly. Safe and effective driving means looking forward and backward.
And the same applies to using metrics in business and in measuring the user experience. Managing by metrics is nothing new and is often used as part of a larger framework such as Total Quality Management, Six Sigma, OKR (Objectives and Key Results), Management by Objectives, and Four Disciplines of Execution (4DX).
This last framework is featured in the book The 4 Disciplines of Execution by Sean Covey and Chris McChesney. Sean is the son of the late Steven Covey, famous for The 7 Habits of Highly Effective People.
In the 4DX book, Covey and McChesney make the distinction between metrics that are leading (looking forward) and lagging (looking backward). They emphasize the importance in management of paying attention to leading metrics that are key drivers of lagging metrics. This distinction is quite similar to the idea of dependent and independent variables, a core part of most scientific measurement.
When it comes to UX metrics it can be helpful to think of metrics not as just lagging (dependent) and leading (independent) but as a causal chain from lagging to leading, with metrics acting in intermediate steps and as both leads (inputs) and lags (outcomes). Here is a way to think about leading and lagging measures in UX measurement.
Ultimate Lag Measure
Ultimate lag measures are the outcomes you hope to achieve. They’re the results of other activities and don’t directly affect any subsequent measurements. These are your goals or targets, typically with a deadline set for their measurement. Once the time comes to measure them, it’s too late to do anything about them other than to note whether you’ve achieved your objectives and, if you haven’t, to figure out what changes need to be made moving forward. Using scientific thinking, you develop hypotheses about what leading measures were likely responsible for limiting the achievement of your final lag measure goals, then develop and execute plans to improve the targeted leading measures.
Common lag measures include:
- Revenue (product or business)
- Profit
- Sales
- New subscriptions (such as SaaS)
- Subscription renewals
- Recommendations and referrals
- Product usage (logins, features used)
Intermediate Lag Measures
While ultimate lag measures represent final outcomes in the causal chain, other metrics lag as outcome measures but provide a preliminary indicator of the ultimate lag measures. Some examples of intermediate lag measures include
- Net Promoter Score (NPS)
- System Usability Scale (SUS)
- Standardized User Experience Percentile Rank Questionnaire (SUPR-Q)
- Usability Metric for User Experience Lite (UMUX-Lite)
Metrics such as these are usually the primary output on scorecards from UX benchmark studies and can typically be collected more frequently than ultimate lag measures. Even within this category, some intermediate lag measures may be drivers of others. For example, it’s well known that SUS and NPS are correlated, but it’s more likely that levels of perceived usability (SUS) affect subsequent likelihood-to-recommend (NPS) than for levels of likelihood-to-recommend to affect the magnitude of perceived usability. Regardless, these intermediate lag measures are clearly at a different place in the causal chain than the lower-level lead metrics that drive them. You can tell because companies can’t stay in business by improving just NPS or SUS scores!
Secondary Lead Measures
Measures such as the SUS and NPS are themselves influenced by experiences. In UX research and usability engineering, these are metrics like
These secondary lead metrics are typically the task-level metrics collected in a usability test and are themselves affected by primary lead measures.
Primary Lead Measures
Primary lead measures can be thought of as the first movers in the causal chain to ultimate UX (and often business) outcomes, and they include
UI problems, software/hardware bugs, and inadequate sets of features are the root causes for task failure, long task times, errors, and poor ratings of ease. The effects of problems, bugs, and inadequate features on downstream metrics can be moderated (made better or worse) by users’ preexisting attitudes toward a company/brand and their prior experiences with the company/brand or its competitors.
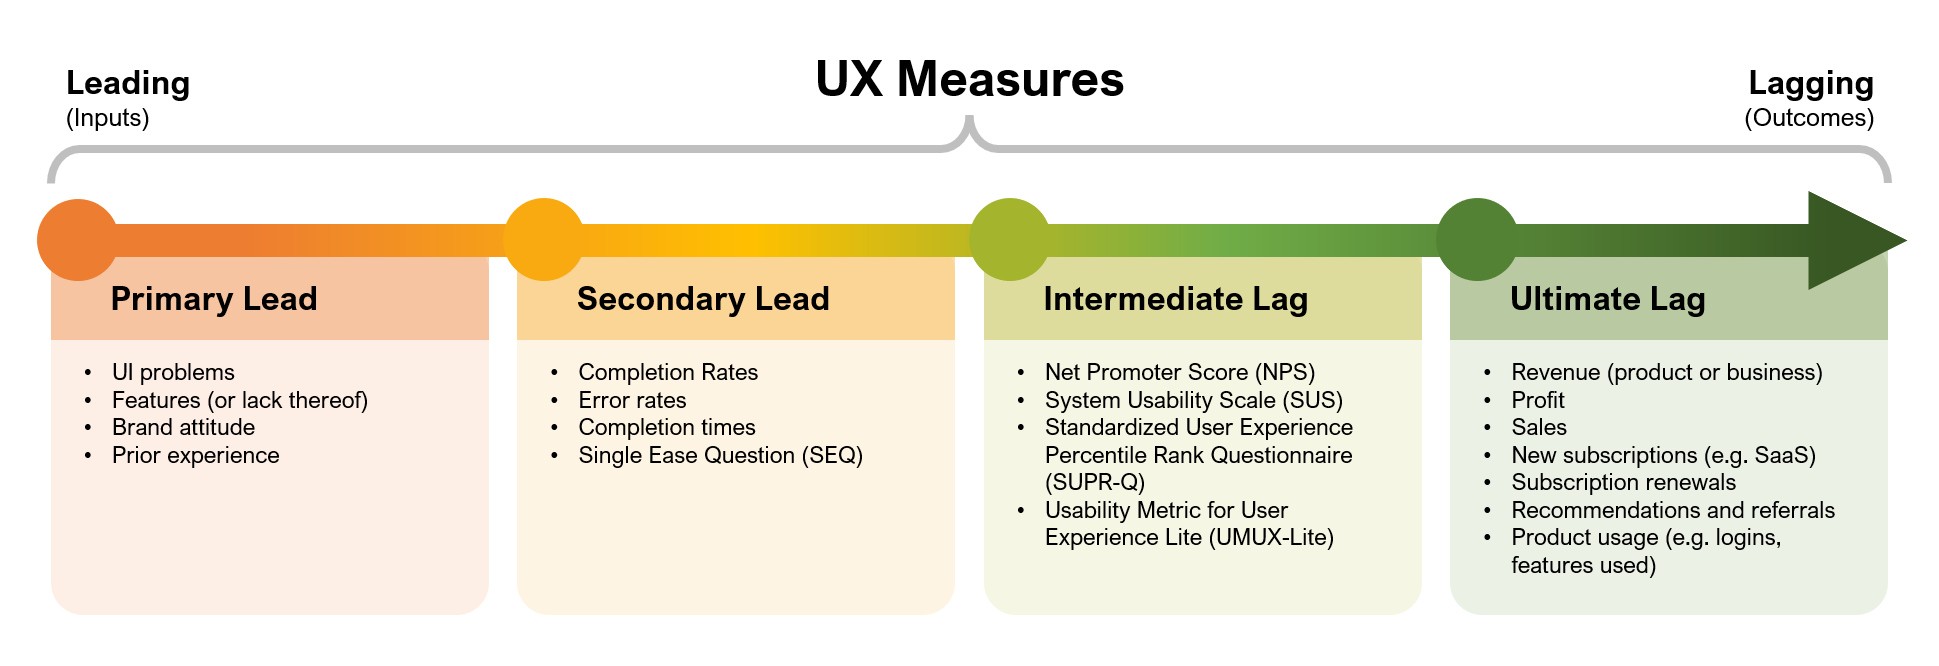
Figure 1. Model of Primary Lead to Ultimate Lag measures.
The figure shows that finding and fixing UI problems in a usability test (Primary Lead) will improve completion rates on tasks (Secondary Lead), which in turn improves SUS scores (Intermediate Lag), leading to more product usage (Ultimate Lag).
Leading and Lagging Measures in Technology Acceptance
The idea of using leading and lagging measures is actually quite fundamental to core principles around why people do and don’t use new technology products.
The well-known Technology Acceptance Model (Figure 2) came out of information systems management research over three decades ago. It has been very influential in demonstrating the sequence of internal states of users that lead to the ultimate lag measure of Actual System Use (Attitude > Intention > Behavior), driven by perceptions of usefulness and ease of use. Using the nomenclature we’ve adopted for this article, the causal chain from Perceived Usefulness and Perceived Ease of Use through Behavioral Intention to Use are intermediate lag measures.

Figure 2. Technology Acceptance Model (TAM) from Davis, 1989.
In the TAM, the leading measures are bundled together as External Variables. Much of the research using the Technology Acceptance Model has been to understand how different bundles of external variables, hypothesized to affect perceived usefulness and ease of use, actually do so. Recent research has shown that the metrics of the Technology Acceptance Model, when adapted to measure user experience instead of anticipated use, behave in a similar way to predict intention to recommend.
Applying Leading and Lagging Metrics
Here are three examples of using leading and lagging measures to improve user experience and ultimately impact the business.
Adding a Missing Feature
A software company we worked with added a new feature to automate the ability to integrate contacts into their sales application (primary lead). This significantly reduced the time taken to complete the adding contacts task (secondary lead). Faster task times and the inclusion of the feature improved SUS scores (intermediate lag), and the task time improvement was featured prominently in a marketing campaign to improve subscription sales (ultimate lag).
Removing a Feature: Out of Sight, Out of Mind?
In the late 1980s, a major computer manufacturer decided to cut costs by removing the hardfile in-use indicator from their floor-standing personal computers because, they reasoned, users wouldn’t see it under their desks. Upon hearing this, the human factors department conducted a study with 20 randomly selected users of floor-standing computers on site, getting their permission to cover the indicator with opaque tape. After one week, seven users (35%) had removed the tape because they were annoyed by the absence of the indicator, which they had been unconsciously using as a system status check. The discovery of the issue and consequent presentation of the results were too late to stop the shipment of the product. However, having been forewarned, there was an effort to monitor users’ reactions in the field, which was quickly determined to be consistent with the onsite UX study. For these reasons, the hardfile in-use indicator was returned to all following floor-standing models in that product line, and the sales group was prepared to handle customer complaints.
In this example, the measurement of the percentage of users removing opaque tape from an indicator was a primary leading measure that was predictive of downstream customer dissatisfaction (Intermediate Lag). (For more details, see p. 120 in Quantifying the User Experience.)
Iterative Design for the Olympics
Gould et al. (1987) applied iterative evaluation to the design of a successful messaging system for the 1984 Olympics. Once released, it ran 24 hours per day for the four weeks the Olympic villages were open and was successfully used over 40,000 times during the four-week event.
In this example, the application of an early version of User-Centered Design with mixed methods and iterative prototyping identified numerous usability issues (Primary Lead) that upon correction improved task performance (Secondary Lead), which led to a significant amount of system usage (Ultimate Lag).
Summary and Takeaways
Many UX metrics can be both lead and lag measures. For example, we’ve seen how attitudes toward usability (SUS) are correlated with intent to recommend (NPS).
The causal chain starts with primary lead measures of atomic, low-level user experiences plus prior brand attitudes and product experience, which drive secondary lead measures at the task level, which in turn drive intermediate lag measures at the product level, affecting ultimate lag measures.
The earlier a metric is in the causal chain, the more diagnostic it tends to be. There is little diagnostic information in ultimate lag measures. That’s one reason why Covey and McChesney urge managers to act on lead measures (their Discipline #2).
It’s rare for a single improvement in a primary lead measure to have an impact on ultimate lag measures. The causal chain is just too long and is often affected by non-UX-driven decisions such as price points, supply chain issues, and broad economic events (e.g., pandemics).
Nevertheless, mixed-method design and development practices such as User-Centered Design, Design Thinking, and Scientific Thinking typically bring about many improvements in primary UX lead measures, and there is substantial evidence that those efforts improve secondary UX lead measures, intermediate UX lag measures, and ultimate lag measures.