 User experience research has a wide variety of methods. The variety can be both inspiring and daunting—where do you start, what should you master?
We recommend two approaches to extend your knowledge of UX methods. First, understand how the many methods relate by reviewing our taxonomy. Second, understand which methods are used the most and least and how that usage has changed.
We’ve been tracking the reported usage of methods for over a decade using the UXPA salary survey. The survey provides a comprehensive and unbiased picture of UX methods usage and how that usage has changed over time. The 2024 survey contains data from 444 UX professionals from 37 countries. It has a similar composition to (but a bit smaller than) the data from earlier surveys.
Here’s an overview of how common methods are used and how that use has changed since our 2022 analysis and over the last ten years. Differences greater than 10% across years or methods are statistically significant.
The Methods UX Professionals Reported Using in 2024
Figure 1 shows the 33 methods tracked in the 2024 UXPA salary survey. Percentages ranged from 7% for eye tracking to 75% for user research/interviews/surveys. In addition to user research, other methods used by 50% or more of respondents were usability testing (69%), personas/user profiles (59%), surveys (59%), and heuristic/expert review (50%).

Figure 1: Reported use of 33 UX methods (select all that apply).
User Research
User research is a broad term that encompasses many methods, both qualitative and quantitative. Not surprisingly, most respondents reported doing some form of user research. In 2022, user research (including interviews and surveys) overtook usability testing as the most used UX method and, as shown in Figure 1, kept its top position in 2024 despite dropping from 84% in 2022 to 75% in 2024 (close to 76% reported in 2018). Figure 2 shows historical comparisons of the usage frequency of user research methods from 2014 through 2024.

Figure 2: Percentages of user research methods UX professionals reported using 2014–2024.
Surveys continue to be a popular UX research method despite a slight drop in reported use from 63% in 2022 to 59% in 2024. Use of satisfaction surveys remained steady from 2022 to 2024 (39%). Despite some criticism, we suspect surveys will remain a popular method, especially as they continue to be integrated into other methods, such as unmoderated studies.
In 2024, there were small drops in reported use of analysis of web metrics and focus groups, continuing trends over the past ten years. Reported use of market research has been stable over that period.
Usability Testing
Usability testing was the second-most used UX method in 2024 (69%, see Figure 1) despite dropping from 77% in 2022 (Figure 3). In addition to continued use of traditional lab-based testing, usability testing has evolved over the last decade to include options for unmoderated and remote moderated testing (e.g., our MUiQ® platform). It’s not surprising this core UX method remains widely used in 2024.
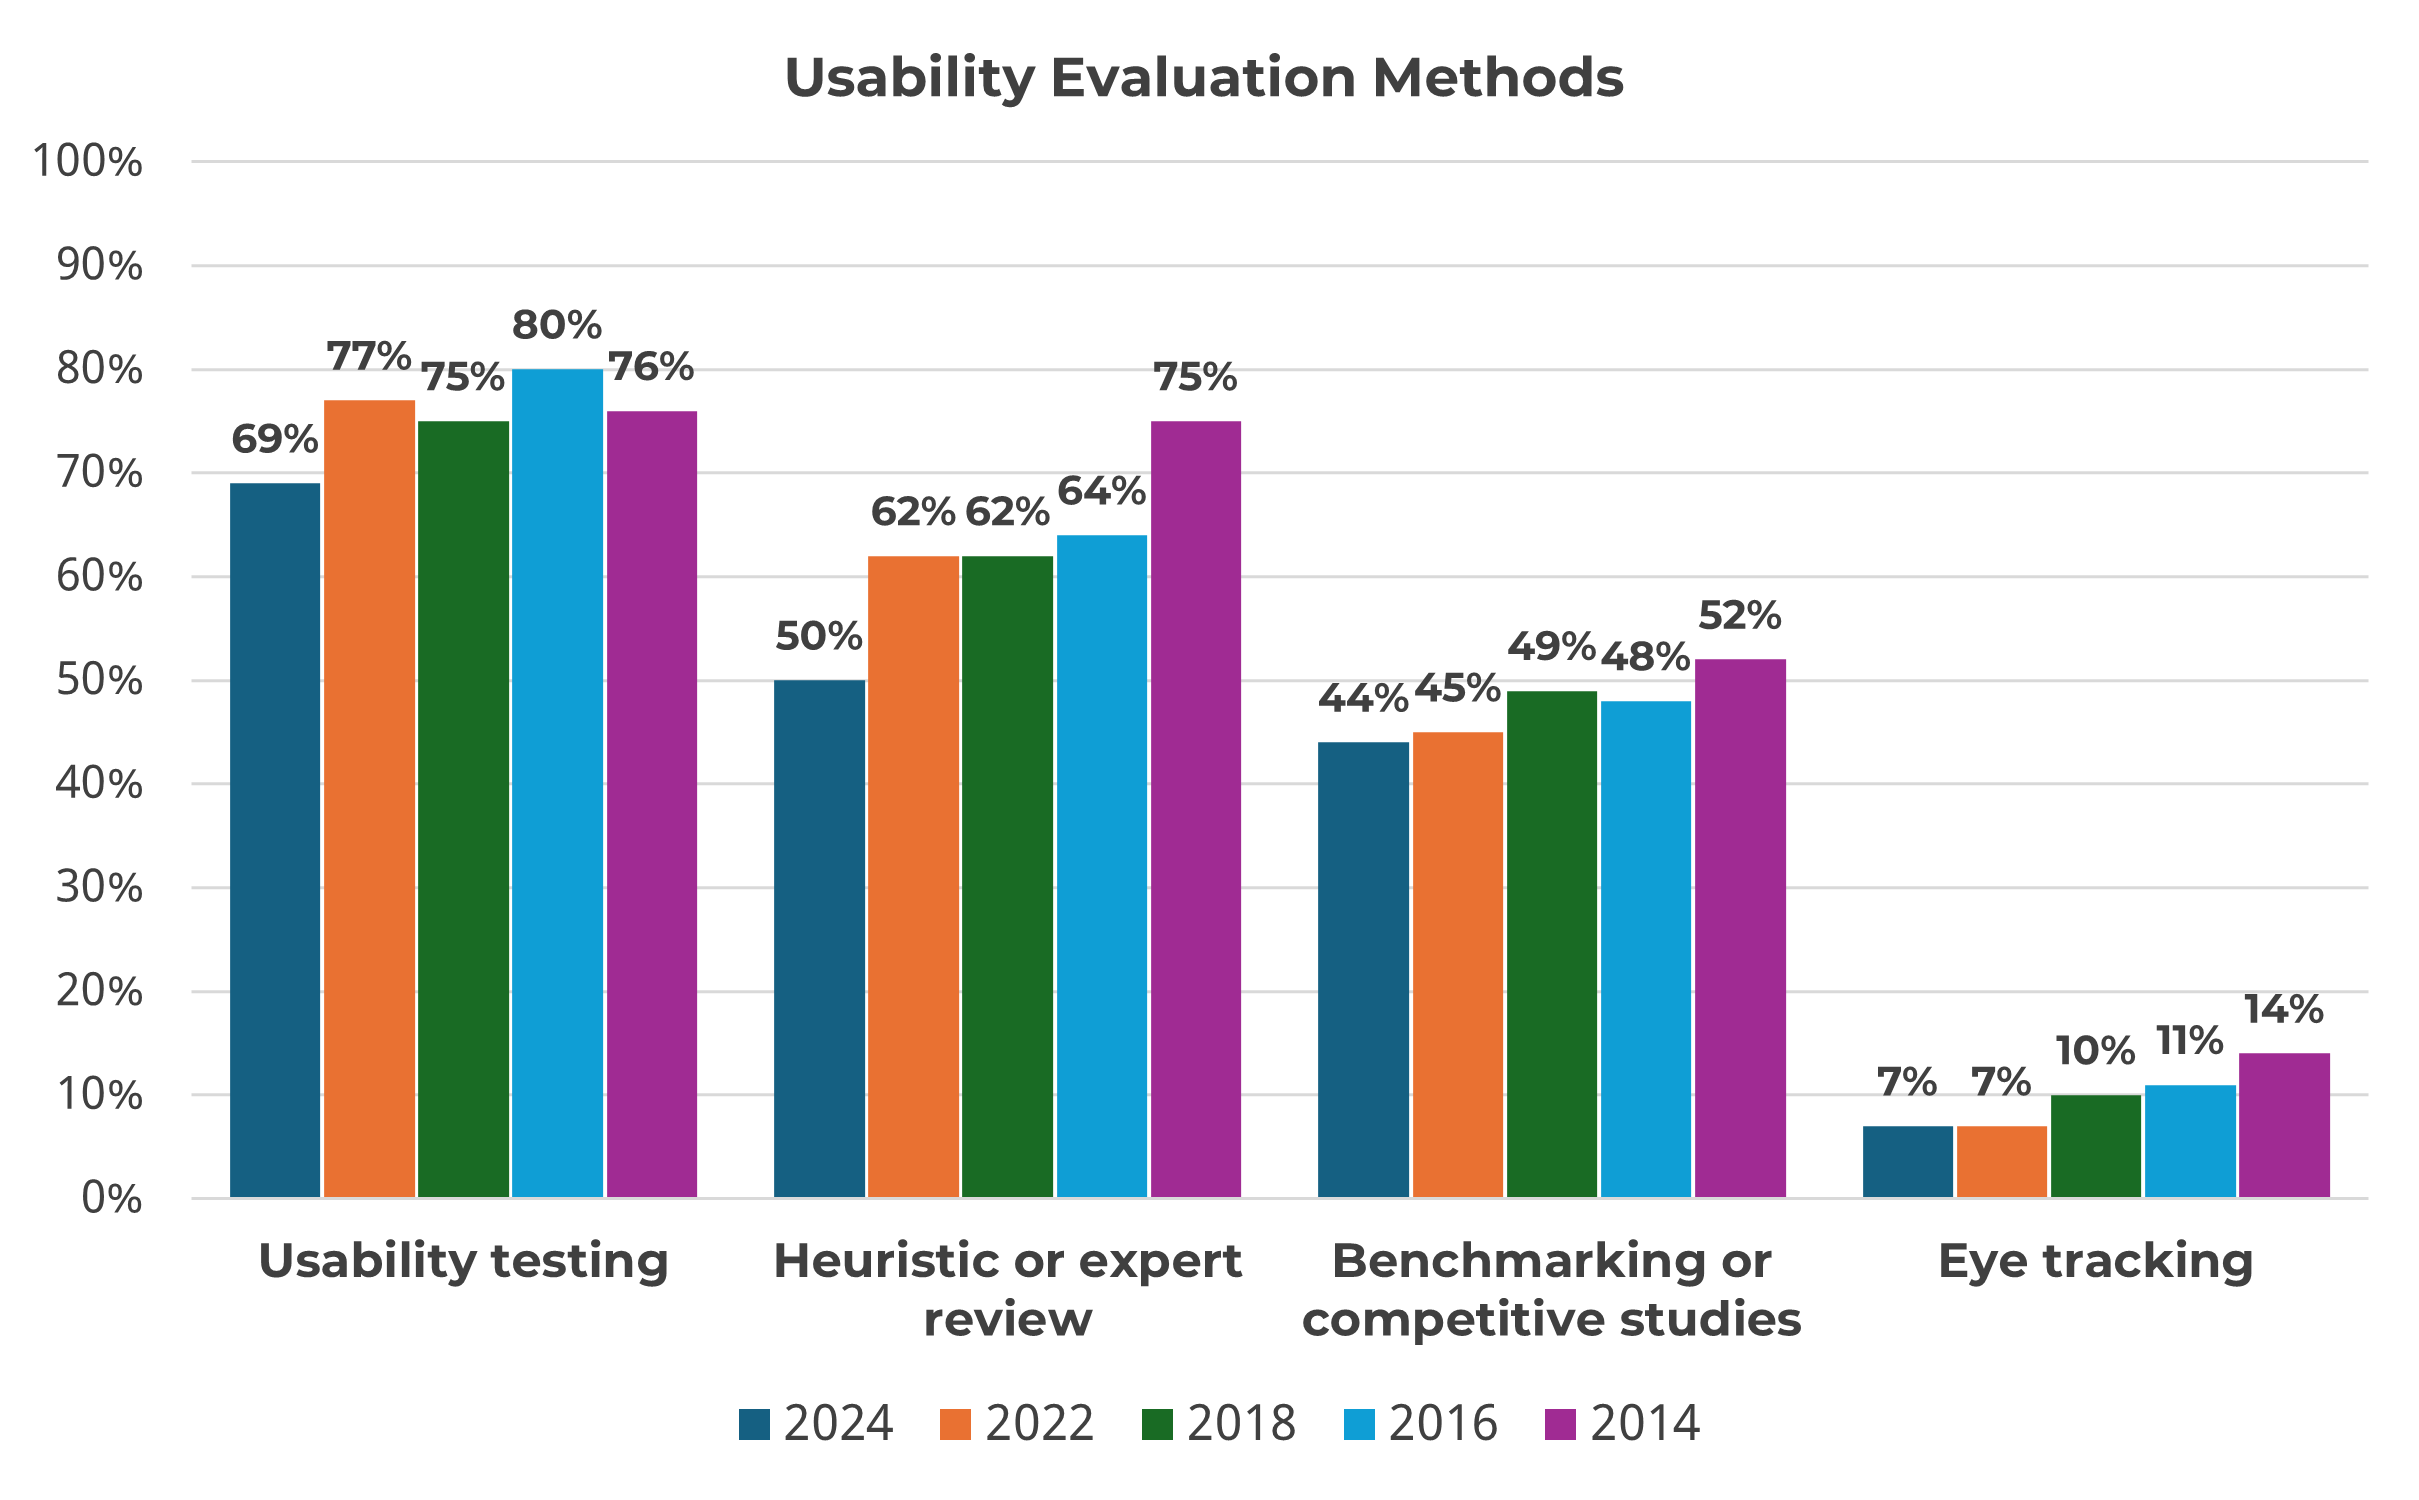
Figure 3: Percentages of usability evaluation methods UX professionals reported using 2014–2024.
Heurist/Expert Reviews
Expert reviews and heuristic evaluations are analytic techniques that require an evaluator to review an interface against a set of guidelines or principles. These methods are frequently used because they’re faster and less expensive than many other methods (though often followed by UX methods that are more grounded in actual user behavior, like usability testing). Continuing a downward trend observed over the past ten years, 50% of respondents reported using these methods in 2024 (compared to 62% in 2018 and 2016).
Benchmarking
Benchmarking products and websites against competitors using standardized metrics is an excellent way to understand how design changes affect the user experience. We strongly recommend this approach for tracking interface changes over time. For guidance on running benchmark studies, consult Jeff’s book, Benchmarking the User Experience.
In 2024, 44% of respondents reported benchmarking or running competitive studies, about the same as 2022 (which is good), but the usage of this method has declined since 2014 (52%).
Eye-Tracking
Eye-tracking continues to remain a niche method, with only 7% of respondents reporting its use in 2024 and 2022, continuing its downward trend since 2014 (when 14% reported using it). While eye-tracking has gotten a lot cheaper in the last decade, it still requires considerable time and training. For example, when we conduct eye-tracking studies for our clients, we allot around ten minutes of processing and analysis time for every one minute of video.
Defining Users and Requirements
Understanding who users are and what they’re trying to accomplish with an interface can be essential to improving the user experience (Figure 4). Personas have remained a popular method for defining users despite criticism of how they’re implemented. It’s not surprising, then, that one of our most popular articles is on how to make them more scientific.

Figure 4: Percentages of user definition methods UX professionals reported using 2014–2024.
The percentage of respondents reporting the use of user definition methods declined for all four methods in 2024, although their rank order remained the same. The drops were particularly sharp for requirements gathering, contextual inquiry/ethnography, and task analysis.
Information Architecture
We’ve consistently found that the ability to find information easily differentiates good websites and products from bad ones. There’s a science to findability that involves a number of methods and techniques. The UXPA survey asks about one popular method, card sorting (included in MUiQ), which has remained relatively popular despite some decline in 2024, along with a sharp drop in overall information architecture from 2022 to 2024 (Figure 5).
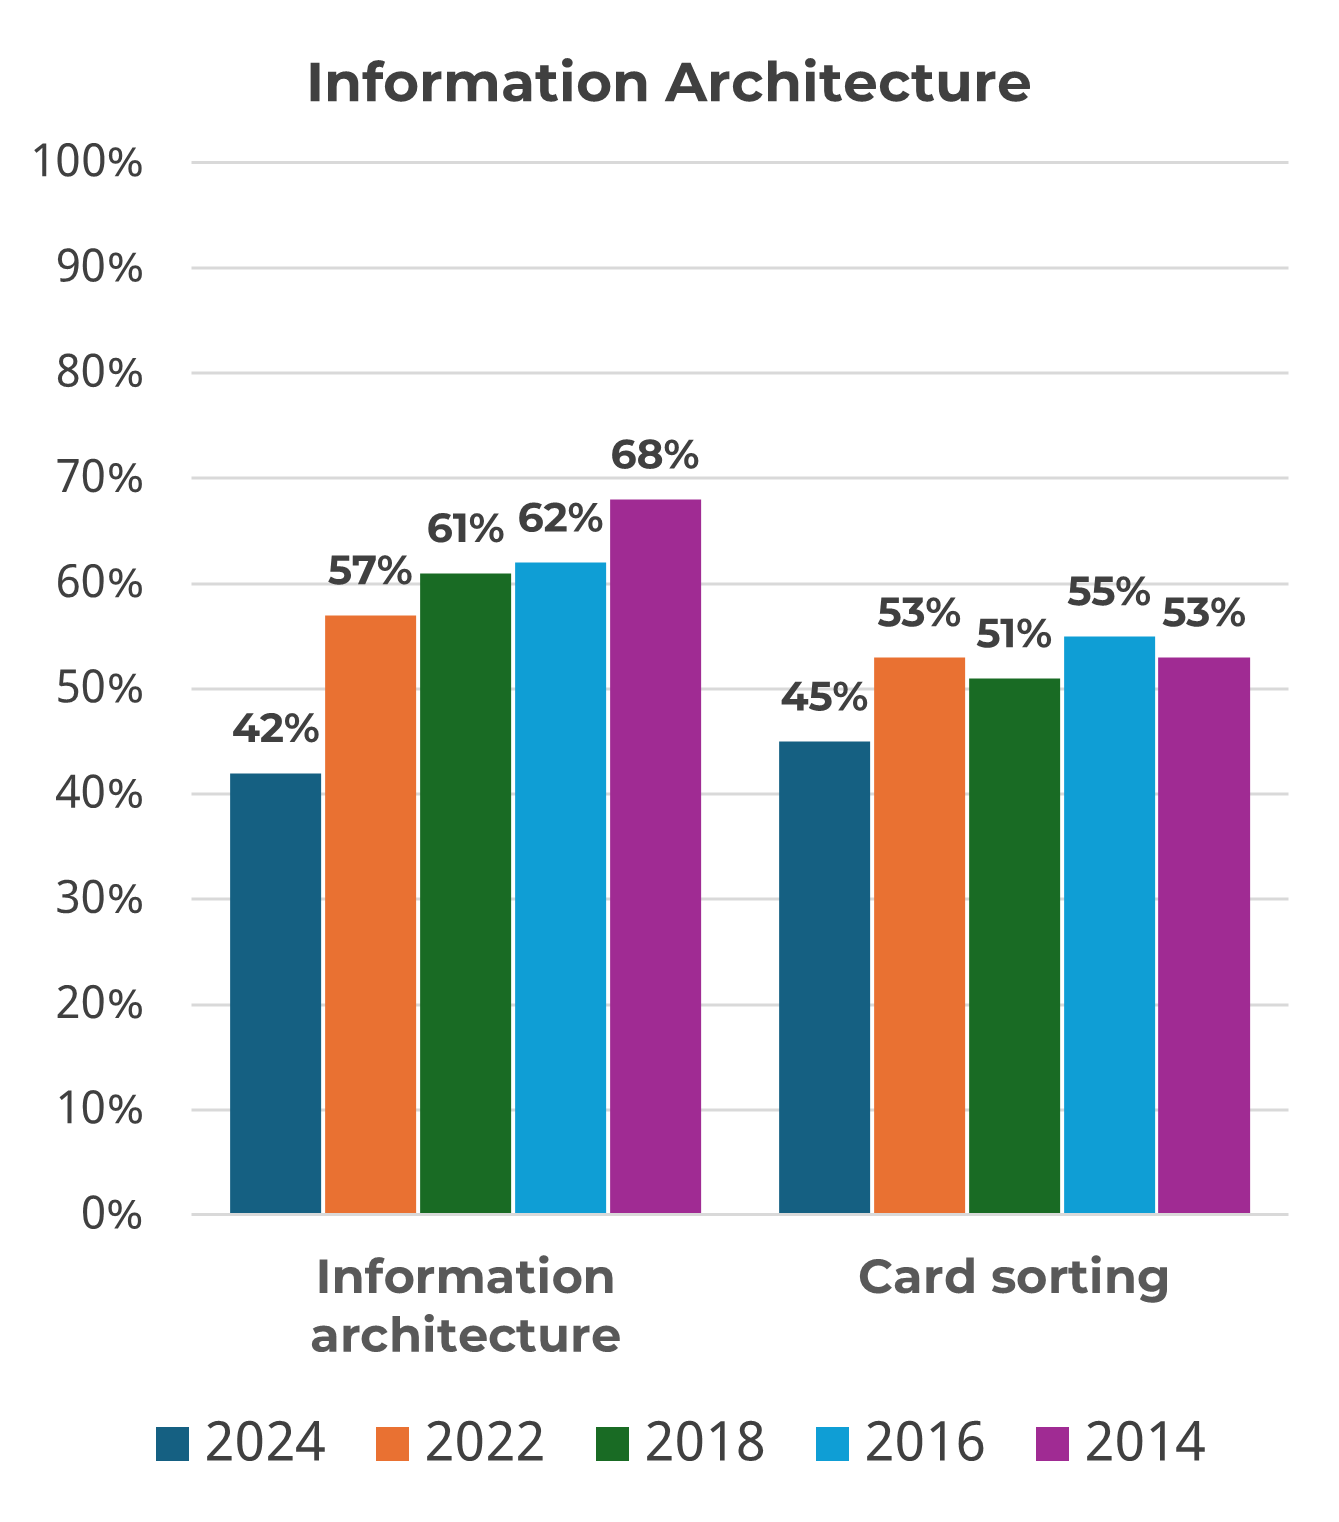
Figure 5: Percentages of information architecture methods UX professionals reported using 2014–2024.
Prototyping and Design
Design is a fundamental part of the user experience; however, fewer respondents reported using some form of prototype or wireframe in 2024 (37%) compared to previous years (Figure 6). All forms of prototyping and design declined in 2024 compared to 2022 (statistically significant differences except for content creation, technical writing, and web development). We test high-fidelity prototypes quite frequently on desktop and mobile in MUiQ and have found UX metrics to be reliable, even when used on these early-stage prototypes.

Figure 6: Percentages of prototyping and design methods UX professionals reported using 2014–2024.
Accessibility
Accessibility remains a niche activity for UX professionals. There has been a slight but steady year-to-year growth in accessibility testing since 2014 (Figure 7), but there was an eight-point drop in accessibility expert reviews from 2022 (21%) to 2024 (13%).

Figure 7: Percentages of accessibility methods UX professionals reported using 2014–2024.
Strategy, Project Management, and Training
Strategy, project management, and training in UX have been consistently common activities since 2014, with more than a quarter of participants doing some project management, training, content strategy, and strategic consulting each year (Figure 8). In 2024, there were declines in all categories, with significant drops for conceptual design, training, and content strategy.
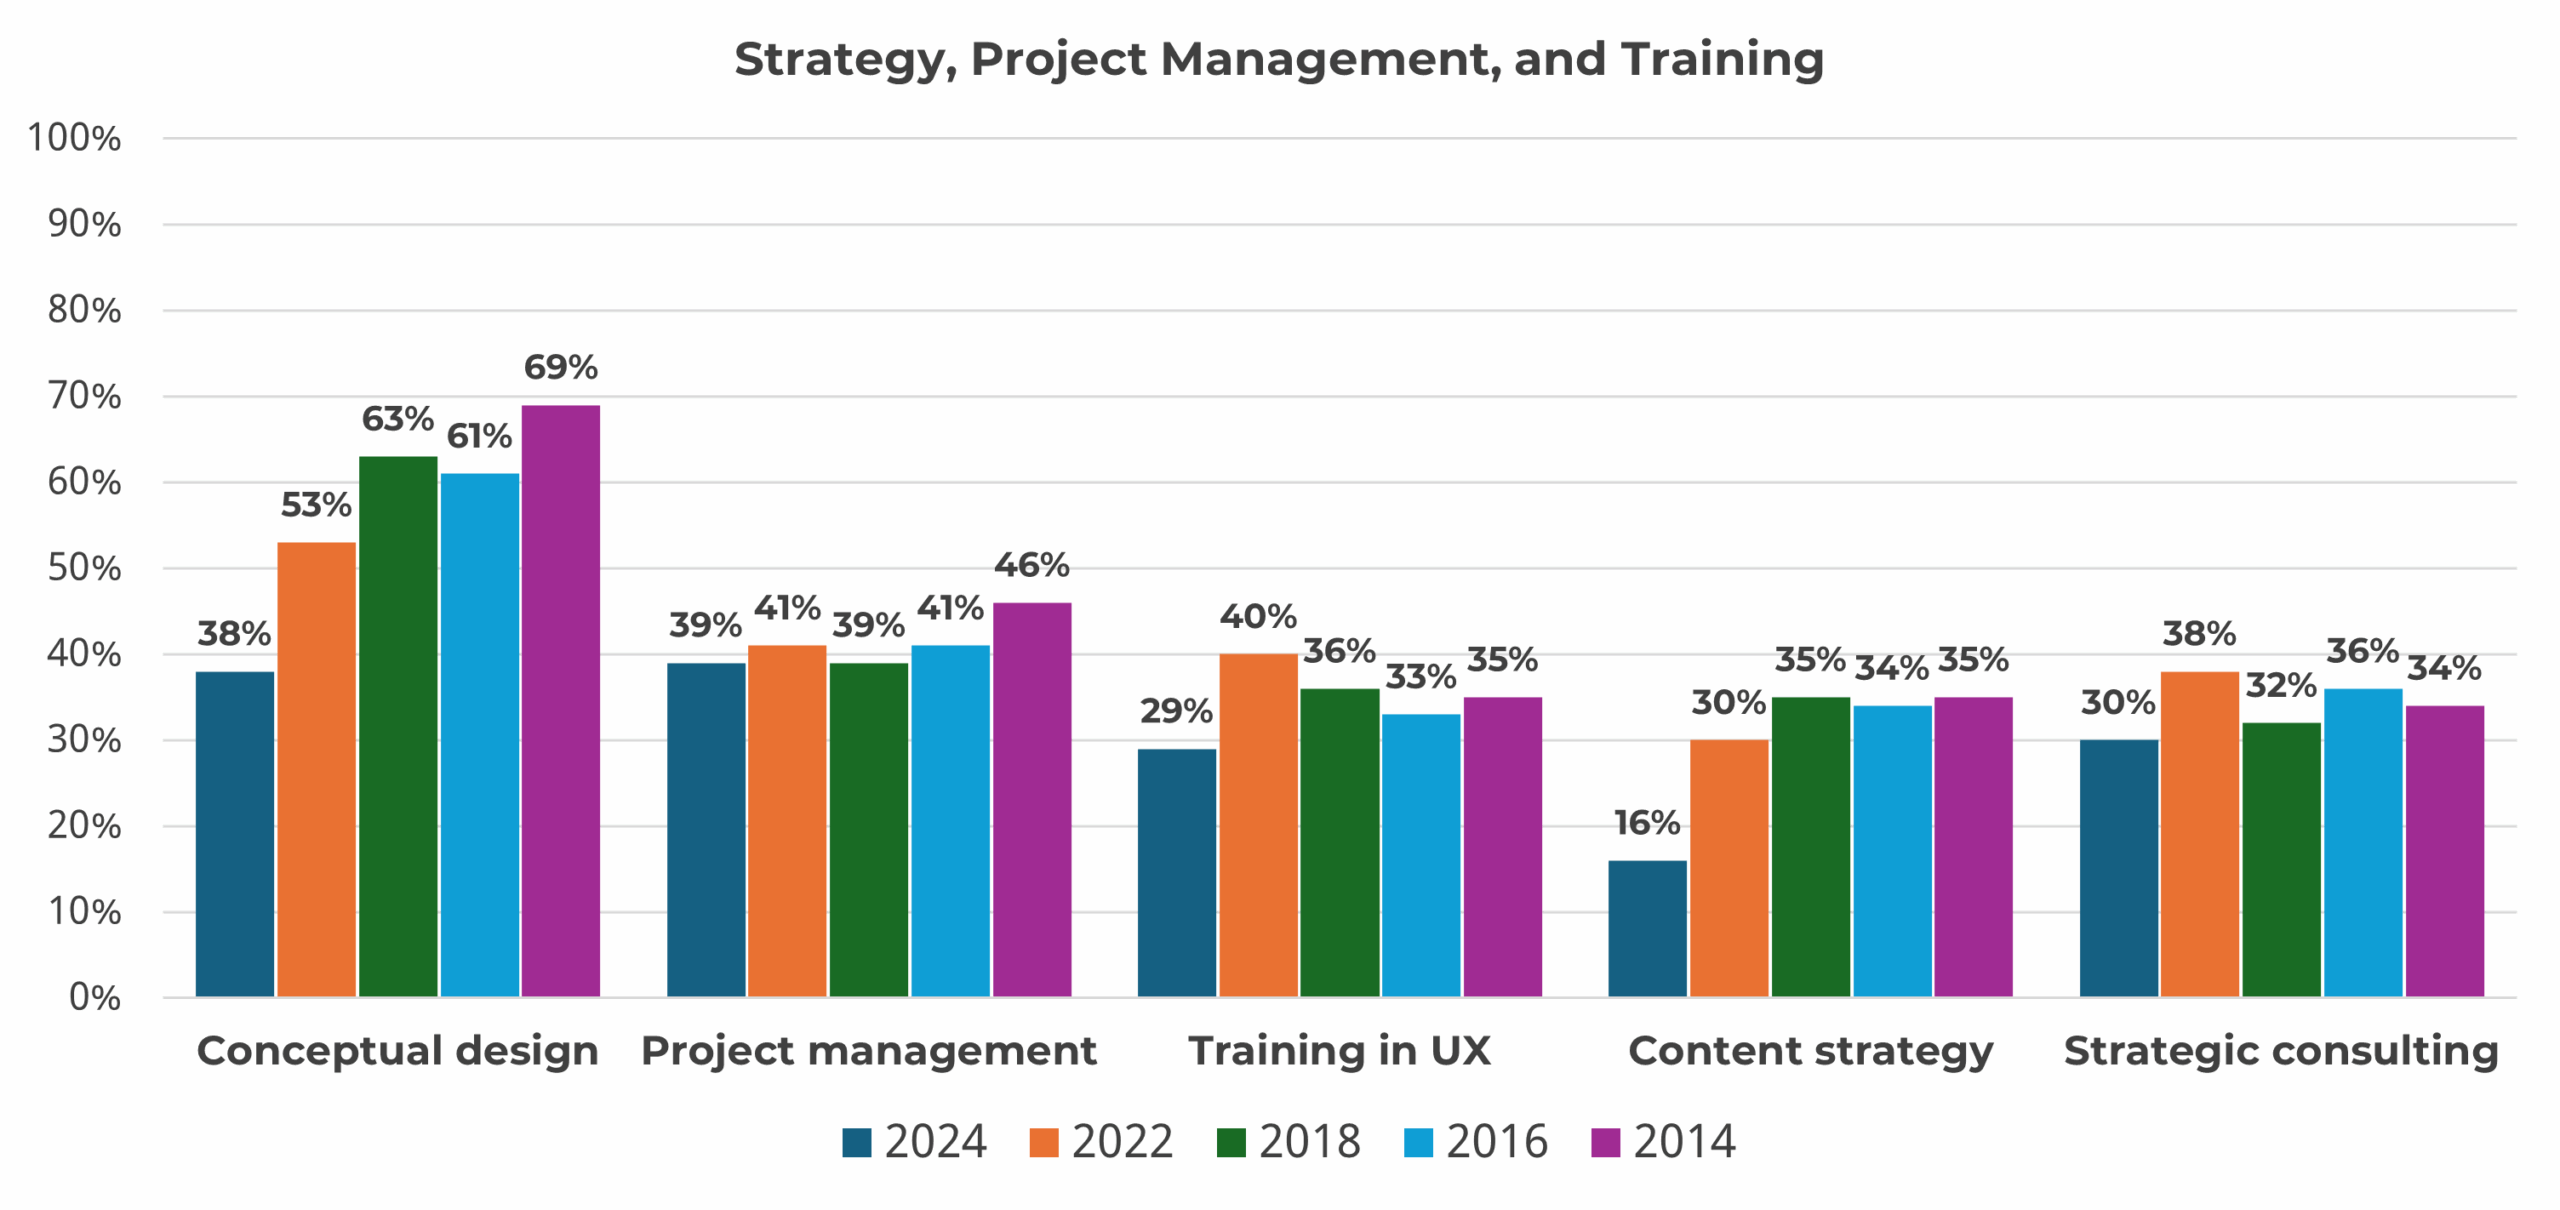
Figure 8: Percentages of strategy, training, and design thinking methods UX professionals reported using 2014–2024.
Summary and Discussion
Relative to 2022, the results of the 2024 UXPA salary survey revealed declines in the reported percentages of use for most of the tracked UX methods. The methods for which reported use dropped by more than ten percentage points were:
- Heuristic/expert reviews (from 62% to 50%)
- Requirements gathering (from 50% to 37%)
- Contextual inquiry/ethnography (from 46% to 34%)
- Task analysis (from 43% to 32%)
- Information architecture (from 57% to 42%)
- Conceptual design (from 53% to 38%)
- Training in UX (from 40% to 29%)
- Content strategy (from 30% to 16%)
- Creating prototypes (from 60% to 37% for low fidelity, 49% to 33% for high fidelity)
- Interface/interaction design (from 53% to 36%)
- Visual/graphic design (from 31% to 21%)
None of the methods increased in usage from 2022 to 2024, but two held steady:
- Satisfaction surveys (steady at 39%)
- Eye tracking (steady at 7%)
Despite the drops in the reported frequencies for UX methods from 2022 to 2024, the rank order of methods changed only slightly with very high linear and rank correlations (respectively, .95 and .94, Figure 9). This demonstrates the consistency of the relative importance of the UX methods tracked in the UXPA salary surveys.

Figure 9: Scatterplot of UX method percentages in 2022 and 2024 with callouts for the top methods.
The drop in reported percentages for the methods could be due to various reasons. For example, following COVID, we saw a reduction in the participation of UX professionals in the survey from over 1,000 respondents between 2014 and 2018 to closer to 500 in the last two rounds. On the other hand, there wasn’t much difference in the sample sizes for 2022 and 2024, so another potential cause could be that the 2024 respondents used similar methods in similar proportions to the 2022 sample but have started engaging in other untracked methods. We hope to investigate this the next time we assist the UXPA with planning and executing their salary survey.